SF2A 2008
Dust-enshrouded star formation in XMM-LSS galaxy clusters
Abstract
We present an investigation of the dust-enshrouded activity in a sample of X-ray selected clusters drawn from the XMM-LSS survey in the redshift range z 0.05 - 1.05. By taking advantage of the contiguous mid-IR coverage of the XMM-LSS field by the Spitzer SWIRE legacy survey, we examined the distribution and number density of mid-IR bright sources out to the cluster periphery and its dependence on redshift to probe the obscured side of the Butcher-Oemler effect. Toward intermediate redshift clusters we identified surprisingly high numbers of bright 24 m sources, whose photometric redshifts are compatible with cluster membership. The stacked surface density profile of 24 m sources in clusters within four redshift bins gives evidence for an excess of bright mid-IR sources at redshift z 0.4 at cluster-centric radii 200 - 500 kpc. Some traces of excess appear to be present at larger radii as well.
1 Introduction
Long after their collapse and the formation of the bulk of their stars, clusters of galaxies still accrete new members. Subject to collisions and the effects of the intracluster medium, the infalling galaxies loose their gas and ultimately their ability to form stars. In the local Universe,it is now established that star formation is suppressed in galaxy clusters. However, at z 1 a reversal trend has been recently observed, with evidence of enhancement of star formation activity within higher density environments (Elbaz et al. 2007; Marcillac et al. 2008).
At intermediate redshifts, observations with ISOCAM, onboard the ISO satellite, of a few individual galaxy clusters suggested the presence of an infrared Butcher-Oemler effect (Fadda et al. 2000; Duc et al. 2002) and revealed the presence of several particularly active galaxies with total IR luminosities well above L⊙ (Duc et al. 2004; Coia et al. 2005). If powered by dust-enshrouded star formation, as indicated by their spectra, these Luminous Infrared Galaxies (LIRGs) would exhibit star formation rates of several tens of solar masses per year - values that were unprecedented in a cluster environment. The advent of the Spitzer Space Telescope with its wide field of view encouraged further IR studies of galaxy clusters out to the cluster periphery (Geach et al. 2006; Marcillac et al. 2007), essentially confirming an important presence of luminous IR sources in clusters at redshift z 0.4. A first attempt in quantifying an evolution with redshift has been done recently based on a collection of 8 massive clusters in the range z = 0.02 - 0.8, observed at 24m with Spitzer. This study indicates an increasing fraction of mid-IR star-forming galaxies with redshift (Saintonge et al. 2008).
Here we present the first IR study based on an unbiased sample of X-ray selected clusters on a wide contiguous area of the sky covered with 24 m Spitzer observations to probe the obscured side of the Butcher-Oemler effect (Butcher & Oemler, 1984) at intermediate redshifts, out to the cluster periphery.
2 The sample
We considered X-ray selected clusters drawn from the first contiguous 5 deg2 of the XMM Large Scale Structure (XMM-LSS) survey (Pierre et al. 2004) and belonging to the XMM-LSS C1 sample. These clusters obey precise selection criteria based on the properties of their X-ray emission (Pacaud et al. 2007; Pierre et al. 2007) and constitute an unbiased sample of groups and clusters (X-ray temperatures in the range 0.6 – 4.8 keV) that spans the redshift range z 0.05 – 1.05. Part of our analysis included additional C1 clusters that were identified in the – yet unpublished – second 5 deg2 of the XMM-LSS. A wealth of ancillary multi-wavelength data is available for these clusters, including either photometry111Based on observations obtained with MegaPrime/Megacam, a joint project of CFHT and CEA/DAPNIA, at the Canada-France-Hawaii Telescope (CFHT) which is operated by the National Research Council (NRC) of Canada, the Institut National des Sciences de l’Univers of the Centre National de la Recherche Scientifique (CNRS) of France, and the University of Hawaii. This work is based in part on data products produced at TERAPIX and the Canadian Astronomy Data Centre as part of the Canada-France-Hawaii Telescope Legacy Survey, a collaborative project NRC and CNRS. from the CFHT Legacy Survey (CFHTLS fields D1 and W1) or CFHT-Megacam photometry (from complementary observations of the northern part of the XMM-LSS field). About 9 deg2 of the XMM-LSS region of the sky were covered by observations with Spitzer Space Telescope in the four IRAC bands and in the three MIPS channels as a part of the SWIRE legacy survey (Lonsdale et al. 2003). This offered us the chance to investigate the dust-enshrouded activity of galaxies out to large cluster-centric radii. Spectroscopic observations necessary to cluster confirmation and redshift determination were obtained by the XMM-LSS team during a series of dedicated spectroscopic runs at various telescopes (see Table 2 of Pacaud et al. 2007 for details). Furthermore, the XMM-LSS field includes the 02-hr field of the VIMOS-VLT Deep Survey (VVDS; Le Fèvre et al. 2005).
From the C1 sample we selected a subsample of 32 clusters with 24m and optical coverage. For use as a control sample, we compiled a list of randomly selected fields in the XMM-LSS/SWIRE area, by imposing as a constraint a separation of at least 6′ from any catalogued X-ray source. We selected all catalogued 24m sources with flux F(24m) 150 Jy in the direction of these clusters and control fields within a radius of 10′ from either the X-ray position of a cluster or the central coordinates of a control field. The only additional requirement was the presence of an optical counterpart to the 24m sources, to reduce the contamination from spurious 24m detections. Total infrared luminosities of the sources were derived from their 24m fluxes following Chary & Elbaz (2001) and assuming that the sources are all located at the cluster redshift.
3 Surface density profiles of 24m sources in individual clusters and control fields
As a first attempt in looking for any dependence of the distribution of mid-IR sources on the environment, we examined the projected surface density of 24 m sources as a function of cluster-centric radius toward individual clusters in our sample. Surface densities and associated Poissonian error bars were computed within 0.25 arcmin-wide annuli centered on the X-ray position of the clusters. We applied the same procedure to the control fields. Examples of profiles for a subsample of clusters and two control fields are shown in Fig. 1.
This preliminary analysis showed some trends with radius of the projected surface densities of mid-IR sources and suggested the presence of an excess of sources in intermediate-redshift clusters at cluster-centric radii of a few hundred kpc to 1Mpc with respect to the field. However, the weakness of the signal and the high uncertainties due to the background fluctuations prompted us to build stacked density profiles by averaging the signal that stems from different clusters.
4 Stacked surface density profiles of 24m sources

In order to investigate the dependence on redshift of the observed density of mid-IR sources in clusters, we divided our sample into 4 redshift bins, 0.05 z 0.3, 0.3 z 0.5, 0.5 z 0.8, and 0.8 z 1.1. For our stacking analysis we computed the surface density of 24m sources within 0.1 Mpc-wide concentric annuli centred on the X-ray cluster position by combining all clusters within a given redshift bin. Thus, we obtained a surface density radial profile of mid-IR sources for each redshift bin. In the attempt to statistically account for the contamination by fore/background sources we built similar radial profiles by using our sample of control fields. The shape of the radial profiles that included contaminant foreground/background sources resulted to be strongly dependent on the redshift range and distribution of the considered fields (Temporin et al. 2008). Therefore, for correctly estimating the background, we randomly assigned redshifts to our control fields by reproducing the same redshift distribution of our cluster sample. The comparison between the stacked radial profiles for the clusters and the control fields showed the presence of a significant excess of mid-IR sources at cluster-centric radii between 200 kpc and 1 Mpc for clusters in the intermediate redshift bins.
This result was confirmed by the application of an alternative method to take into account the contamination by fore/background sources. This second method was based on a pre-selection of potential cluster members according to photometric redshifts. We used photometric redshifts obtained for the CFHTLS D1 field with the code Le_Phare (Ilbert et al. 2006) and complemented with additional photometric redshifts derived with the same method for a portion of the W1 field. Sources were considered as candidate cluster members when their photometric redshift was compatible within errors with the available estimate of cluster redshift. We additionally considered a z = 0.01 to take into account the velocity dispersion of galaxies within a cluster (including the cluster periphery to which our analysis extends).
We found an unexpectedly high number ( 20 to 100) of 24m sources having photometric redshifts compatible with cluster membership, especially for clusters in the intermediate/higher redshift bins, out to 10′ radii from the cluster centre. Out of these mid-IR sources, the number of luminous infrared galaxies (LIRGs) ranges between a few for clusters at z 0.3 and 60 – 100 for clusters at z 0.5. An example plot showing the distribution of mid-IR sources across an intermediate-redshift cluster is shown in Fig. 2 (left hand). We note that the brightest sources tend to avoid the very centre of the cluster.
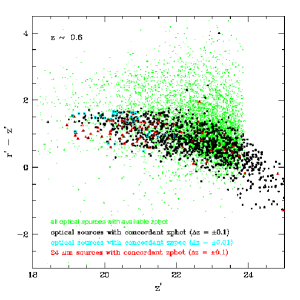
Also, in Fig. 2 (centre) we show an example of color-magnitude diagram for one of the clusters in our sample. The effectiveness of the photometric redshift pre-selection in reducing the fore/background contamination is evident. Interestingly, as expected for dusty star-forming galaxies, the mid-IR sources are mainly distributed within the “blue cloud” of galaxies and in the region of the diagram between the “blue cloud” and the red sequence, the so-called “green valley”, while only a small number of them is found in the red sequence.
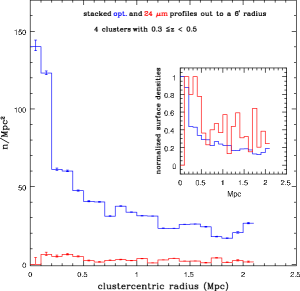
As expected, the stacked radial profiles of the control fields – after the photometric redshift pre-selection of sources – resulted in a flat distribution of the surface density of 24 m sources. Conversely, the stacked cluster radial profiles showed significant peaks in the distribution, again hinting at an excess of sources at radii 200 – 500 kpc and 1 Mpc for the intermediate redshift bins. Lower significance peaks of density are seen also at larger radii, toward the cluster periphery. A comparison with the radial distribution of (pre-selected in photometric redshift) optical sources allowed us to exclude that the observed 24m sources density peaks were just mirroring the general galaxy distribution in clusters. A comparison between the stacked radial distributions of optical and 24m sources is shown in Fig. 2 (right hand) for a subsample of 4 clusters in the redshift bin z = 0.3 – 0.5.
5 Conclusions
Our statistical analysis of the distribution of 24m sources in an unbiased sample of X-ray selected clusters drawn from the XMM-LSS survey has revealed the presence of a significant excess of mid-IR sources that are compatible with cluster membership at cluster-centric radii of 200 – 500 kpc and 1 Mpc in the intermediate redshift bins of our sample (z 0.3). At these redshifts, our analysis extends out to 3 to 4 Mpc radii from the cluster centre, as defined by the X-ray emission, and, with the adopted flux threshold F(24m) 150 Jy, the identified sources fall mostly in the LIRG regime. The brightest mid-IR sources tend to avoid the cluster centre. Our results are understood as a signature of the IR Butcher-Oemler effect in clusters. The detailed analysis of the whole sample is presented elsewhere (Temporin et al. 2008).
Acknowledgements
We are grateful to T. Evans and M. Polletta for providing us with the latest version of the band-merged SWIRE catalogue for the XMM-LSS field. This work is based on observations made with the Spitzer Space Telescope, which is operated by the Jet Propulsion Laboratory, California Institute of Technology under NASA contract 1407.
References
- [1] Butcher, H., & Oemler, A. 1984, ApJ, 285, 426
- [2] Chary, R., & Elbaz, D. 2001, ApJ, 556, 562
- [3] Coia, D., McBreen, B., Biviano, A., et al. 2005, A&A, 431, 433
- [4] Duc, P.-A., Fadda, D., Poggianti, B. M., et al. 2004, in ”Outskirts of Galaxy Clusters: Intense Life in the Suburbs”, IAU Coll. 195, Ed. A. Diaferio, p. 347
- [5] Duc, P.-A., Poggianti, B. M., Fadda, D., et al. 2002, A&A, 382, 60
- [6] Elbaz, D., Daddi, E., Le Borgne, D., et al. 2007, A&A, 468, 33
- [7] Fadda, D., Elbaz, D., Duc, P.-A., et al. 2000, A&A, 361, 827
- [8] Geach, J. E., Smail, I., Ellis, R. S., et al. 2006 ApJ, 649, 661
- [9] Ilbert, O., Arnouts, S., McCracjen, H. J., et al. 2006 A&A, 457, 841
- [10] Le Fèvre, O., Vettolani, G., Garilli, B., et al. 2005, A&A, 439, 845
- [11] Lonsdale, C. J., Smith, H. E., Rowan-Robinson, M., et al. 2003, PASP, 115, 897
- [12] Marcillac, D., Rieke, G. H., Papovich, C., et al. 2008, ApJ, 675, 1156
- [13] Marcillac, D., Rigby, J. R., Rieke, G. H., & Kelly, D. M. 2007, ApJ, 654, 825
- [14] Pacaud, F., Pierre, M., Adami, C., et al. 2007, MNRAS, 382, 1289
- [15] Pierre, M., Chiappetti, L., Pacaud, F., et al. 2007, MNRAS, 382, 279
- [16] Pierre, M., Valtchanov, I., Altieri, B., et al. 2004, JCAP, 9, 11
- [17] Saintonge, A., Tran, K.-V. H., & Holden, B. P. 2008, ApJ 685, L113