Supergiant Fast X-ray Transients: interpretation of archival INTEGRAL data
Abstract:
INTEGRAL monitoring of the Galactic Plane in the last 5 years revealed a new subclass of High Mass X-ray Binaries (HMXBs), the Supergiant Fast X-ray Transients (SFXTs). They display flares lasting from minutes to hours, with peak luminosity of and a frequent long term flaring activity reaching an X-ray luminosity of , as recently detected by the Swift satellite. The quiescent level is around . We performed a systematic re-analysis of archival INTEGRAL data of four SFXTs: IGR J16479-4514, XTE J1739-302, IGR J17544-2619, IGR J18410-0535. This led to the discovery of previously unnoticed outbursts from IGR J16479-4514 and IGR J17544-2619. We discuss these results in the framework of the different structure of the supergiant wind proposed to explain the outburst from this new class of sources.
1 Introduction
The INTEGRAL monitoring of the Galactic Plane led to the discovery of many new High Mass X-ray Binaries (HMXBs), and in particular of a new class of X-ray transients with OB supergiants, the Supergiant Fast X-ray Transients (SFXTs) ([11]; [16]). SFXTs are characterized by fast X-ray flares with peak luminosity of , and a frequent long-term flaring activity with a level of X-ray luminosity of [19].
The main hypotheses proposed to explain the SFXTs behaviour are based on the structure of the supergiant wind (see Sidoli 2008 for a recent review [20]): flares could be due to accretion of clumps in a clumpy spherical wind (in’t Zand 2005 [6]) or to enhancement of accretion when the neutron star crosses an equatorial wind component (Sidoli et al. 2007 [18]).
Another model involves the presence of magnetars in SFXTs, and the short outbursts result from transition across the magnetic and centrifugal barriers (Bozzo et al. 2008 and references therein [4]).
Here we report the results of a systematic analysis of public archival INTEGRAL data of 4 SFXTs: IGR J16479-4514, XTE J1739-302, IGR J17544-2619, IGR J18410-0535 from 2003 to 2007. We compare the observational results on these 4 SFXTs with the predictions of the spherical clumpy stellar wind model that we have developed.
2 Observations, data analysis and results
Using OSA 7.0, we analysed ScWs (IBIS/ISGRI) ranging from 2003 to 2007, corresponding to a total exposure time of for the 4 SFXTs. We extracted the lightcurves in the energy range keV and we found 31 flares for IGR J16479-4514, 43 flares for XTE J1739-302, 16 flares for IGR J17544-2619 and 3 flares for IGR J18410-0535. Besides the outbursts already reported in the literature, we discovered new flares, listed in Table (1).
| IGR J16479-4514 | |||
|---|---|---|---|
| N. | Start Time | Peak flux ( keV) | det. |
| (UTC) | significance | ||
| 1 | 2003 Feb 02, 19:06 | ||
| 2 | 2004 Aug 09, 02:24 | ||
| 3 | 2004 Aug 20, 07:26 | ||
| 4 | 2004 Aug 20, 12:04 | ||
| 5 | 2004 Sep 10, 01:12 | ||
| IGR J17544-2619 | |||
| 1 | 2004 Feb 27, 14:16 | ||
| 2 | 2006 Sep 20, 10:00 | ||
For each outburst, we have extracted an IBIS/ISGRI spectrum in the energy range keV and we have performed a fit with different spectral models: power law, bremsstrahlung, Comptonization model (comptt in xspec). Since there was no evidence of a spectral difference between the flares, within the uncertainties, we extracted a total flare spectrum for each of the 4 SFXTs. We obtained the best fit with a bremsstrahlung model (Figure 1), with the parameters reported in Table (2).
| kT | |||
|---|---|---|---|
| (days) | (keV) | (13 d.o.f.) | |
| IGR J16479-4514 | 47 | ||
| XTE J1739-302 | 118 | ||
| IGR J17544-2619 | 118 | ||
| IGR J18410-0535 | 35 |
 |
 |
 |
 |
3 Clumpy stellar winds
We developed a spherical clumpy stellar wind model in order to compare predictions of this model with the behaviour of the SFXTs. We assumed that the OB type supergiant is surrounded by a clumpy and spherically symmetric wind, where the clump formation rate distribution is:
| (1) |
where is the mass of the clump, and is the rate of clumps with mass emitted by the star. We assumed spherical clumps, with radii , then we introduce a power law distribution of radii :
| (2) |
We assumed that the total mass loss rate of the supergiant is given by:
| (3) |
where is the component of mass loss rate due to the clumps and is the mass loss rate in the form of the tenuous inter-clump medium.
From equations (1) and (3) we obtain that the total mass loss rate of the supergiant, , is given by:
| (4) |
In equation (4) and are the limits of the clump mass range. Assuming that is known, from Equation (4) we can determine :
| (5) |
where is the fraction of wind mass contained in the clumps.
Clumps are driven radially outward by transfer of momentum from UV photons to the ions of the wind via absorption or scattering in spectral lines [2]. From spectroscopic observations of O stars, Lepine & Moffat (2008) [9] suggest that clumps have the same velocity law of a smooth stellar wind. We can then assume for the clump velocity profile :
| (6) |
where is the terminal wind speed, is the radius of the supergiant, is a dimensionless parameter which ensures that , and is a constant ([8]; [7]).
The clump size is determined by the balance pressure equation. Following Lucy & White (1980) [10] and Howk et al. (2000) [5], we find that the clump size increases at larger distances from the supergiant star (see our derivation in Romano et al. (2008a) [13]) with the equation:
| (7) |
where is the initial velocity of the clump at the surface of the supergiant. We found, for each mass of the clump, the upper-limit and the lower-limit for the clump radius by means of two conditions. For any given mass there is a minimum radius below which the clump is optically thick in the UV resonance lines. Then the gravity dominates over the radiative force due to the line scattering and the clump tends to fall back onto the supergiant. In order to be accreted by the compact object of the binary system, the clump must escape from the OB supergiant. Then, from the theory of radiatively driven stellar wind of Castor et al. (1975) [2], and the clump model of Howk et al. (2000) [5], we found for each mass of the clump the lower-limit for its radius. With regard to the second condition, the clump is defined as a density enhancement in the smooth stellar wind. Then, for each mass of the clump, there exists an upper-limit for the clump radius: clumps with larger radii would be less dense than the smooth stellar wind (inter-clump medium), in contrast with the clump definition. The functions of the upper-limit and lower-limit for the clump radius are represented in Figure (2).
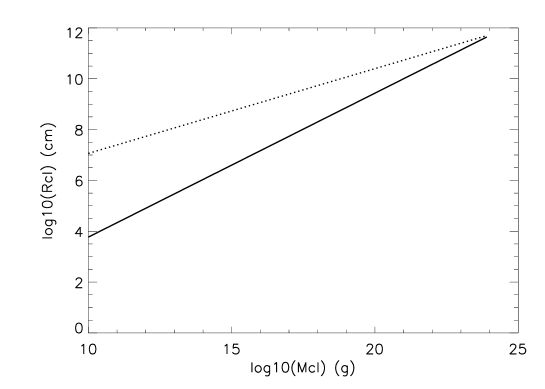
In conclusion, it is possible to derive the properties of the supergiant stellar wind assuming the clump mass distribution (1), the clump radii distribution (2), the expansion law of the clump (7) and the upper-limit and lower-limit laws for the clump radius (see Figure 2).
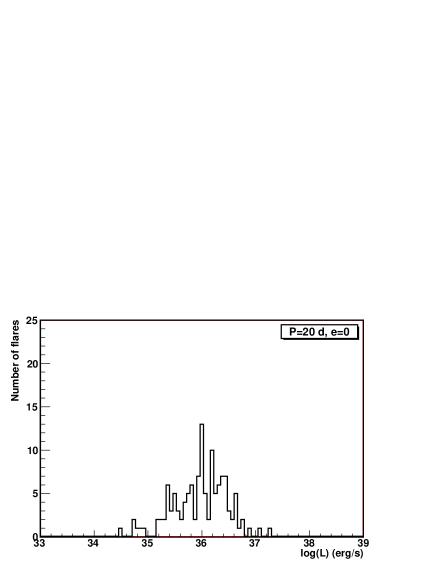
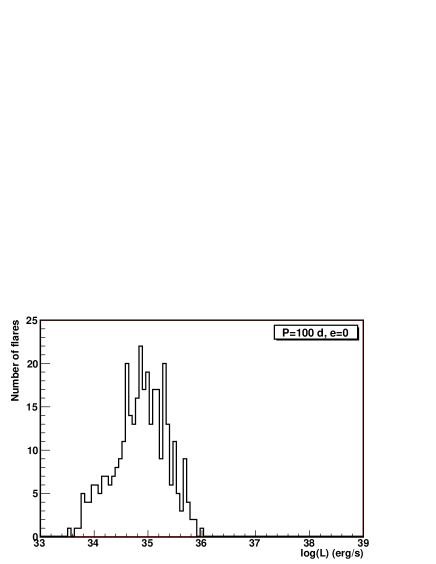
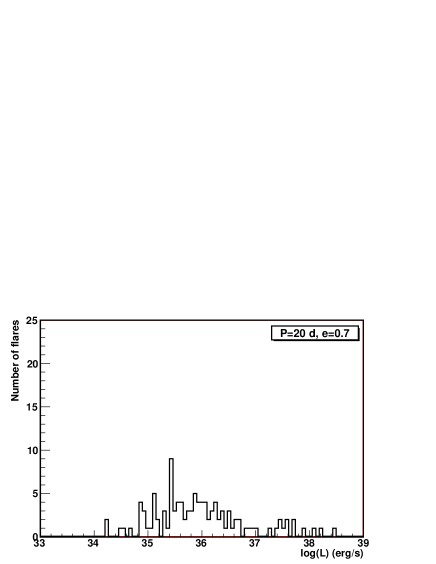
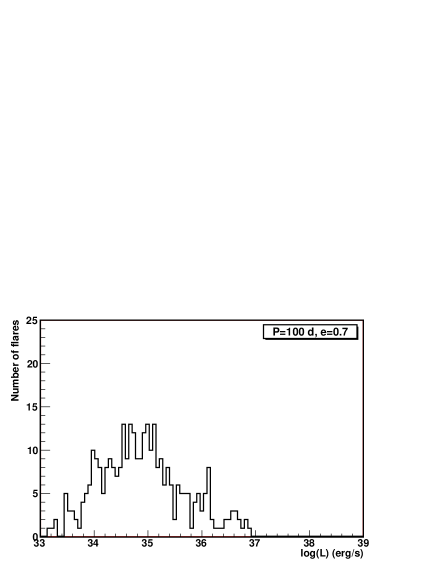
Assuming the following parameters for the supergiant wind , , , , , , , , , we calculated different histograms of the flare luminosities for different orbital periods and eccentricities of the binary systems (see Figure 3).
 |
 |
 |
 |
4 Comparison of observed flares with theory
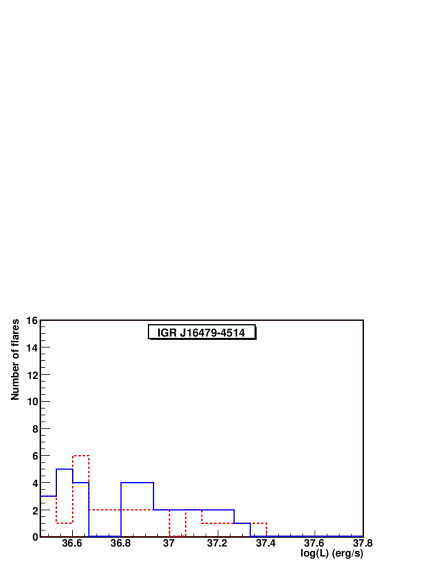
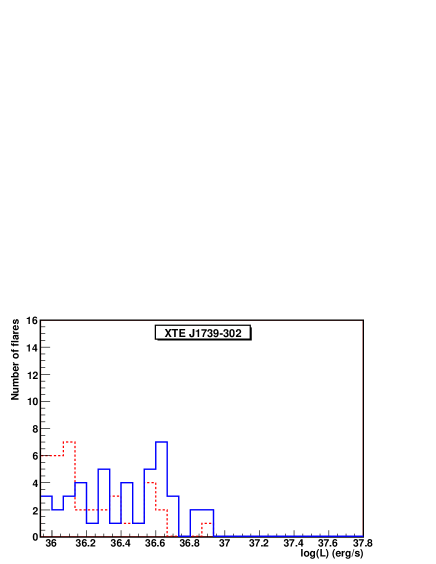
We have applied our spherical clumpy wind model to the INTEGRAL archival observations of IGR J16479-4514 and XTE J1739-302, for which we found a significant number of flares. Our preliminary results are shown in Figure (4). For these two sources we obtained the calculated histograms assuming the parameters for the supergiant winds reported in Section (3), in a time interval equal to the exposure time of IGR J16479-4514 and XTE J1739-302 (see Table 2). With the spectral parameters of Table (2) we obtained the flare luminosities in the energy range keV, for a distance for IGR J16479-4514, and a distance for XTE J1739-302 [12]. The comparison between observed distributions and the calculated histograms reported in Figure (4) is limited by the fact that INTEGRAL can detect only the “high luminosity tail” of the flare distribution (see Figures 3 and 4).
The flare luminosity distributions are well reproduced with and for IGR J16479-4514, and and for XTE J1739-302. With the Kolmogorov-Smirnov test we found a probability of that the observed and calculated histograms for IGR J16479-4514 have the same distribution. In the case of XTE J1739-302 this probability is . Moreover, the observed flare duration is well reproduced by the calculated flare duration (). The low probability obtained with the Kolmogorov-Smirnov test for XTE J1739-302 indicates that for this source we need an higher number of flares for the comparison between the calculated histogram and the flare luminosity distribution. We note that the estimated orbital period for XTE J1739-302 is different from that obtained by Blay et al. (2008) [3] (), and that an orbital period of with an eccentricity of could explain the absence of flares during the whole Key Programme 2 period, lasting 32 days, reported by Blay et al. (2008).
 |
 |
| , | , |
In this framework we can study the properties of the supergiant winds of the SFXTs by means of observable flare luminosities, flare frequency, flare durations, and quiescent level of the source.
These are preliminary results on the comparison between the spherical clumpy wind model and X-ray observations. Our future work will deal with anisotropic clumpy winds, where there is a denser clumpy wind component in the form of an equatorial wind disk around the supergiant star, and a polar spherically symmetric clumpy wind component, as proposed by Sidoli et al. (2007) [18]. We will also compare this model with the data obtained from the still on-going monitoring with Swift of these 4 SFXTs [19]; [14].
Acknowledgments.
LS, AP and SM acknowledge the Italian Space Agency financial and programmatic support via contract I/008/07/0.References
- [1] Abbott, D. C., 1982, The Astrophysical Journal 259, 282
- [2] Castor, J. I., Abbott, D. C., Klein, R. I., 1975, The Astrophysical Journal 195, 157
- [3] Blay, P., et al. 2008, arXiv:0806.4097v1
- [4] Bozzo, E., Falanga, M., Stella, L., 2008, arXiv:0805.1849v1
- [5] Howk J.C., Cassinelli J.P., et al., 2000, Astrophysical Journal 534, 348
- [6] in ’t Zand J.J.M., 2005, A&A 441, L1
- [7] Kudtritzki, R. P., Pauldrach, A., Puls, J., Abbott, D. C., 1989, A&A 219, 205
- [8] Lamers, H.J.G.L.M, Cassinelli J.P., 1999, Introduction to the Stellar Winds, Cambridge University Press
- [9] Lepine, S., Moffat, A. F. J., 2008, arXiv:0805.1864v1
- [10] Lucy, L. B., White, R. L., 1980, The Astrophysical Journal 241, 300
- [11] Negueruela, I., Smith, D.M., Reig, P., Chaty, S., Torrejón, J.M. 2006, Proceedings of the “The X-ray Universe 2005”, 26-30 September 2005, El Escorial, Madrid, Spain ESA SP-604, ed. A. Wilson, 165
- [12] Rahoui, F., Chaty, S., Lagage, P. O., Pantin, E., 2008, arXiv:0802.1770v1
- [13] Romano, P., Sidoli, L., Cusumano, G., Evans, P. A., Ducci, L., Krimm, H. A., Vercellone, S., Page, K. L., Beardmore, A. P., Burrows, D. N., Kennea, J. A., Gehrels, N., La Parola, V., Mangano, V., 2008a, arXiv:0810.1180
- [14] Romano, P., Sidoli, L., Mangano, V., Vercellone, S., Kennea, J. A., Cusumano, G., Krimm, H. A., Burrows, D. N., Gehrels, N., 2008b, The Astrophysical Journal 680, L137
- [15] Runacres, M. C., Owocki, S. P., 2005, A&A 429, 323
- [16] Sguera V., Barlow E.J., Bird A.J., et al., 2005, A&A 444, 221
- [17] Shimada, M. R., Ito, M., Hirata, R. Horaguchi, T., 1994, IAUS 162, 487
- [18] Sidoli, L., Romano, P., Mereghetti, s., Paizis, A., Vercellone S., Mangano, V., Vercellone, S., Götz, D., 2007, A&A 476, 1307
- [19] Sidoli, L., Romano, P., Mangano, V., Pellizzoni, A., Kennea, J. A., Cusumano, G., Vercellone, S., Paizis, A., Burrows, D. N., Gehrels, N., 2008, ApJ in press, arXiv:0805.1808v1
- [20] Sidoli, L., 2008, arXiv:0809.3157v1