Probing the Nature of the Vela X Cocoon
Abstract
Vela X is a pulsar wind nebula (PWN) associated with the active pulsar B0833-45 and contained within the Vela supernova remnant (SNR). A collimated X-ray filament (“cocoon”) extends south-southwest from the pulsar to the center of Vela X. VLA observations uncovered radio emission coincident with the eastern edge of the cocoon and H.E.S.S. has detected TeV -ray emission from this region as well. Using XMM-Newton archival data, covering the southern portion of this feature, we analyze the X-ray properties of the cocoon. The X-ray data are best fit by an absorbed nonequilibrium plasma model with a powerlaw component. Our analysis of the thermal emission shows enhanced abundances of O, Ne, and Mg within the cocoon, indicating the presence of ejecta-rich material from the propagation of the SNR reverse shock, consistent with Vela X being a disrupted PWN. We investigate the physical processes that excite the electrons in the PWN to emit in the radio, X-ray and -ray bands. The radio and non-thermal X-ray emission can be explained by synchrotron emission. We model the -ray emission by Inverse Compton scattering of electrons off of cosmic microwave background (CMB) photons. We use a 3-component broken power law to model the synchrotron emission, finding an intrinsic break in the electron spectrum at keV and a cooling break at 5.5 keV. This cooling break along with a magnetic field strength of 5 G indicate that the synchrotron break occurs at 1 keV.
1 Introduction
The Vela supernova remnant (SNR), at a distance of pc (Dodson et al., 2003) is the closest SNR to contain an active pulsar, (PSR) B0833-45. The Vela pulsar has a period (P) of 89 ms and a period derivative (Ṗ) of 1.25 x 10 -13s s-1, implying an age of 11,000 years and a spin-down luminosity (Ė) of 7 erg s-1. The remnant spans about 8∘ in diameter and contains regions of nonthermal emission in the radio, X-ray and -ray bands, including Vela X, a pulsar wind nebula (PWN) spanning a region of 2∘ 3∘ south-southwest of the pulsar. The center of Vela X is offset by about 40’ from the pulsar and emits in the radio, X-ray, and -ray bands (Frail et al. 1997; Aharonian et al. 2006).
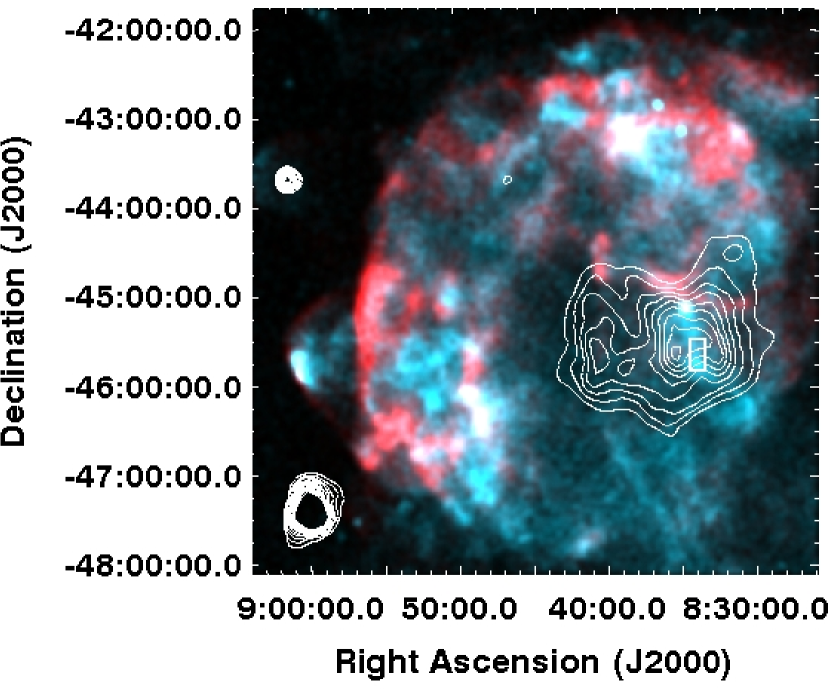
ROSAT observations of the Vela SNR (Figure 1) reveal a collimated X-ray filament seen predominantly at higher energies extending from the pulsar to the center of Vela X, about 45’ in length. Markwardt and Ögelman (hereafter MÖ) interpreted the ROSAT feature as an X-ray jet along which the pulsar loses energy (MÖ, 1995). The “jet head”, or interaction between the jet and SNR shell, was later observed with ASCA by MÖ, and they found the spectrum of this region to be best fit by a two component model, a lower temperature thermal plasma model and a higher energy component, that could be fit by either a higher temperature plasma model or power-law emission (MÖ, 1997).
An alternate explanation for the X-ray filament was proposed by Gvaramadze (1999) who suggested that this feature represents a projection effect of a Rayleigh-Taylor instability, which is caused by the impact of the SN ejecta with the wind-driven shell from the progenitor. Subsequent Chandra observations revealed an X-ray jet situated along the northwest-southeast pulsar spin axis, coinciding with the pulsar proper motion and not overlapping the MÖ “jet” (Pavlov et al., 2001).
Though this collimated X-ray feature (hereafter “cocoon”) is no longer considered a “jet,” it warrants further investigation. VLA observations reveal a bright radio filament coincident with the eastern edge of this filament (Frail et al., 1997). H.E.S.S. observed TeV -rays emanating from the ROSAT cocoon; Aharonian et al. 2006 use Inverse Compton scattering to fit this H.E.S.S. spectral energy distribution (SED). Horns et al. 2006 attribute the -ray emission from the cocoon to hadronic processes, which hinges on a thermal plasma density of 0.6 cm-3, consistent with the previous findings of MÖ 1995 .
Here we report on the analysis of XMM-Newton archival data from the interaction region of this filament with the SNR shell. In §2 we summarize the observations and data reduction techniques applied to the associated spectra. In §3 we describe our modeling of the X-ray spectrum, where we investigate the thermal and nonthermal emission observed from the cocoon. We investigate the broadband spectrum from this region in §4, using the results of our X-ray analysis along with spectral information from the radio and very high energy -ray bands. We consider these results in the context of a model in which the reverse shock from the Vela SNR has interacted with the PWN (Blondin, Chevalier, & Frierson 2001). We discuss our conclusions in §5.
2 Observations and Data Reduction
The “Vela jet head” was observed by XMM-Newton on May 2, 2005 for 22 ks with the MOS1 and MOS2 detectors and for 20 ks with the PN detector in Prime Full Window mode with the medium filter (PI Gallant, ObsID 0094630101). Data reduction was performed with the XMM Science Analysis System (SAS) to filter the data and remove flares. The good science time remaining after this processing is as follows: 22 ks for MOS1, 21.6 ks for MOS2, and 17.6 ks for PN.
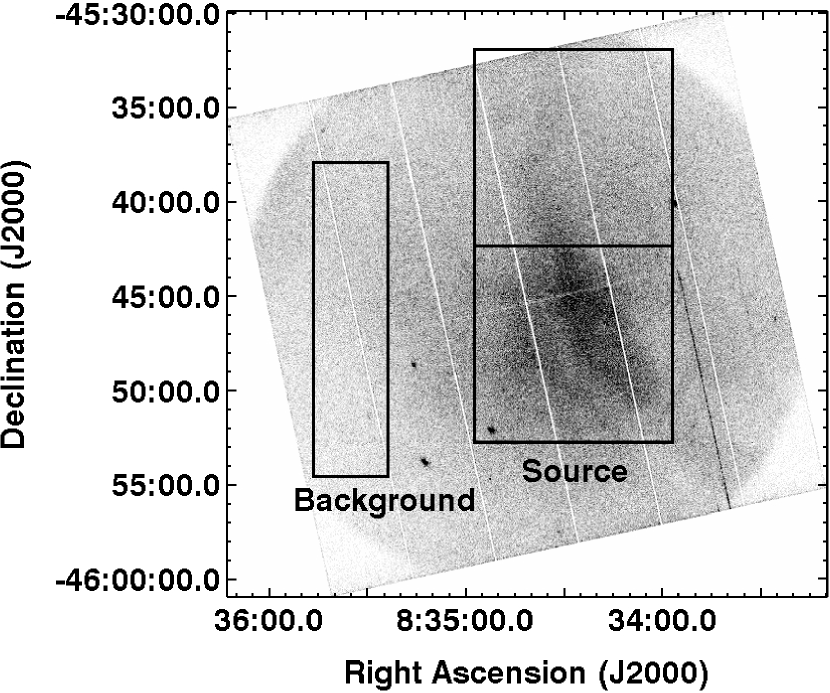
The XMM field of view covers just the southernmost portion of the cocoon detected by ROSAT. The field of view for the PN detector is shown in Figure 2, with the source and background regions we analyzed overlaid. Spectra were extracted from roughly the same source and background regions among all 3 detectors, using the xmmselect gui. The response files were generated with the rmfgen and arfgen SAS tools.
We extracted background spectra from a region within the the SNR and the 2∘ x 3∘ radio PWN, but outside the cocoon (Figure 2). For comparison, we extracted a second set of background spectra from a region along the northwestern shell of the SNR using archival data from observations performed on 9 November 2001 (PI Turner, ObsID 0112690101). The latter region is centered at RA = 08:48:33 and Dec = -42:23:45, with a radius of .
We applied the SAS tool evigweight to all spectra to correct for vignetting. To account for the unvignetted internal background, for both the source and background regions we subtracted similarly processed spectra taken from available blank sky fields 111Blank sky files were taking in Prime Full Frame mode using the medium filter (M1.M.FF.EVLIRP.FIT, M2.M.FF.EVLIRP.FIT, and PN.M.FF.EVLIRA.FIT)., each weighted by a factor determined by the ratio of high-energy counts between the Vela and blank-sky spectra (see Arnaud et al. 2002).
The source region was also separated into upper and lower sections, as seen in Figure 2. Spectra were extracted separately from these areas to search for possible spectral changes with increasing distance from the pulsar.
3 Spectral Analysis
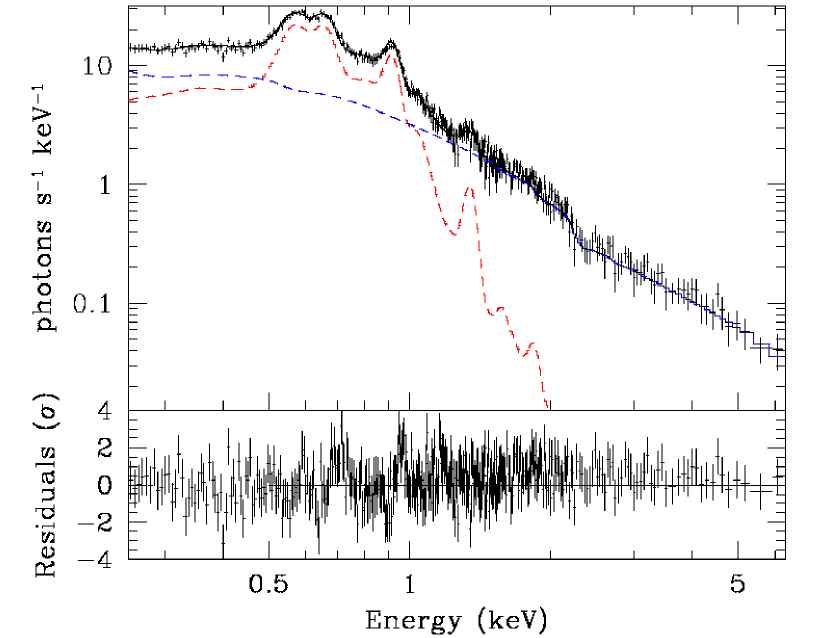
We modeled the spectra in XSPEC and found that a two-component model was required to fit the entire source region, consistent with the findings of MÖ in 1997. Using an adjacent background region, the data for the full region were best fit by an absorbed (NH 1.6 1020) nonequilibrium plasma model with a powerlaw component to accommodate the hard emission, as shown in Figure 3. A very high temperature thermal component proposed by MÖ (1997) can reproduce the observed hard emission in the XMM band, but given the observed emission from Vela X at energies in excess of 100 keV (Mangano et al., 2005), it appears clear that this component is nonthermal. The results of the plasma model with a powerlaw component are presented in the first column of Table 1. The modeling shows enhanced abundances of oxygen, neon, and magnesium, higher than abundances seen in the SNR as a whole, but consistent with abundances represented in ejecta fragments, most notably Vela Region D (Miceli et al., 2005). The temperature of 0.5 keV is also higher than that for most of the remnant, which ranges between 0.12 and 0.18 keV (Lu & Aschenbach, 2000), but is consistent with temperatures of shocked ejecta fragments (Aschenbach et al., 1995). The hard component is best fit by a photon index of of 2.30 0.04, consistent with synchrotron emission from energetic particles injected by the pulsar.
We compare these results using a background region from within the northwestern rim of the SNR shell (Miceli et al., 2005). By subtracting this background region, the source spectra retains contribution from the PWN, but contributions from the background and SNR are removed. The best-fit parameters from this fit are shown in the second column of Table 1. The abundances are still elevated after subtracting out SNR emission, suggesting that high abundances are intrinsic to this portion of the cocoon.
Spectra were also extracted separately from the upper and lower regions of the portion of the cocoon covered in this pointing, as shown in Figure 2, to investigate whether the steepness of the power law spectrum changes with distance from the pulsar. The northern portion covers the region about 22.6’ to 31.8’(2.0 pc) from the pulsar and the southern portion extends from about 31.8’ to 42.1’ (3.7 pc) from the pulsar. To facilitate fitting the spectra, was set to our best fit value of 1.6 and was set to 4.8. A variation in the spectral index was found, with and . Setting to the the value in the literature (2.26, MÖ 1997) shows a similar trend, with = 2.220.02 and = 1.990.01. The values above indicate that the power-law spectrum does change with distance from the pulsar, but in the opposite manner expected, flattening at larger radii rather than steepening. Further observations along the length of the cocoon are needed to fully test whether this trend exists along the full filament or if this is a local phenomenon related to turbulent disruption of the PWN where crushing of the cocoon against the PWN could cause adiabatic heating that hardens the spectrum.
4 Modeling
We have modeled the radio and X-ray emission as synchrotron radiation from energetic electrons within the cocoon, and the -ray emission as Inverse Compton emission from the scattering of the cosmic microwave background radiation off of the same electron population. The domain between the radio and X-ray energies is currently unexplored so we have interpolated between these two bandpasses. In order to reproduce the spectral index derived from the X-ray described above, the measured spectral indices in the radio band (with ranging from to 0.38, where ), and also the observed spectral shape of the TeV emission, we require an electron spectrum with multiple slopes. Treating the electron spectrum as a power law with a single break can adequately describe the X-ray and -ray spectra, but either under-predicts the radio emission by a significant factor, or requires a particle spectrum that leads to , much steeper than the measured values. To fit the entire spectrum, we thus consider a three-component power law:
A1, A2, and A3 are the normalization factors and , , and are the indices of the electron distribution within each energy range. The photon spectra produced by the synchrotron and IC emission in format are:
where is the electron emission volume
assuming a cylindrical volume with a radius of and
length of ; here we have assumed a distance pc
(Mangano et al., 2005).
and are synchrotron and IC
emissivities
(Lazendic et al., 2004).
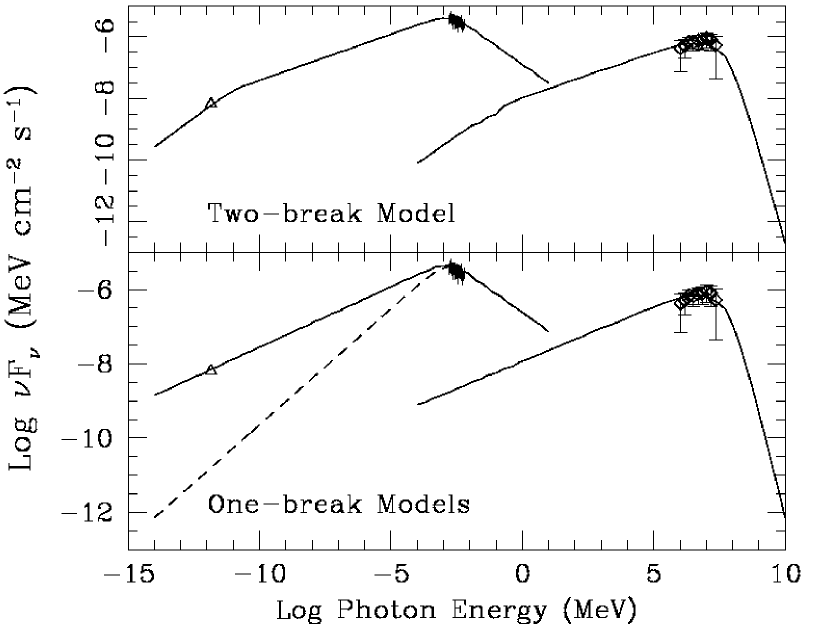
The VLA, H.E.S.S., and non-thermal components of the XMM spectra were plotted along with the flux model cited above. The VLA (Frail et al., 1997) and H.E.S.S. data points were scaled to coincide with the XMM region size. The magnetic field strength, normalization, spectral index values, and break energy values were varied until we obtained a model that adequately described the data points, as shown in Figure 4; A2 and A3 were calculated by fixing A1 and requiring the flux to match at the endpoints of the broken power-law segments. The best-fit parameters from this fit are shown in Table 2.
A power law spectrum with multiple breaks has been used to describe the emission from a number of PWNe, most notably the Crab Nebula. The first break in the spectrum of the Vela X cocoon, at keV, most likely corresponds to an intrinsic break. Several factors can contribute to this break; for the Crab nebula in particular, it has been posited that this break results from two distinct electron populations or from an elevated value of the magnetization parameter (Volpi et al., 2008). It has been suggested by de Jager (2007) that the radio-emitting and X-ray-emitting electrons from the entire PWN form distinct populations. We note that our constraints on both the maximum energy and the overall normalization of this low-energy component are somewhat weak, and do not rule out this possibility for the southern cocoon region.
The second break in the spectrum at keV is most likely a cooling break related to the synchrotron lifetime of the electrons injected from the pulsar. For our analysis of this segment of the Vela PWN, the magnetic field (5 G) and cutoff energy (5.5 keV) corresponds to a critical frequency of 2.4 Hz, or 1 keV, indicating that the synchrotron break occurs in the X-ray band. This magnetic field strength and synchrotron break are consistent with the values derived by de Jager, Slane & LaMassa (2008) which used INTEGRAL, BeppoSAX, and H.E.S.S. observations of the full Vela X region to constrain a model of a postshock injection spectrum. In this case, the electron spectra are produced by solving the time dependent transport equation with synchrotron losses. Integration of the non-thermal electron spectrum from this region of the cocoon gives an energy of erg, which is about 0.3% of the energy input from the pulsar ( Ė erg, where is the characteristic age of the pulsar).
5 Discussion and Conclusions
If the ambient medium into which a SNR expands is inhomogeneous, simulations show that the SNR will expand asymmetrically, resulting in a reverse shock that subsequently crushes the PWN asymmetrically (Blondin Chevalier & Frierson, 2001). The Vela radio nebula extends southward of the pulsar, possibly suggesting that the northern portion has been disturbed by such an interaction with the SNR reverse shock. In such a scenario, simulations show that ejecta-rich material can be turbulently mixed into the PWN from the reverse shock interaction (Blondin Chevalier & Frierson, 2001). This is consistent with our observation of enhanced abundances of O, Ne, and Mg in the cocoon, similar to the observed abundances of ejecta fragments in Vela (e.g. Vela Region D, Miceli et al. 2005), providing support for the disrupted PWN interpretation.
Our modeling of the non-thermal emission from this segment of the cocoon indicates that a leptonic model adequately describes the data, with the radio and X-ray emission resulting from synchrotron radiation and the -ray emission arising from inverse-Compton scattering. We need a 3-component broken power law model to adequately fit the data, unless we ignore the radio flux and spectral index values for Vela X. The high energy break, at 5.5 keV, and derived magnetic field of 5 G, correspond to a break in the synchrotron spectrum at 1 keV and are consistent with the findings of de Jager, Slane & LaMassa (2008) which obtained obtain the same field strength and synchrotron break using a different approach. The single break model to the X-ray and -ray data, which could be applicable if a separate electron population produces the radio emission, results in a comparable magnetic field strength (4.6 G) and cooling break energy (5.5 keV).
Horns et al. (2006) propose a hadronic model for the -ray emission from the Vela X cocoon, wherein the emission is the result of the decay of neutral pions produced in proton-proton collisions in the cocoon. This model requires a number density of for the target material. However, the density of thermal emission from our observations is only 0.09 cm-3, which is too low to accommodate the hadronic scenario. Moreover, we have considered an electron/ion number density ratio consistent with cosmic abundances; the presence of ejecta will increase this ratio, further reducing the derived gas density. Our observation only covers the southernmost portion of the cocoon, so perhaps a higher density is present along the northern parts. More X-ray observations of Vela X are needed to determine whether or not the -ray emission from hadronic processes are feasible for other regions of the PWN.
References
- Aharonian et al. (2006) Aharonian, F., et al. 2006, A&A, 448L, 43A
- Arnaud et al. (2001) Arnaud, M. et al. 2001, A&A, 365L, 80
- Aschenbach et al. (1995) Aschenbach, B., Egger, R., & Trumper J. 1995, Nature, 373, 587
- Blondin Chevalier & Frierson (2001) Blondin, J. M., Chevlier, R. A., & Frierson, D. M. 2001, ApJ, 563, 806
- de Jager (2007) de Jager, O. C. 2007, ApJ, 658, 1177
- de Jager, Slane & LaMassa (2008) de Jager, O. C., Slane, P. O., & LaMassa, S. 2008, in press
- Dodson et al. (2003) Dodson, R. et al. 2003, ApJ, 596, 1137
- Frail et al. (1997) Frail, D. A. et al. 1997, ApJ, 475, 224
- Gvaramadze (1999) Gvaramadze, Vasilii 1999, A&A, 352, 712
- Horns et al. (2006) Horns, D. et al. 2006, A&A, 451, L51
- Lazendic et al. (2004) Lazendic, J. S et al. 2004, ApJ, 602, 271
- Lu & Aschenbach (2000) Lu, F. J., & Aschenbach, B. 2000, A&A, 362, 1083
- Mangano et al. (2005) Mangano, V. et al. 2005, A&A, 436, 917
- MÖ (1995) Markwardt, C. B. & Ögelman, H. B. 1995, Nature, 375, 40M
- MÖ (1997) Markwardt, C. B. & Ögelman, H. B. 1997, ApJ, 480, L13
- Miceli et al. (2005) Micel, M., Bocchino, F., Maggio, A., & Reale, F. 2005 A&A, 442, 513
- Pavlov et al. (2001) Pavlov, G. G. et al. 2001, ApJ, 554, L189
- Volpi et al. (2008) Volpi, D., Del Zanna, L., Amato, E., & Bucciantini, N. arXiv:0804.1323v1
| Parameter | Value using Background 1 | Value using Background 2 |
|---|---|---|
| () | 1.6 | 1.6 |
| kT (keV) | 0.48 | 0.50 |
| [O]1 | 1.7 | 1.6 |
| [Ne]1 | 5.4 | 4.7 |
| [Mg]1 | 3.3 | 2.9 |
| [Fe]1 | 1.4 | |
| (1010s/cm3) | 4.8 | 4.0 |
| 2.3 | 2.2 | |
| Flux (total)2 | 2.5 | 4.0 |
| Flux (unabsorbed)2 | 2.7 | 4.2 |
| Flux (power law)2 | 1.5 | 2.5 |
| 1 Abundances relative to solar. | ||
| 2 Flux in units of 10-11 erg cm-2s-1 and averaged among the 3 detectors. | ||
| Background 1 is within the PWN. | ||
| Background 2 is outside the PWN. | ||
| Parameter | Value |
|---|---|
| A1 (particles/erg/cm3 (s/g/cm)-σ) | 2 |
| E1 (keV) | 5 |
| E2 (keV) | 5.5 |
| B (G) | 5 |
| 1.75 | |
| 2.4 | |
| 4.2 |