Super-Orbital Variability in Hard X-rays
Abstract
We present the results of a study with the Swift Burst Alert Telescope in the 14 – 195 keV range of the long-term variability of 5 low mass X-ray binaries with reported or suspected super-orbital periods — 4U 1636-536, 4U 1820-303, 4U 1916-053, Cyg X-2 and Sco X-1. No significant persistent periodic modulation was detected around the previously reported periods in the 4U 1916-053, Cyg X-2 or Sco X-1 light curves. The 170 d period of 4U 1820-303 was detected up to 24 keV, consistent with variable accretion due to the previously proposed triple system model. The 46 d period in 4U 1636-536 was detected up to 100 keV, with the modulation in the low and high energy bands found to be phase shifted by 180∘ with respect to each other. This phase shift, when taken together with the near-coincident onset of the 46 d modulation and the low/hard X-ray state, leads us to speculate that the modulation could herald transient jet formation.
keywords:
accretion, accretion discs - stars: neutron - X-rays: binary1 Introduction
Long-term “super-orbital” periodic variability has been observed in soft X-rays from over 30 X-ray binaries with the All Sky Monitor (ASM) on the Rossi X-ray Timing Explorer (RXTE) satellite (see for example Sood et al., 2007). Also known as ‘long’ or ‘third’ periods, these modulations are defined simply as any periodic variability greater than the orbital period. This very general definition of super-orbital variability is consistent with a number of physical mechanisms for the variation. Unlike binary orbital or neutron star spin periods, the mechanisms behind super-orbital variability are not well understood. The precession of a warped accretion disc modulating the X-ray flux from the compact object is currently the favoured model (see for example Wijers & Pringle, 1999; Clarkson et al., 2003a). This warp can be caused by the gravitational field of the donor star (see for example Larwood et al., 1996), or by radiation pressure exerted by the central X-ray emitting regions (see for example Wijers & Pringle, 1999). Ogilvie & Dubus (2001) showed that while radiation driven warping gives a coherent picture of super-orbital periods, not all systems agree with its predictions (e.g. 2S 0114+650; Farrell et al., 2008).
Other models proposed to explain super-orbital variability include variations in the accretion rate (caused by stellar pulsations of the donor star, irregular Roche lobe overflow or asymmetric stellar wind capture; Weiler et al., 1992; Psaltis, 2006), precession of the neutron star spin-axis in an X-ray pulsar (Trümper et al., 1986; Stairs, Lyne & Shemar, 2000), variations in the location of an accreting hot-spot (Rutten, van Paradijs & Tinbergen, 1992) and the presence of a third body in the system (i.e. a triple system; Paul, Kitamoto & Makino, 2000; Chou & Grindlay, 2001).
While most super-orbital periods are at best quasi-periodic, four X-ray binaries have been shown to exhibit stable super-orbital modulation over long timescales – Her X-1, LMC X-4, SS 433 and 2S 0114+650 (Paul & Kitamoto, 2002; Sood et al., 2006). Other systems such as SMC X-1 have super-orbital periods which have been observed to vary smoothly within a well-defined range (Clarkson et al., 2003a), while other super-orbital periods appear to evolve stochastically. It is thus clear that there is more than one mechanism behind the super-orbital modulations.
A number of X-ray binaries were regularly monitored in hard X-rays by the Compton Gamma Ray Observatory (CGRO) Burst and Transient Source Experiment (BATSE) for the first 1,600 days of the RXTE mission (Harmon et al., 2004). Since the decommissioning of CGRO in June 2000, the lack of high energy response of the RXTE ASM has precluded long-term studies of super-orbital variability simultaneously at low and high energies. The launch of Swift in 2004 saw the arrival of a wide field monitoring instrument capable of complementing the RXTE ASM in hard X-rays – the Burst Alert Telescope (BAT; Barthelmy et al., 2005). In this paper we present the results of a search for the previously reported super-orbital modulation of 5 low mass X-ray binaries (LMXBs) in the BAT 14 – 195 keV light curves.
2 Sources
2.1 4U 1636-536
4U 1636-536 was discovered following a series of type I X-ray bursts observed with the SAS 3 satellite (Hoffman, Lewin & Doty, 1977) and later classified as an atoll source (Hasinger & van der Klis, 1989). The orbital period of 3.8 hr was derived from optical photometric measurements by Pedersen, van Paradijs & Lewin (1981). A distance of 4.3 0.6 kpc was derived by Jonker & Nelemans (2004) using type I photospheric radius expansion bursts. However, more recent analyses by Galloway et al. (2006) derived a distance of 6.0 0.5 kpc for a canonical neutron star (i.e. MNS = 1.4 M⊙, RNS = 10 km).
Casares et al. (2006) performed phase-resolved VLT spectroscopy of the irradiated donor in 4U 1636-536, using Doppler imaging of the NIII 4640 Bowen transition lines to determine a new set of spectroscopic ephemerides. A reanalysis of burst oscillations using these ephemerides allowed them to place the first dynamical constraints on the masses of the binary companions, constraining the mass function (f(M) = 0.76 0.47 M⊙), mass-ratio (q 0.21 – 0.34) and system inclination angle (i 36 – 60∘).
Shih et al. (2005) reported the onset of a large amplitude, statistically significant periodic modulation at 46 d in the RXTE ASM data, interpreting this periodicity as due to an accretion rate variability related to the X-ray irradiation of the disc. These same authors noted a gradual decline in the X-ray flux of this source coincident with the appearance of the 46 d variability, arguing that 4U 1636-53 was transiting from activity to quiescence due to a reduction in the mass accretion rate. Fiocchi et al. (2006), however, observed a hard tail dominating the spectrum above 30 keV using data from the INTEGRAL satellite, speculating that this high energy emission could be linked to the onset of relativistic outflows (i.e. jets).
The hard state of atoll sources has been previously considered to be associated with the presence of a steady jet and radio emission (see for example Fender, 2006; Migliari & Fender, 2006). When compared with black hole systems containing jets, Migliari & Fender (2006) found that the neutron star systems were less radio loud for a given X-ray luminosity, but that the jet power in both classes of object scales linearly with accretion rate. Neutron star LMXBs in the low/hard state are thus expected to contain weaker radio jets than their black hole counterparts.
A number of radio observations of 4U 1636-536 were performed before the onset of the 46 d modulation, the decreased X-ray flux, and the hardening of the X-ray spectrum, showing an absence of significant radio emission (see § 6.2.4). No radio observations targeting this source after the onset of the modulation or the transition to the low/hard state have been reported in the literature. As such, the presence of jets in this system is yet to be confirmed.
2.2 4U 1820-303
4U 1820-303 was discovered near the centre of the globular cluster NGC 6624 in 1974 by the Uhuru satellite (Giacconi et al., 1974). The subsequent discovery of intense bursts associated with thermonuclear flashes from this source confirmed it as a low mass X-ray binary containing a neutron star, making this the first identified source of type I X-ray bursts (Grindlay et al., 1976). A distance of 7.6 0.4 kpc has been estimated using the bursts as a standard candle (Kuulkers et al., 2003).
The system consists of a white dwarf and a neutron star orbiting their common centre of mass with an orbital period of 11.4 min (Rappaport et al., 1987; Stella, Priedhorsky & White, 1987). Hasinger & van der Klis (1989) later classified 4U 1820-303 as an atoll source, with Zhang et al. (1998) observing the presence of kHz quasi-periodic oscillations (QPOs). Bloser et al. (2000b) observed that the QPO frequency was strongly correlated with the position on the colour-colour diagram. This result (in combination with the observed saturation of the QPO frequency at high accretion rates) lead them to conclude that they were observing the last stable orbit in the accretion disc.
Priedhorsky & Terrell (1984b) noted a periodic 170 d variability in the X-ray flux, over which timescale the source moves from the soft/banana state to the hard/island state. This quasi-periodic 170 d variability was later proposed to be a result of variable mass accretion due to tidally induced modulation of the orbital eccentricity by a third massive body (Chou & Grindlay, 2001). Recently, Tarana et al. (2007) reported the detection of a hard X-ray tail above 50 keV from this source in the island state, concluding that this emission is likely due either to emission of non-thermal electrons or thermal emission from plasmas with a relatively high temperature.
Zdziarski, Wen & Gierliński (2007a) performed an analysis of the super-orbital modulation using RXTE ASM data. These authors undertook a study of hierarchical triple system models yielding the required quasi-periodic eccentricity oscillations, finding that the resulting theoretical light curves matched well with the observed ones. Zdziarski et al. (2007b) reported a dependence on the X-ray spectral state of both the depth and phasing of the orbital X-ray modulation. This led them to favour a model in which the observed X-ray modulation is caused by scattering in hot gas around an accretion-stream bulge at the disc edge; as the mass accretion rate changes with the 170 d cycle, so the size and location of this bulge varies. The average flux calculated over the course of the super-orbital variability was found to be compatible with the model of accretion due to the angular momentum loss via emission of gravitational radiation.
2.3 4U 1916-053
4U 1916-053 was discovered in 1974 by the Uhuru satellite (Giacconi et al., 1974) and is the most compact X-ray binary to exhibit periodic intensity dips. Type I X-ray bursts each lasting 10 s have been observed from this source with a recurrence timescale of several hours (Becker et al., 1977; Lewin et al., 1977). A distance of 8.8 1.3 kpc has been estimated by Jonker & Nelemans (2004) from photospheric radius expansion during the bursts. 4U 1916-053 is classified as an atoll source and displays a similar path in the X-ray color-color diagram to 4U 1820-303, although with significantly lower luminosity (Bloser et al., 2000a).
The X-ray dips have been ascribed to obscuration of the X-ray emitting region by a bulge in the outer accretion disk where the accretion stream meets the disc (White & Swank, 1982). The dip recurrence period of 3000 s is the shortest among the known dipping sources (Swank, Taam & White, 1984). The optical counterpart was discovered as a V = 21 mag optical star modulating at a period of 3027.5 s by Grindlay et al. (1988). This optical period is 1% longer than the X-ray dip period, raising the question as to which of the values indicated the orbital period.
A 3.9 d beat period between the optical and X-ray periods was reported by Grindlay (1992), manifesting as a modulation of the X-ray dip shape (Chou, Grindlay & Bloser, 2001). Timing analyses of RXTE PCA data and quasi-simultaneous optical data performed by Chou, Grindlay & Bloser (2001) lead them to conclude that the X-ray dip period was indeed the binary orbital period, with the slightly longer optical period produced through beating between the orbital period and the 3.9 d period, which they ascribed to the precession period of the accretion disc. They also set an upper limit of 2.06 10-11 s s-1 on the , arguing that the inferred stability and the partial clustering of X-ray bursts preceding the X-ray dips continues to suggest that the system may be a hierarchical triple.
A regular long-term periodicity of 199 d (and a possible period of 40.6 d) was reported in the X-ray flux using data from the Vela 5B satellite by (Priedhorsky & Terrell, 1984a), which the authors ascribed to disc precession. Later analysis of the same data by Smale & Lochner (1992) found that the 199 d modulation was not very strong, with a confidence level of just 80%. Homer et al. (2001) analysed 3.7 yr of RXTE ASM data, finding no significant peaks above the red or white noise levels at any period. Šimon (2005) investigated the long-term X-ray activity of 4U 1916-053 using 7 yr of RXTE ASM data, finding that a cycle of about 230 – 250 d occurred only in a limited time interval, materialising as variations of the recurrence time and amplitude of outbursts. Šimon (2005) also concluded that the movement of 4U 1916-053 along the atoll path in the X-ray color-color diagram during the outbursts implied that the observed long-term variability was caused by variable accretion onto the neutron star, and not by disk precession (which would imply occultation and/or absorption effects). A more recent analysis of 8.5 yr of RXTE ASM data by Wen et al. (2006) failed to detect any long-term periodic variability.
2.4 Cyg X-2
Cyg X-2 is one of the six Galactic LMXBs that are classified as Z-sources (Hasinger & van der Klis, 1989), and was first discovered by Byram, Chubb & Friedman (1966) with a sounding rocket experiment. Type I X-ray bursts were reported by Smale (1998), confirming a neutron star as the compact object. Distances of 7.2 1.1 kpc and 13 2 kpc have been estimated from optical observations (Orosz & Kuulkers, 1999) and from photospheric radius expansion in the bursts (Jonker & Nelemans, 2004) respectively. A binary orbital period of 9.8444 d was deduced from the optical behaviour of the donor star (Casares, Charles & Kuulkers, 1998). A high energy tail has been observed in the X-ray spectrum during a number of observations (Di Salvo, Robba & Stella, 2002; Piraino, Santangelo & Kaaret, 2002; Lavagetto et al., 2006), although hard X-ray emission does not appear to be a constant feature of this source (Lavagetto et al., 2006).
A 77 d periodicity in data from the Vela 5B satellite was reported by Smale & Lochner (1992). Wijnands, Kuulkers & Smale (1996) reported the detection of a 78 d period in RXTE ASM data from the first 160 d of the mission, and showed that their result was supported by archival data from the Ariel 5 and Vela 5B missions. However, analyses of archived data from the all sky monitors on the RXTE, Ginga, Ariel 5, and Vela 5B satellites and the scanning modulation collimator of HEAO 1 by Paul et al. (2000) found no evidence for a stable modulation in the X-ray emission. Strong peaks at 40.4 d and 68.8 d in the RXTE ASM data, and at 53.7 d and 61.3 d in the Ginga ASM data were observed by these authors, leading them to conclude that the super-orbital variability in this system (if real) is aperiodic. Dynamic analyses performed on 7 yr of RXTE ASM data by Clarkson et al. (2003b) revealed complex quasi-periodic behaviour, with a highly significant periodicity at 59 d in a 300 d section of the light curve, with significant recurring features at 40 d appearing sporadically.
2.5 Sco X-1
The Z-source Sco X-1 was the first X-ray binary discovered and is the brightest persistent extra-solar X-ray source (Giacconi et al., 1962). Although the system properties are consistent with it containing a neutron star with a weak magnetic field, no type I bursts have been observed so far (Mirabel & Rodrigues, 2003). Radio emission from the vicinity of Sco X-1 was first reported by Andrew & Purton (1968), with later high-resolution radio interferometry unveiling compact jets through the formation of twin radio lobes with variable morphology (Fomalont, Geldzahler & Bradshaw, 2001). A distance of 2.8 0.3 kpc was determined from trigonometric parallax (Bradshaw, Fomalont & Geldzahler, 1999). The orbital period of 18.9 hr was originally discovered in 85 yr of archived photometric optical data by Gottlieb, Wright & Liller (2001), and more recently observed in X-rays by Vanderlinde, Levine & Rappaport (2003).
A high energy tail above 30 keV in the X-ray spectrum was observed in CGRO OSSE data by Strickman & Barret (2000) and later verified in RXTE and INTEGRAL data by D’Amico et al. (2001) and Di Salvo et al. (2006) respectively. A periodic modulation at 37 d was reported by Peele & White (1996) in 9 months of RXTE ASM data, although this modulation has yet to be confirmed.
3 Data Reduction
While awaiting gamma-ray bursts the Swift BAT instrument accumulates data in survey mode. A given source is within the field of view of the BAT 10% of the time, with a typical integration time per pointing of around 1000 s. Standard software was used to extract and clean detector plane images in four energy bands for each observation (typically a few thousand seconds, often comprising several shorter segments) and to calculate the arrays of weights corresponding to the visibility of each source within the field of view by each detector pixel during that observation. A program developed for the purpose by the authors was then used to fit simultaneously the intensities of the sources and a series of background model components (equivalent functionality to that provided by this program is now available in the latest public software, though the public software was not available at the time the analyses were performed). Corrections were applied for earth occultation and the known energy-dependent variation of the instrument sensitivity with off-axis angle.
4 Data Analysis
| Source | RXTE ASM | BAT A | BAT B | BAT C | BAT D | |||||
|---|---|---|---|---|---|---|---|---|---|---|
| N111number of points in the light curve | fsamp222average light curve sampling frequency in units of d-1 | N | fsamp | N | fsamp | N | fsamp | N | fsamp | |
| 4U 1636-536 | 481 | 0.77 | 483 | 0.78 | 485 | 0.78 | 485 | 0.78 | 494 | 0.80 |
| 4U 1820-303 | 452 | 0.72 | 419 | 0.75 | 405 | 0.72 | 426 | 0.76 | 429 | 0.76 |
| 4U 1916-053 | 485 | 0.78 | 379 | 0.69 | 384 | 0.70 | 386 | 0.70 | 390 | 0.71 |
| Cyg X-2 | 570 | 0.91 | 504 | 0.81 | 493 | 0.79 | 507 | 0.81 | 507 | 0.81 |
| Sco X-1 | 485 | 0.77 | 483 | 0.77 | 470 | 0.75 | 466 | 0.74 | 465 | 0.74 |
The BAT 14 – 24 keV (A), 24 – 50 keV (B), 50 – 100 keV (C) and 100 – 195 keV (D) light curves were used for these analyses, rebinned at 1 d. The average sampling rate for the reduced light curves prior to rebinning varied from 0.8 – 12.5 d-1. For comparison, the RXTE ASM 1.5 – 12 keV 1 d average light curves for the same time span were analysed to cover the low energy range of the spectrum. The 1 d binning was chosen for convenience as we were interested only in the long-term variability of the target sources. Table 1 lists the number of data points and average sampling frequencies for the BAT and RXTE ASM light curves for each source.
All data points were weighted using the modified weighting scheme developed by Corbet, Markwardt & Tueller (2007). In this method, individual data points are given weights based on both the non-uniform measurement uncertainties and the intrinsic source variability. The resulting weighted count rate is given by:
| (1) |
where is the raw un-weighted rate, is a correction factor to account for underestimation of the error on each point, and is the uncertainty for the point. is the estimated variance due to source variability, given by:
| (2) |
where is the mean count rate and is the number of data points in the light curve.
The factor was derived for each of the energy bands in the BAT and RXTE ASM light curves by fitting a constant to the light curves of a source expected to be stable. The factor was determined by taking the square root of the reduced value obtained from fitting data from the Crab (R. H. D. Corbet 2007, private communication). For cases in which the parameter was negative (applicable to sources which are very faint in the given energy band), was set to zero and the method reverts to the “simple” weighting technique proposed by Scargle (1989).
Power spectra were generated for each of the weighted light curves using the fast periodogram fasper subroutine of the Lomb-Scargle periodogram (Lomb, 1975; Scargle, 1982; Press & Rybicki, 1989). The over sampling and hi-frequency factors – which set the period range and resolution (Press & Rybicki, 1989) – were both set at 2 for each analysis run, allowing us to search for periodic variability in the 1.3 – 1000 d range. The Lomb-Scargle technique allows us to sample below the average Nyquist period (with reduced sensitivity) due to the unevenly sampled nature of the data, without creating problems due to aliasing as would be seen in the analysis of an evenly sampled data set using standard fast Fourier techniques. The frequency range and binning were chosen to give good coverage of the range covered by known super-orbital periods while at the same time providing sufficient resolution in the power spectra. The 99 white noise significance levels were estimated using Monte Carlo simulations (see for example Kong, Charles & Kuulkers, 1998). The 99 red noise significance levels were estimated using the redfit subroutine333ftp://ftp.ncdc.noaa.gov/pub/data/paleo/softlib/redfit/redfit_preprint.pdf, which fits a first-order autoregressive process to the time series in order to estimate the red-noise spectrum (Schulz & Mudelsee, 2002).
5 Results
5.1 4U 1636-536
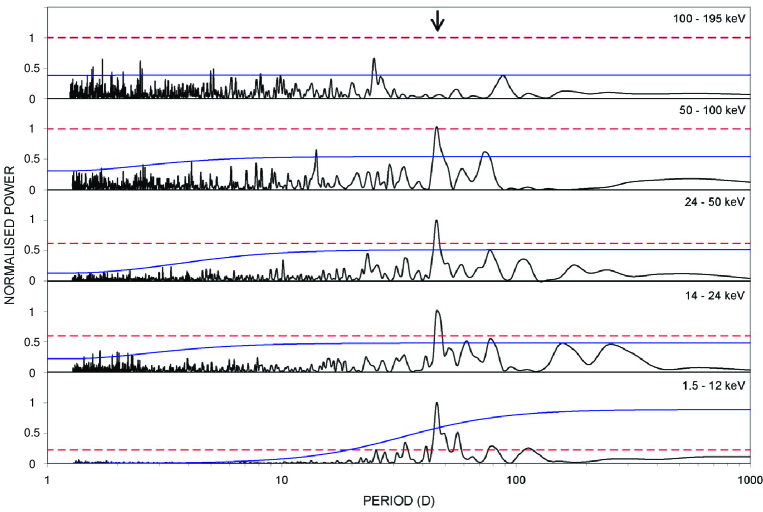
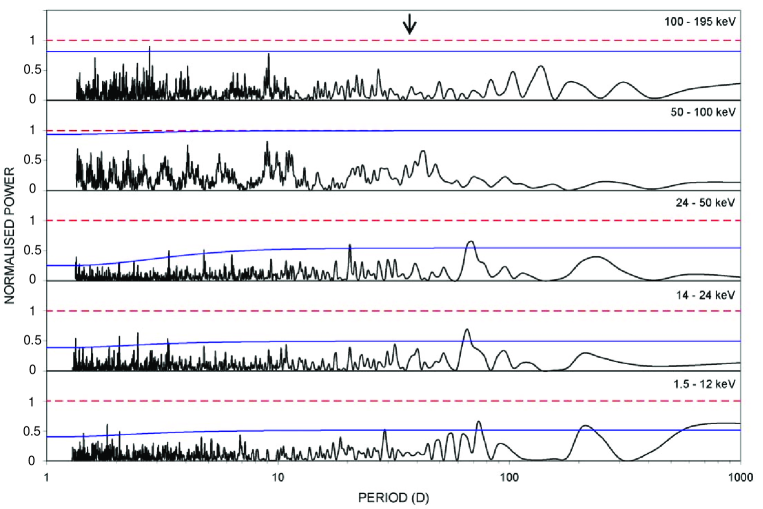
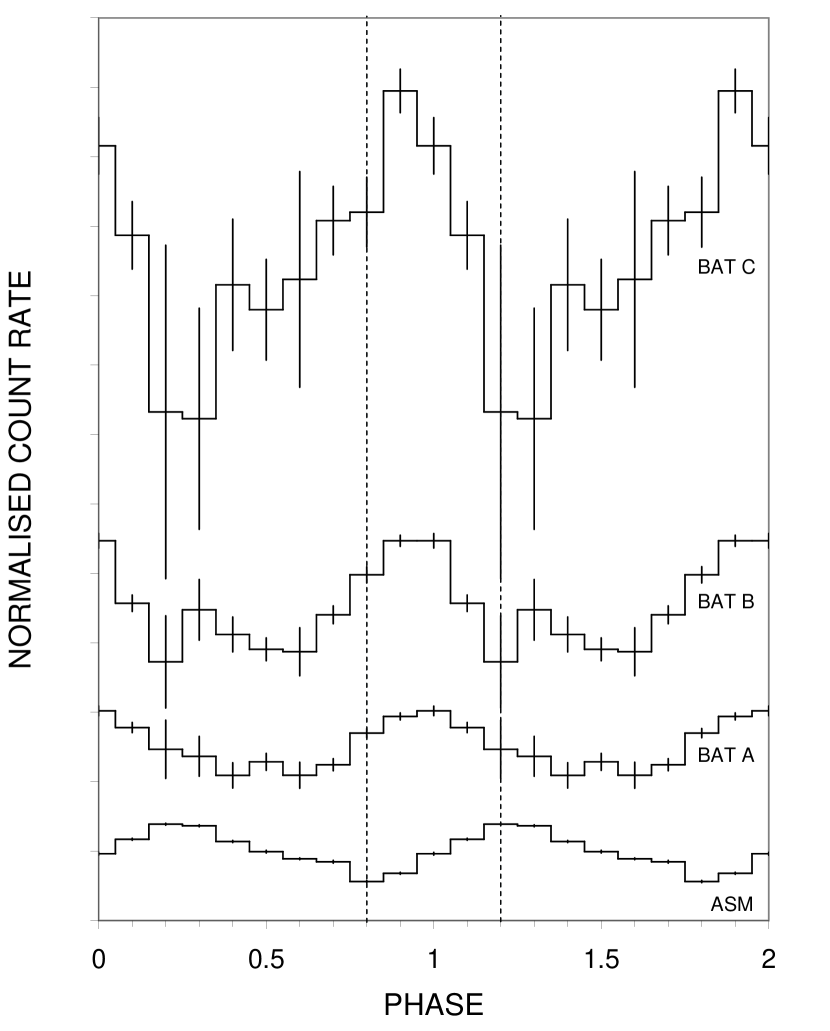
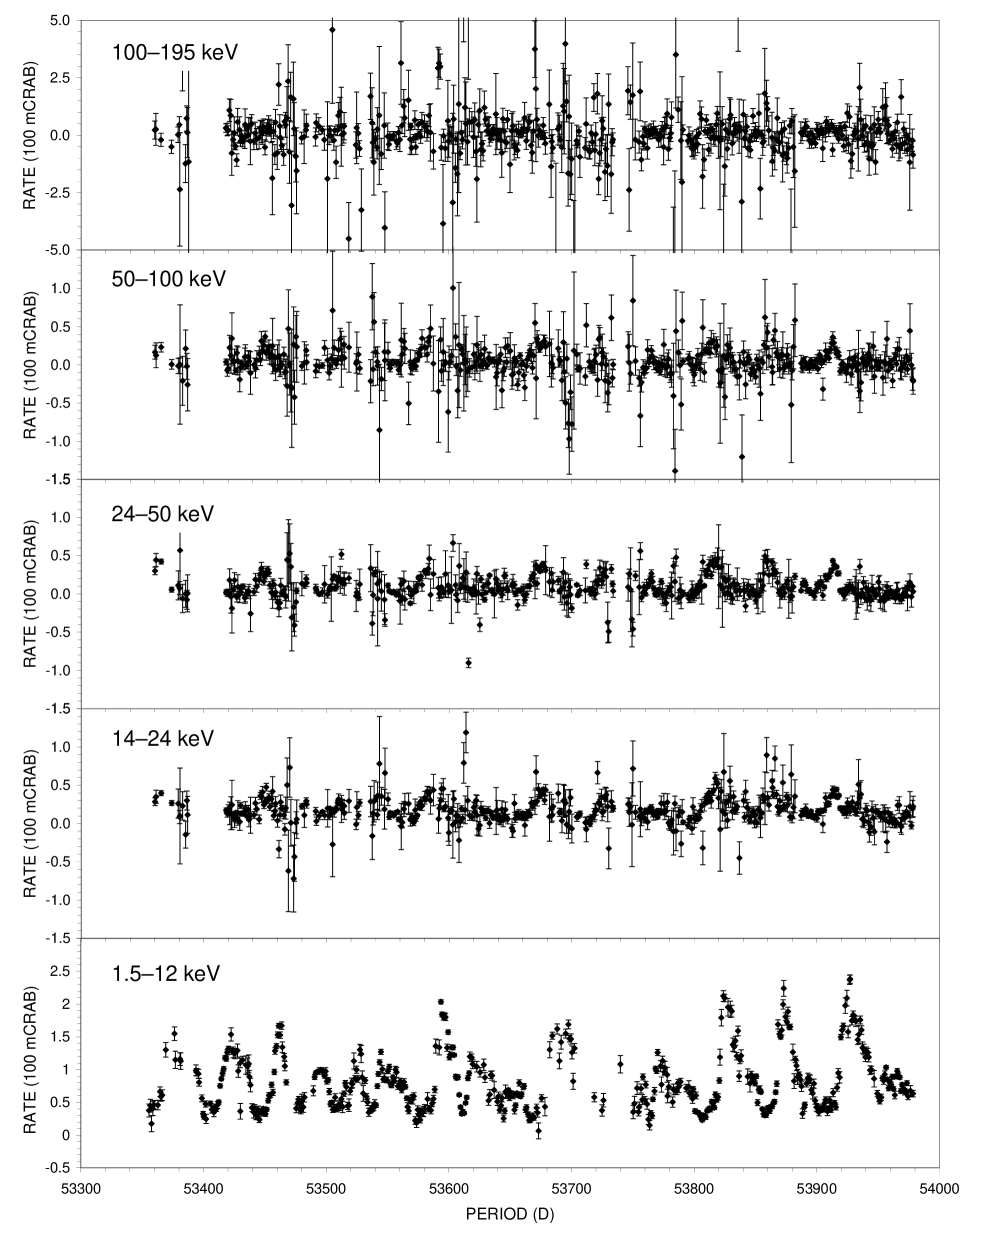
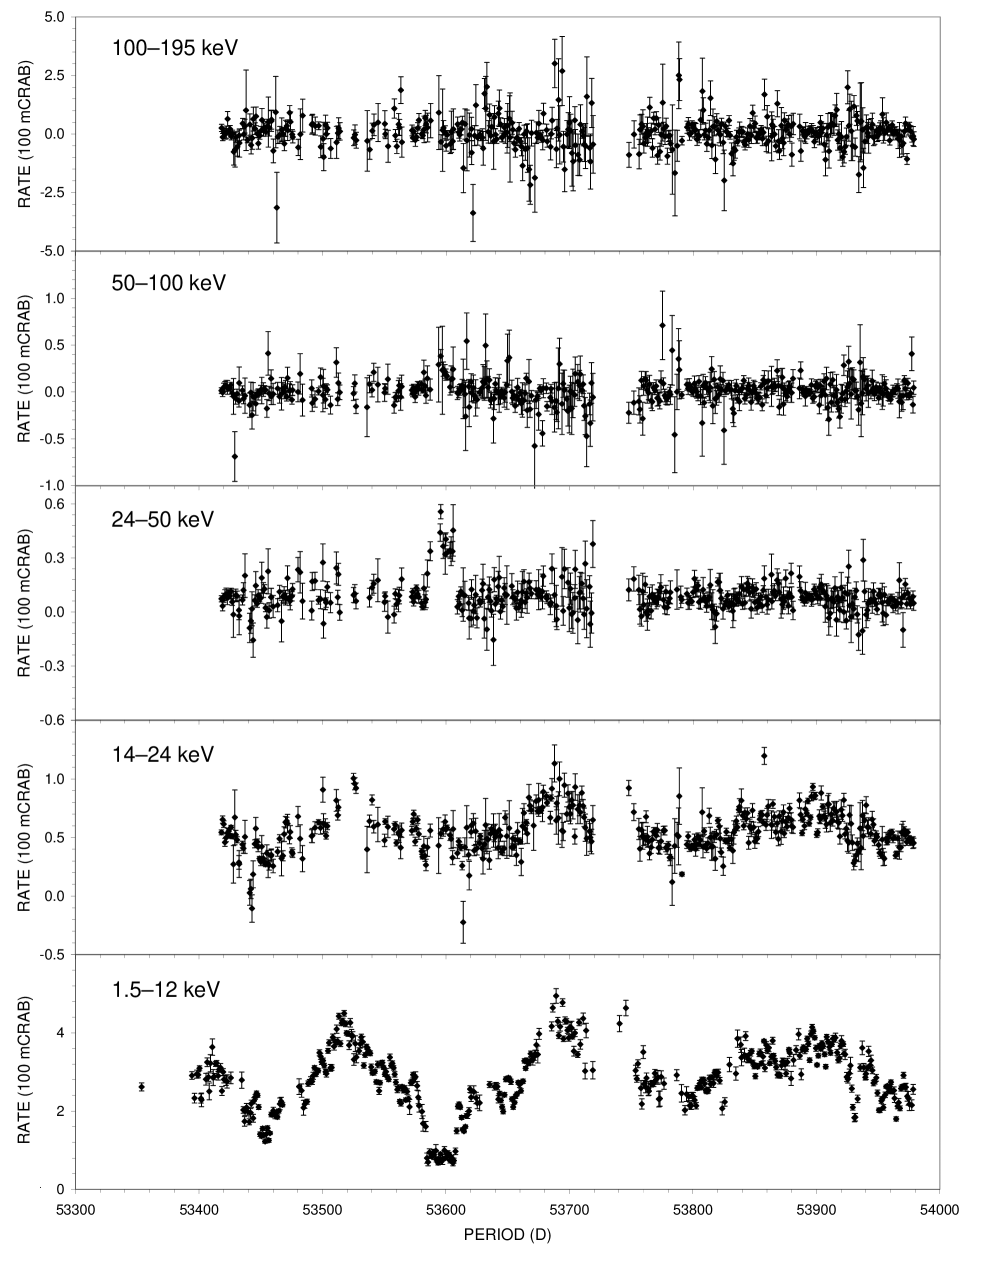
Figure 7 shows the RXTE ASM and Swift BAT light curves for 4U 1636-536 while Figure 12 shows the power spectra. The previously reported 46 d periodicity is clearly detected in the RXTE ASM 1.5 – 12 keV data, and is also significantly present in the BAT 14 – 24 keV, 24 – 50 keV and 50 – 100 keV light curves. No significant modulation above 100 keV is detected in the 1.3 – 1000 d range. In order to investigate the likely origin of the 46 d modulation, the raw (i.e. un-weighted) RXTE ASM, BAT A, BAT B and BAT C light curves were each folded over the 46 d period, setting phase zero arbitrarily to the start of the BAT light curves at MJD 53360. The profile of the modulation was observed to shift in phase between the 1.5 – 12 keV and 14 – 24 keV energy bands, so that the profiles above 14 keV are almost 180∘ out of phase with the lower energy modulation.
It can be clearly seen in Figure 7 that the period of the modulation is not stable, with the time between successive peaks varying over time. In order to test how the drift in the period affects the width of the peak in the power spectra, we simulated light curves with the same sampling as the RXTE ASM, BAT A, BAT B and BAT C light curves with a stable sinusoidal modulation with a period of 46 d. Power spectra were then generated and compared with those produced using the real data shown in Figure 12. In all cases the peaks in the real power spectra were marginally wider than the simulated spectra. While this discrepancy could possibly be linked to the change in the period, the difference could also be due to the effects of noise or statistical scatter.
Analysis of the BAT light curves prior to rebinning into 1 d average data sets found an additional peak at 77 above the 99 white noise significance levels. Farrell, O’Neill & Sood (2005) have shown that by imposing a known periodic sampling rate, any spurious peaks in the power spectrum produced by aliasing or spectral leakage should be shifted to other frequencies. By simulating light curves with periodic modulations at 46 and 77 d with the same sampling as the BAT data we found that rebinning the light curves should increase the significance of a real peak. The significance of the 77 d peak was dramatically reduced in power spectra of the rebinned BAT light curves (see Figure 12) and is well below the dominant 99 white noise significance levels. We thus identify the 77 d peak as spurious.
5.2 4U 1820-303
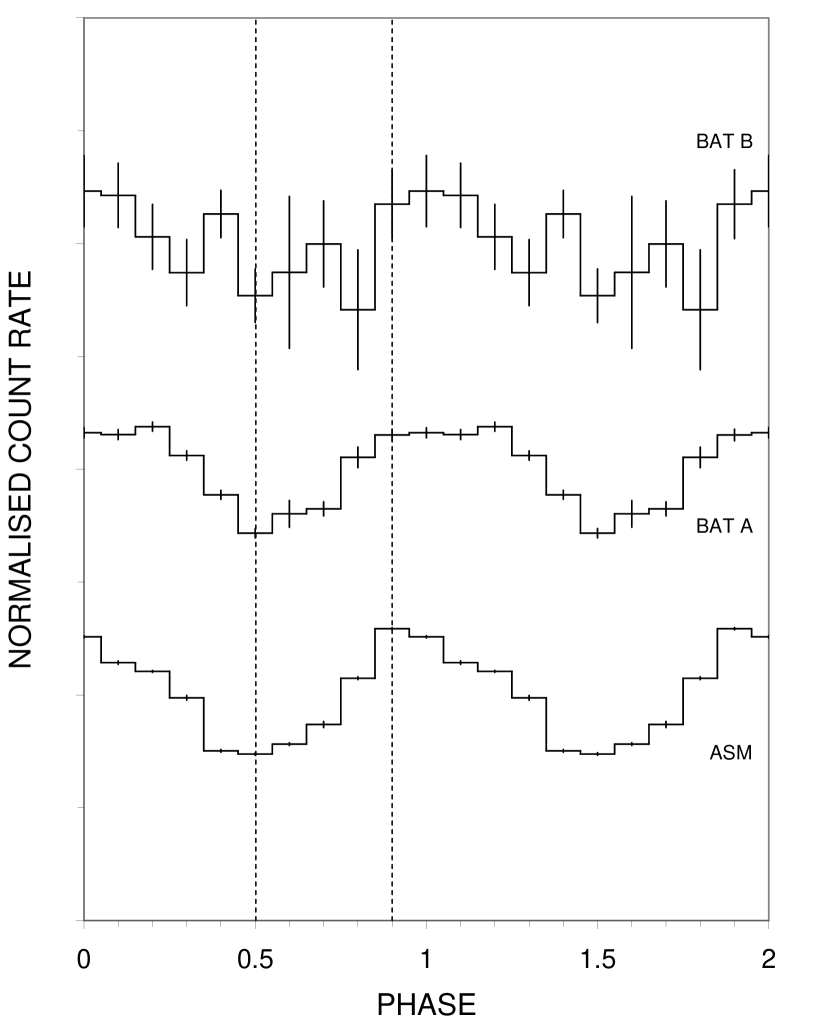
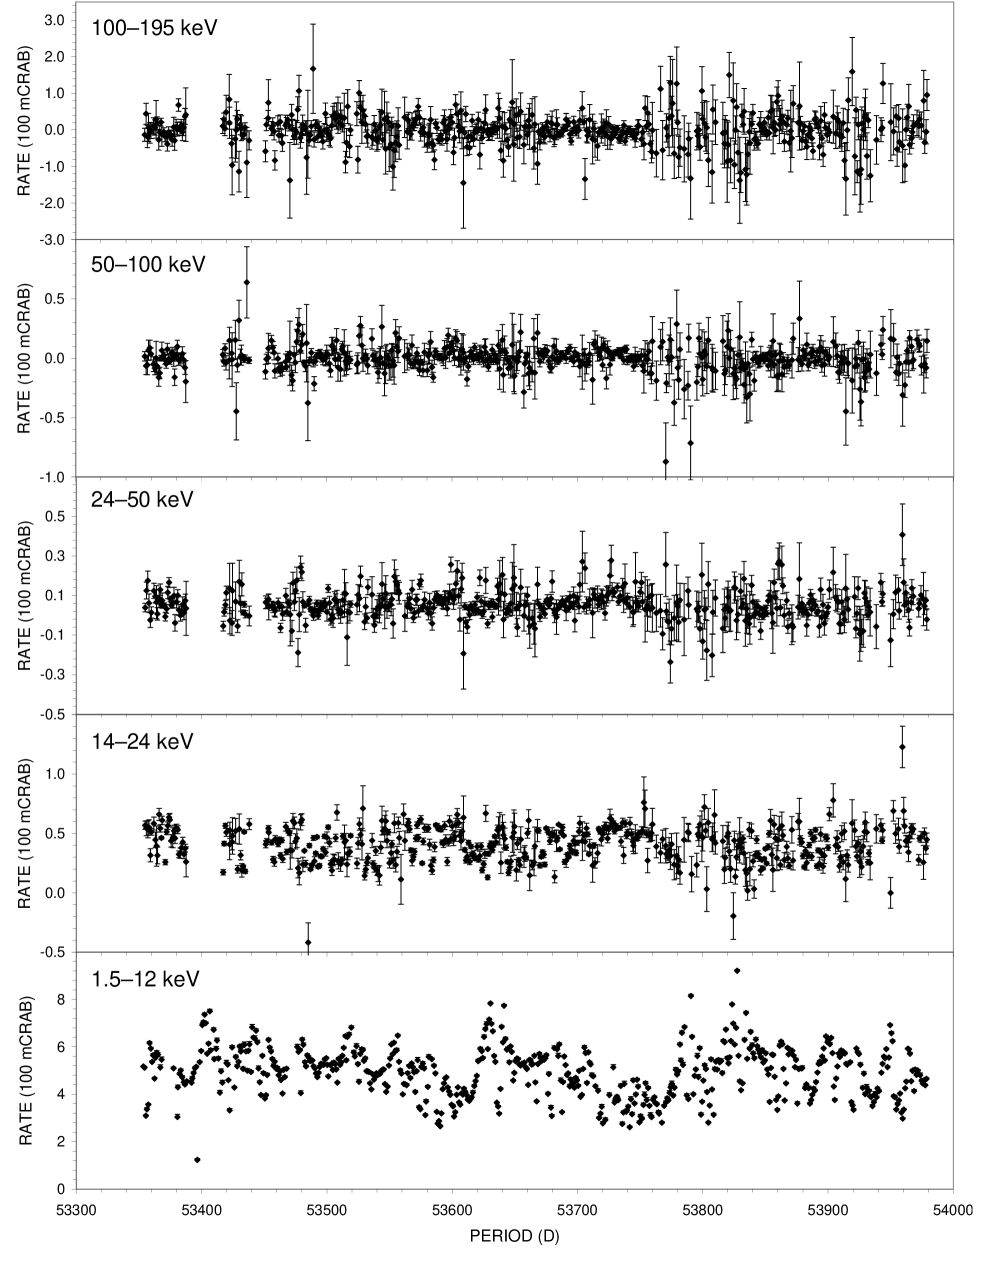
Figure 8 shows the RXTE ASM and Swift BAT light curves for 4U 1820-303 while Figure 13 shows the power spectra. The previously reported 170 d periodicity is clearly detected in the RXTE ASM 1.5 – 12 keV data as a single broad peak, and is also significantly present in the BAT 14 – 24 keV light curves. No peaks around 46 d are significantly present in the 24 – 195 keV power spectra. The 1.5 – 12 keV and 14 – 24 keV light curves were thus epoch folded over the 170 d period, setting phase zero arbitrarily to the start of the ASM light curve at MJD 53353. The count rates were normalised to the mean rate (Figure 2). Unlike 4U 1636-536, no phase shift was observed between the low and high energy profiles.
The period of the super-orbital modulation of 4U 1820-303 has been known to vary over time (Zdziarski et al., 2007a). As such, to test the effect of a varying period on the width of the peak in the power spectra, we simulated light curves with a stable sinusoidal modulation at 170 d with the same sampling as the RXTE ASM and BAT A light curves. We then generated power spectra for the simulated light curves and compared them with the power spectra shown in Figure 13. As with 4U 1636-536, the peaks in the real power spectra were marginally wider than those generated using the simulated data. While this discrepancy could again be linked to a changing period, there is no more than a suggestion of possible slight broadening of the peaks.
The simulations clearly show that the width of the peak is a function of both the period of the modulation and the number of cycles in the data set. Therefore, in order to compare the width of the super-orbital peak in the 4U 1820-303 power spectra with that of 4U 1636-536 this relationship needs to be taken into account. We thus took the full width of the peaks at 50 of the maximum power, normalised it by the period of the modulation and then multiplied by the number of cycles in the light curves. Comparing the normalised peak widths shown in Table 2, we see that the values for the real peaks are comparable for both 4U 1636-536 and 4U 1820-303, and are consistently marginally greater than the width of the simulated peaks.
| Data Set | 4U 1636-536 | 4U 1820-303 | ||
|---|---|---|---|---|
| Wreal | Wsim | Wreal | Wsim | |
| RXTE ASM | 0.94 | 0.82 | 1.11 | 0.90 |
| BAT A | 1.07 | 0.88 | 0.94 | 0.86 |
| BAT B | 0.97 | 0.88 | – | – |
| BAT C | 1.00 | 0.88 | – | – |
In addition to the 170 d modulation, a peak at around 100 d marginally exceeds the 99 white noise significance level in the 24 – 50 keV power spectrum. However, the lack of a significant peak at this period in the other BAT power spectra (in particular between 14 – 24 keV) leads us to conclude that this peak is spurious. No other significant modulation above 50 keV is detected in the 1.3 – 1000 d range.
5.3 4U 1916-053
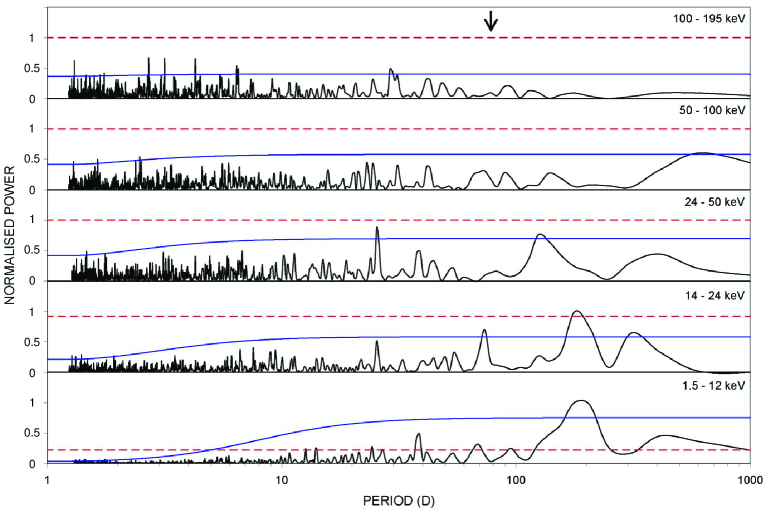
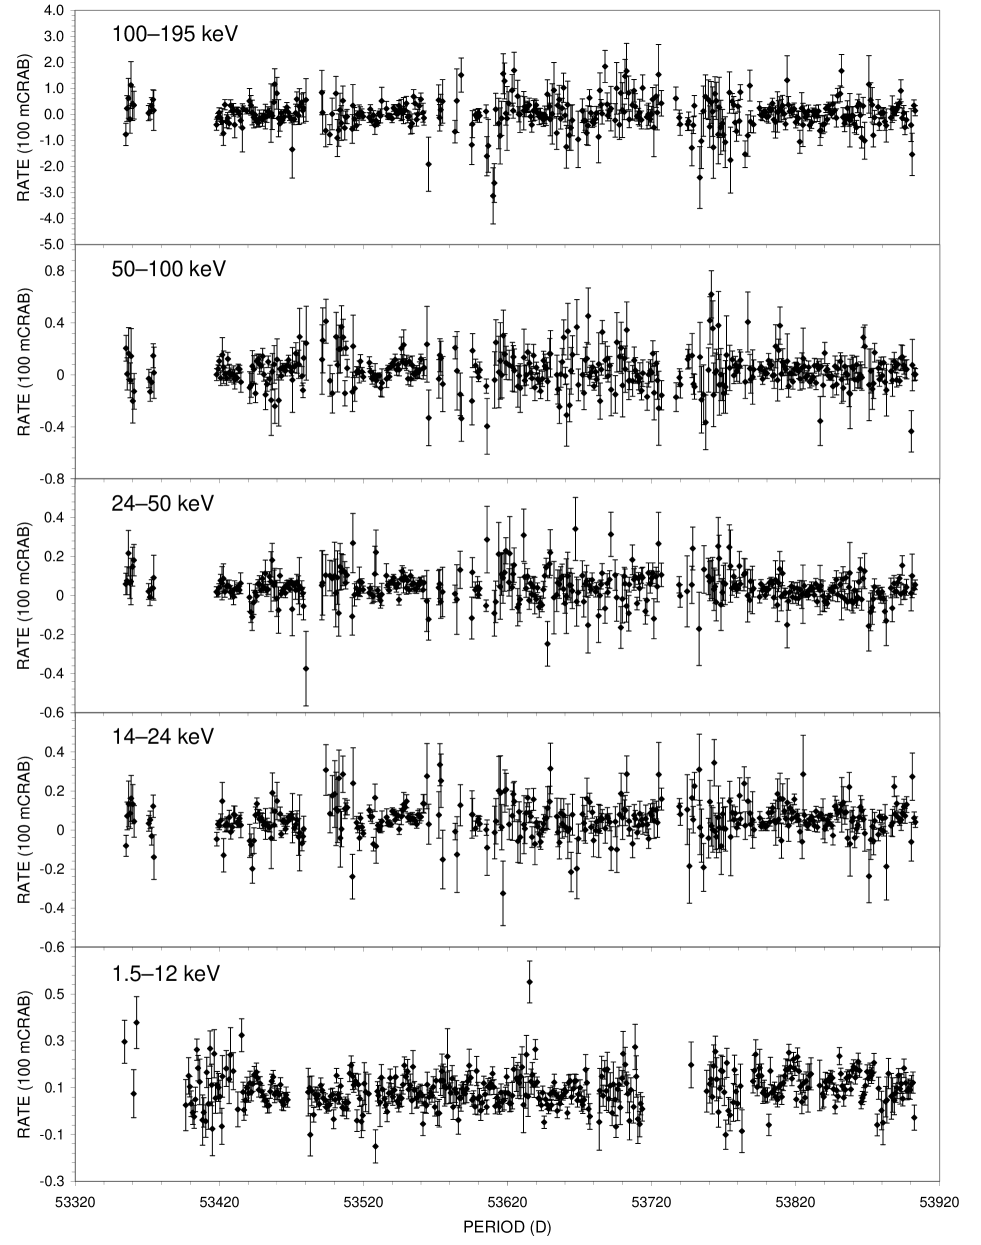
Figure 9 shows the RXTE ASM and Swift BAT light curves for 4U 1916-053 while Figure 14 shows the power spectra. No significant modulation in any of the light curves is apparent in the 1.3 – 1000 d range, indicating that either the 199 d and 40.6 d periodicities detected by Priedhorsky & Terrell (1984a) were spurious, the mechanism for these modulations was not active during the time of our observations, or that the signal was not sufficiently stable and/or persistent over the entire observing window for it to be detected in a single power spectrum.
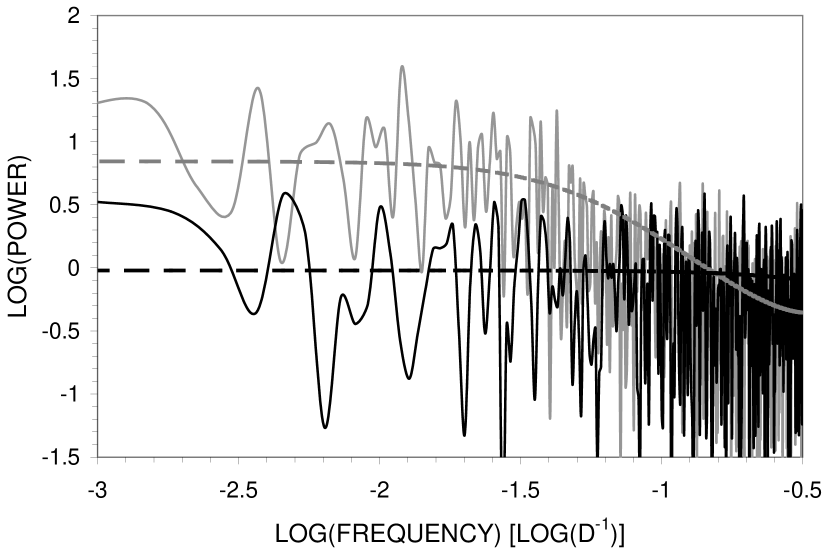
The power spectrum of the RXTE ASM data for 4U 1916-053 appears to be dominated by white noise. This result is in contrast to the results of Homer et al. (2001), who found that red noise dominated the power spectrum of the first four years of RXTE ASM data. Analysis of the Homer et al. (2001) data using our analysis methods confirm that red noise was indeed dominant in the RXTE ASM data, but has since dropped in significance. Figure 3 presents a comparison between the power spectra generated for the RXTE ASM data covering the Homer et al. (2001) epoch (MJD 50150 – 51500) and the time span used for our analyses (MJD 53360 – 53900), clearly showing the drop in red noise.
5.4 Cyg X-2
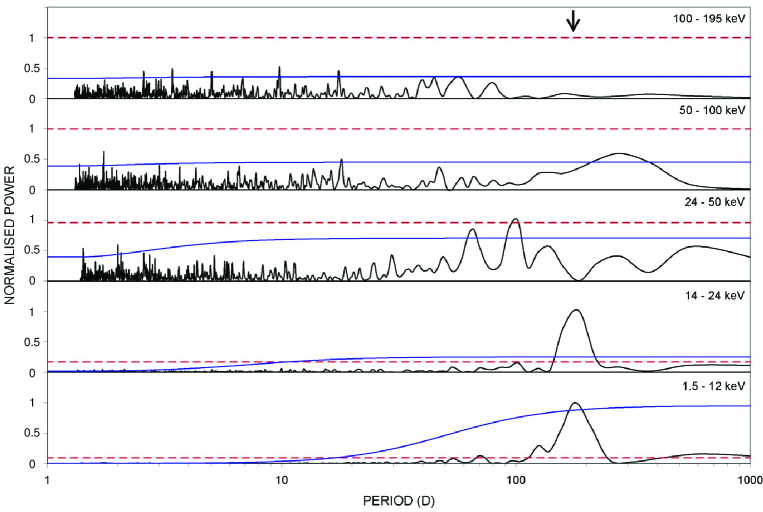
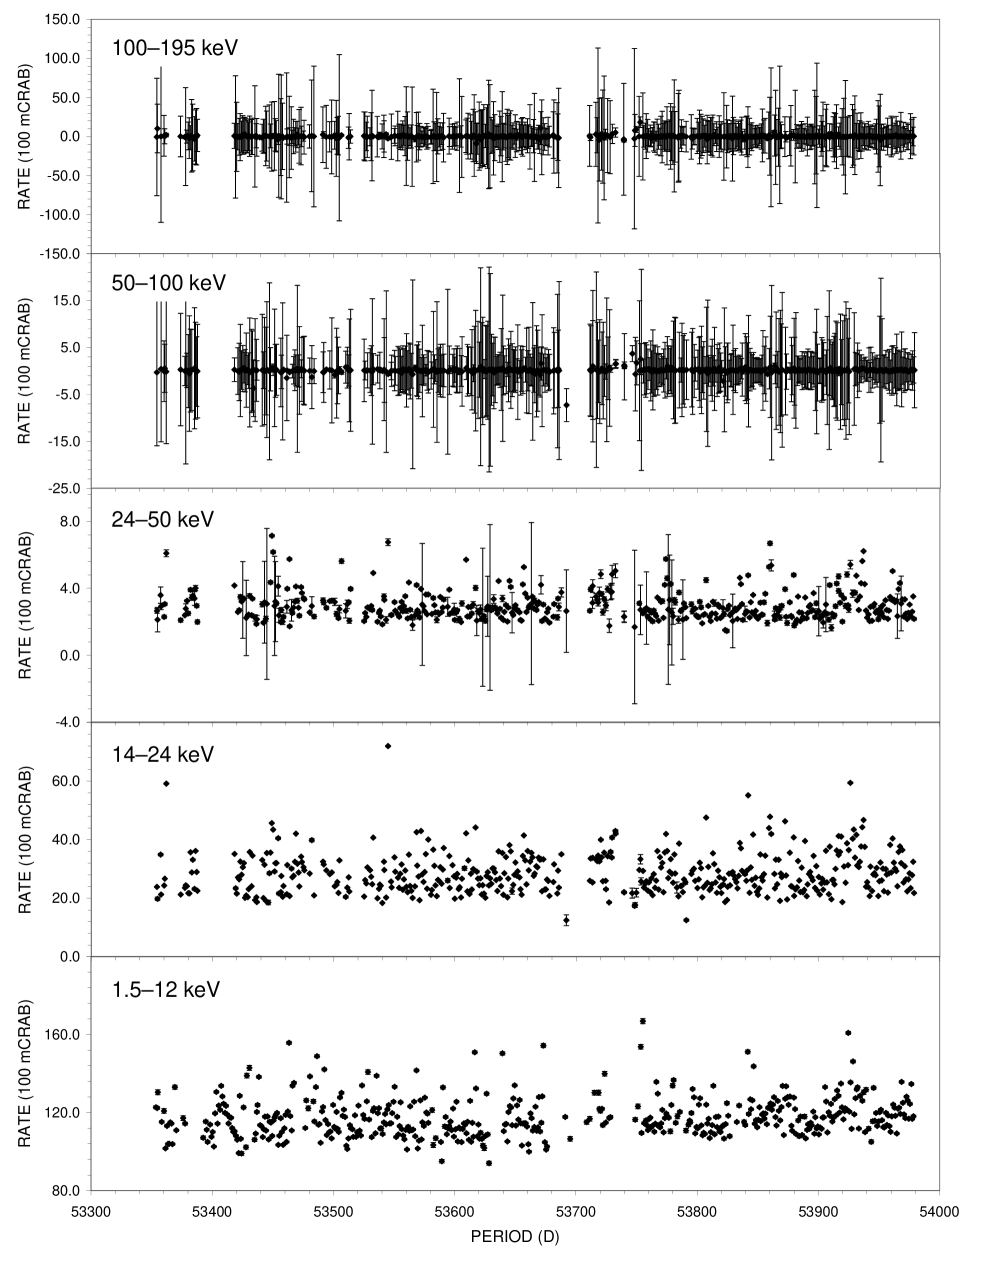
Figure 10 shows the RXTE ASM and Swift BAT light curves for Cyg X-2 while Figure 15 shows the power spectra. A strong, broad peak at 190 d is present in the RXTE ASM 1.5 – 12 keV and BAT 14 – 24 keV power spectra. These peaks are located at approximately 0.5 yr, a common location for spurious peaks (see for see for example Farrell et al., 2005). No other significant peaks are present in any of the energy bands. A peak at 40 d is present in the power spectrum from the RXTE ASM data, similar to the 40.4 d signal detected by Paul et al. (2000). Although the power of this peak exceeds the 99 white noise significance level, it is well below the red noise significance level.
5.5 Sco X-1
6 Discussion
The typical shape of the X-ray spectrum for LMXBs consists of a thermal Comptonisation component (sometimes empirically modelled as a power law with exponential cut-off) curtailed at low energies by photoelectric absorption, often with the addition of a low-energy black body component arising either from thermal emission from the inner regions of the disc or very close to the surface of the neutron star (see for example Bloser et al., 2000b; Barret, 2001, for a review). In the low/hard state an additional power law component is sometimes required in order to model the hard X-ray tail (see for example Tarana et al., 2007), with the hard X-ray emission attributed variously to Comptonisation by high-temperature thermal or non-thermal electrons in the accretion disc corona or in compact jets.
6.1 The 170 d Period in 4U 1820-303
| BAT Energy Band | Flux Upper Limits ( 10-11 ergs cm-2 s-1) | ||||
|---|---|---|---|---|---|
| CPL + BB444cut-off power law plus black body model (Bloser et al., 2000b) | CompTT + BB555thermal Comptonisation plus black body model (Bloser et al., 2000b) | CPL + DBB666cut-off power law plus disk black body model (Bloser et al., 2000b) | CompTT777thermal Comptonisation model (Tarana et al., 2007) | CompTT + PL888thermal Comptonisation plus power law model (Tarana et al., 2007) | |
| B (24 – 50 keV) | 5.5 | 5.5 | 5.2 | 4.8 | 5.5 |
| C (50 – 100 keV) | 1.5 | 1.5 | 1.6 | 1.6 | 1.7 |
| D (100 – 195 keV) | 7.4 | 7.0 | 7.6 | 7.9 | 8.6 |
The 170 d period in 4U 1820-303 has been attributed to variable accretion linked to the presence of a third body in this system, whereby the eccentricity of the inner orbit is modulated by tidal effects produced by the outer body (Chou & Grindlay, 2001; Zdziarski et al., 2007a). Transitions between the high/soft and low/hard states over this timescale are linked to variability in the accretion rate (Bloser et al., 2000b) and the movement in and out of the inner region of the accretion disc (see for example Malzac, 2007), thus modulating the thermal Comptonisation region of the spectrum. This thermal Comptonisation component has been seen to dominate the spectrum up to 50 keV, above which 4U 1820-303 has only been detected on one occasion during the low/hard (island) state, during which a high energy non-thermal tail was found to dominate (Tarana et al., 2007).
The 170 d period has been seen to correspond to normal atoll source motion in the colour-colour diagram, with the minimum of the modulation coinciding with the transition to the island state (Bloser et al., 2000b). If the appearance of the high energy non-thermal tail is regular and tied to the island state (and thus the minimum of the super-orbital modulation), a hardening of the spectrum would be anticipated every 170 d. We would therefore expect to detect the modulation above 50 keV, anti-correlated with the low energy modulation. If the hard tail in 4U 1820-303 preferentially appears on a regular basis during the transition to the island state, we would also expect the low and high energy modulations to be out of phase. However, as mentioned in 5.2, no such phase shift is apparent in the folded profiles (Figure 2).
The super-orbital period should be present at least up to the 50 keV threshold, as a varying accretion rate would be expected to modulate the entire thermal Compton region of the spectrum. To test whether 4U 1820-303 would be detected by the BAT above 24 keV, we simulated spectra (1000 s integration times) using the BAT response files for the various island state spectral models applied to RXTE and INTEGRAL data by Bloser et al. (2000b) and Tarana et al. (2007), respectively.
Flux upper limits during the minimum of the 170 d modulation (i.e. the island state) in the three BAT energy bands above 24 keV were calculated for each of the Bloser et al. (2000b) and Tarana et al. (2007) island state spectral models. Table 3 lists the derived flux upper limits in the BAT B, C and D energy bands for each of the Bloser et al. (2000b) and Tarana et al. (2007) models. The projected flux in each band for each spectral model was also calculated, with the normalisation parameters set so that the 14 – 24 keV model count rate equalled the measured rate in this band (the only BAT band in which we can be certain 4U 1820-303 was detected).
In all cases except the Tarana et al. (2007) simple Comptonisation and the Bloser et al. (2000b) cut-off power law + disc black body models, the expected flux was far in excess of the derived upper limits in the 24 – 50 keV and 50 – 100 keV bands. Thus, within the uncertainties of this method, the non-detection of the 170 d modulation above 24 keV is most consistent with the softest island state spectral models in Tarana et al. (2007) and Bloser et al. (2000b).
6.2 The 46 d Period in 4U 1636-536
6.2.1 Formation of Compact Jets?
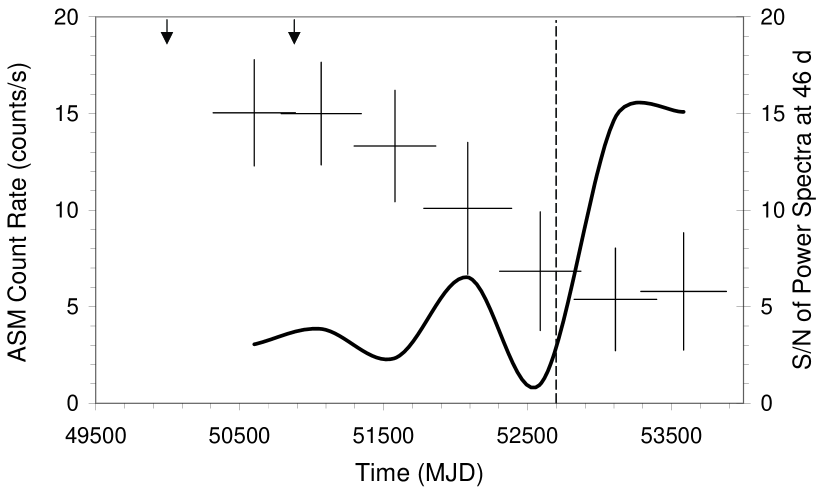
Fiocchi et al. (2006) linked the recent reduction in X-ray flux and the appearance of a high energy tail in the spectrum of 4U 1636-536 to the onset of jet formation. Interestingly, the 46 d modulation first appears in the RXTE ASM data around the same time as this transition to the low/hard state. Figure 4 shows the coarse binned RXTE ASM light curve up to MJD 53900 for 4U 1636-536 with the signal-to-noise (S/N) of the 46 d peak (as taken from overlapping power spectra generated from 600 d light curve sections with a 100 d overlap). The significance of the modulation can clearly be seen to increase markedly with the decrease in flux (the significance of the 46 d periodicity did not exceed the 99 significance levels until a S/N of 7 was reached). The appearance of a high energy power law tail in the spectrum in conjunction with the first detection of the 46 d period and the reduction in flux implies a link between the three phenomena. If the assertion made by Fiocchi et al. (2006) is correct (that the transition to the low/hard island state is linked to jet formation), the 46 d modulation could be tied to transient jet formation, or possibly to the precession of jets (linked in turn to the precession of a warped disc) in a similar fashion as seen in SS 433 (Margon, 1984).
As mentioned in 5.1, the 46 d modulation is clearly seen in each of the folded profiles shown in Figure 1, with the phase of the modulation shifting with increasing energy so that the BAT C (50 – 100 keV) profile is almost 180∘ out of phase with the RXTE ASM (1.5 – 12 keV) profile. A similar phase shift was observed between the RXTE ASM and INTEGRAL light curves by Shih et al. (2005), which was attributed to the high and low energy modulations originating at different locations. In comparison, the profiles of the light curves of 4U 1820-303 when folded over the 170 d period show no such phase shift (Figure 2).
6.2.2 Interpreting the Phase Shift
The detection of the 46 d modulation in both the high and low energy realms of the spectrum indicate that both the thermal and non-thermal components are varying over this timescale. The phase shift of the modulation is inconsistent with the standard warped precessing disc model for super-orbital variability, as periodic obscuration or reflection would be expected to cause the high and low energy modulations to vary in phase. We interpret this phase shift as an indication that the 46 d modulation arises from two separate (yet closely linked) phenomena. If the low energy modulation seen in the RXTE ASM light curves is indeed due to variable obscuration of the central emission region (either the inner regions of the disc or the neutron star itself), and the high energy modulation seen in the BAT data is a result of a varying viewing geometry of the beamed emission from the jet, it is possible to see two similar modulations in different energy bands that are out of phase. In this scenario, the jet column will be pointing towards us at roughly the same time as the bulge in the disc is obscuring the central emission region. Thus we would see an increase in the high energy flux at the same time as a decrease in the low energy flux (as observed in the RXTE ASM and BAT data), with the high and low energy flux varying smoothly as the disc and jet precess together.
Many systems which show super-orbital modulation ascribed to disc precession do not show any evidence for jet formation, and in some cases jet formation is inhibited due to the presence of a highly magnetised neutron star (e.g. Her X-1). However, if a warped precessing disc is present, any jets which form would expect to be coupled to the warped disc and should themselves precess. The jet would be aligned with the normal axis of the inner disc, so the scenario in which the bulge is phased to obscure the inner disc at the precise time as the jet points towards us is unlikely.
6.2.3 Transient Jet Formation?
A somewhat simpler explanation would be that the 46 d modulation is linked to periodic transitions between the high/soft and low/hard states, leading to transient jet formation. In this alternate scenario, the inner region of the disc moves in as the accretion rate intensifies, resulting in an increase in the flux of seed photons and therefore an enhancement in the thermal Comptonisation (i.e. soft) component of the spectrum. In this high/soft state the conditions are not believed to be sufficient for jet formation: the disc is thought to be geometrically thin yet optically thick, with a relatively small corona as most of the accretion power is believed to be dissipated in the disc itself (see for example Malzac, 2007). The hard region of the spectrum during this state is characterised by a weak, steep power law, generally interpreted as inverse Compton up-scattering of soft photons by non-thermal electrons in the corona (see for example Barret, 2001). As the accretion rate decreases, the inner regions of the disc move further out and the disc cools, becoming geometrically thick yet optically thin. In this state most of the accretion power is believed to be transported into the corona, which in turn is thought to power the compact jet. The soft thermal component from the disc decreases as the flux of seed photons lessens, and the strong hard non-thermal component appears in conjunction with the jets. Thus an anti-correlation between the hard and soft X-ray flux would result, with both fluxes modulated over the 46 d period. In this scenario the 46 d period would represent the characteristic timescale between disruption and recovery of the disc.
6.2.4 Searching for Radio Emission
Recently, Migliari et al. (2007) showed there to be a direct link between radio jet emission and the X-ray state in the neutron star X-ray binary GX 17+2. They also showed that the presence of a hard X-ray tail was coupled to the low/hard X-ray state, implying a link between the presence of radio jets and the appearance of the hard tail in the spectrum. Thus, if transient jet formation linked to spectral state transitions is the cause of the 46 d period, we would expect radio emission from this source to be modulated in phase with the hard X-ray modulation, as the jets form and radio emission ensues (see for example Corbel et al., 2003).
A review of the Australian Telescope Compact Array (ATCA) online archive (ATOA) shows that two previous radio observations of 4U 1636-536 were performed on 1995 September 2 and 1998 April 4, with upper limits of 0.12 mJy and 0.15 mJy derived at 4.8 GHz and 8.6 GHz respectively (Berendsen et al., 2000). Both observations were performed during the high/soft state, when compact jets and resulting radio emission would not be expected. More recent observations were performed with the ATCA on 2007 June 29, 30 and July 1 as part of a multi-wavelength collaboration to study LMXBs of all kinds at various epochs999http://www.cfa.harvard.edu/twiki/bin/view/GreatObs/JetsDisks. While this data is still proprietary, the principal investigator of these observations was kind enough to communicate the preliminary results; a 3 upper limit of 0.6 mJy was derived at 8.6 GHz (J. Dickey 2007, private communication).
The 2 – 10 keV X-ray flux in the low/hard state measured with INTEGRAL was 1 10-9 erg cm-2 s-1 (M. Fiocchi 2007, private communication), giving a luminosity of 2 1036 erg s-1 for a distance of 4.3 kpc (Jonker & Nelemans, 2004) and 4 1036 erg s-1 for a distance of 6 kpc (Galloway et al., 2006). According to the X-ray/radio luminosity correlation for neutron star LMXBs derived by Migliari Fender (2006), 4U 1636-536 should thus have a radio luminosity (from measurements around 8.5 GHz) of somewhere between (3 – 20) 1028 erg s-1. The 8.5 GHz flux density would thus be 1 mJy, barely sufficient for a detection to be made in the recent ATCA observations.
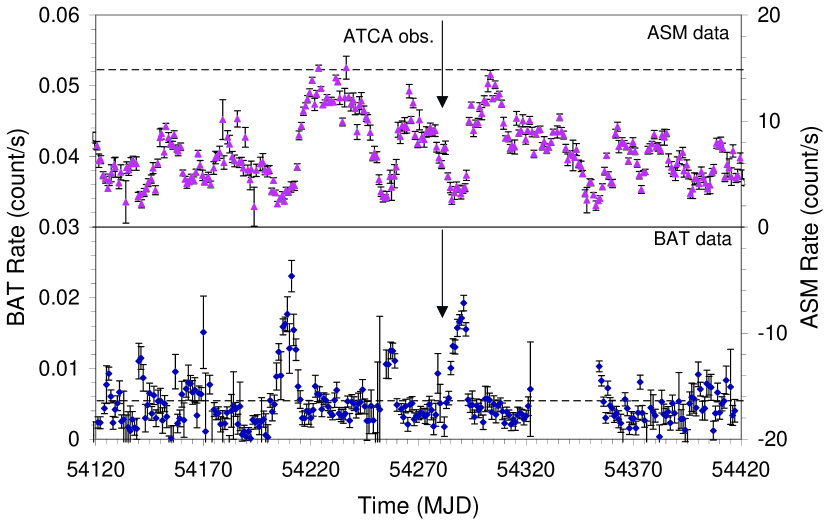
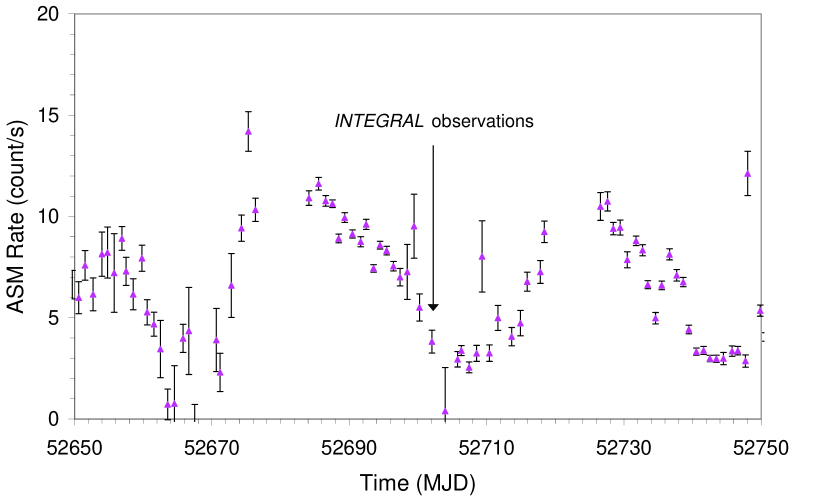
Comparing the timing of these recent observations with the RXTE ASM 1.5 – 12 keV and the BAT 14 – 50 keV light curves (Figure 5) shows that they occurred just after the maximum of the modulation in the soft X-ray band, and just before the increase in hard X-ray flux. These observations thus appear to have been performed before the transition to the low/hard state and the predicted phase of jet formation. Further support for this theory is obtained when the timing of the INTEGRAL observations — during which the hard tail was detected by Fiocchi et al. (2006) — is compared with the soft X-ray RXTE ASM light curve (Figure 6). It can clearly be seen that the detection of the hard tail occurred during the minimum of the soft X-ray modulation, at the same time as we would have expected to see a peak in the BAT hard X-ray light curve had monitoring data been available during this epoch.
6.3 Non-detections
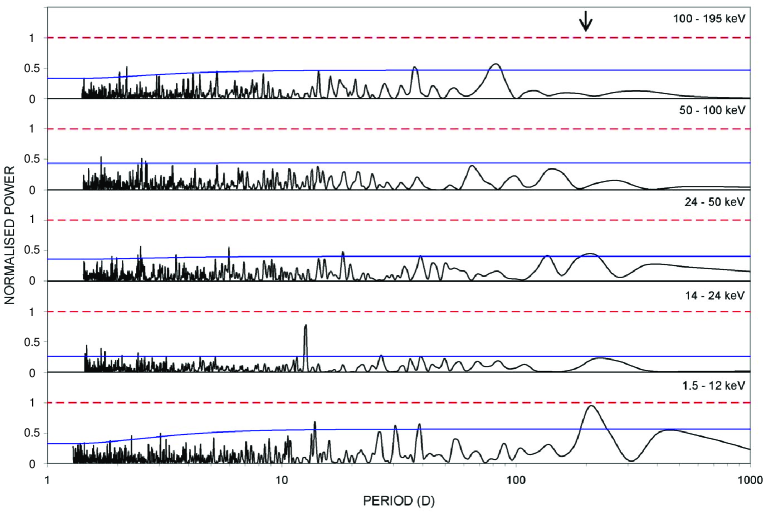
No evidence for the previously reported super-orbital periods in 4U 1916-053, Cyg X-2 or Sco X-1 was found in the RXTE ASM or any of the BAT light curves. The power spectra were instead dominated by low-frequency noise, with no peaks that would indicate the presence of real long-term periodic modulation. The modulations for 4U 1916-053 and Cyg X-2 were originally reported using Vela 5B data, with later analyses by Wen et al. (2006) of 8.5 yr of RXTE ASM data finding no significant stable modulation from either source. The detection of super-orbital modulation in Sco X-1 was reported using only the first 9 months of RXTE ASM data. It is thus apparent that either the reported detections were spurious, the mechanisms behind the super-orbital variability in each of these three systems has since ceased, or the modulation does not persist over a sufficient fraction of the observing window to be detectable by our techniques. Unfortunately, the BAT light curves do not cover a sufficiently long epoch for us to subdivide the light curves, thus precluding dynamic analyses to search for signals that are potentially transient or variable in frequency.
7 Conclusions
We have analysed the RXTE ASM and Swift BAT light curves in the 1.5 – 195 keV range for 4U 1636-536, 4U 1820-303, 4U 1916-053, Cyg X-2 and Sco X-1. We found no evidence for periodic variability at the previously reported super-orbital periods from 4U 1916-053, Cyg X-2 or Sco X-1 in either the RXTE ASM or BAT data. In contrast, the 170 d period in 4U 1820-303 is clearly detected up to 24 keV, consistent with the modulation arising from variable accretion due to tidal effects from the third body in the triple system. The 46 d period in 4U 1636-536 was significantly detected in the RXTE ASM data and up to 100 keV in the BAT data, with the profile of the high energy modulation found to be 180∘ out of phase with that seen in the 1.5 – 12 keV band. This behaviour is inconsistent with the modulation arising solely from variable photoelectric absorption due to the precession of a warp in the accretion disc, leading us to interpret it as evidence that the high and low energy modulations arise from two separate yet closely linked phenomena. The appearance of the 46 d period in conjunction with the transition to the low/hard state is intriguing, leading us to speculate that this modulation could be tied to the formation of transient compact jets. In this scenario, the low energy modulation would result from a thermal Compton component of the spectrum which varies with the accretion rate. The high energy modulation would thus be tied to the appearance of the non-thermal hard tail arising from the formation of compact jets during episodes of decreased accretion. Further monitoring observations at radio wavelengths are being sought in order to confirm this conclusion.
Acknowledgments
This work made use of quick-look results provided by the ASM/RXTE team. The authors thank members of the Swift BAT team for helpful discussions. We thank Steven Tingay for his valuable discussions and John Dickey for kindly communicating the preliminary results of the ATCA observations of 4U 1636-536. We thank the anonymous referee for their comments which improved this paper.
References
- Andrew & Purton (1968) Andrew B. H., Purton C. R., 1968, Nat, 218, 855
- Barret (2001) Barret D., 2001, AdSpR, 28, 307
- Barthelmy et al. (2005) Barthelmy S. D., et al., 2005, SSRv, 120, 143
- Becker et al. (1977) Becker R. H., Smith B. W., Swank J. H., Boldt E. A., Holt S. S., Pravdo S. H., Serlemitsos P. J., 1977, ApJ, 216, L101
- Berendsen et al. (2000) Berendsen S. G. H., Fender R., Kuulkers E., Heise J., van der Klis M., 2000, MNRAS, 318, 599
- Bloser et al. (2000a) Bloser P. F., Grindlay J. E., Barret D., Boirin L., 2000a, ApJ, 542, 989
- Bloser et al. (2000b) Bloser P. F., Grindlay J. E., Kaaret P., Zhang W., Smale A. P., Barret D., 2000b, ApJ, 542, 1000
- Bradshaw et al. (1999) Bradshaw C. F., Fomalont E. B., Geldzahler B. J., 1999, ApJ, 512, L121
- Byram et al. (1966) Byram E. T., Chubb T. A., Friedman H., 1966, Sci, 152, 66
- Casares et al. (1998) Casares J., Charles P. A., Kuulkers E., 1998, ApJ, 493, L39
- Casares et al. (2006) Casares J., Cornelisse R., Steeghs D., Charles P. A., Hynes R. I., O’Brien K., Strohmayer T. E., 2006, MNRAS, 373, 1235
- Corbel et al. (2003) Corbel S., Nowak M. A., Fender R. P., Tzioumis A. K., Markoff S., 2003, A&A, 400, 1007
- Chou & Grindlay (2001) Chou Y., Grindlay J. E., 2001, ApJ, 563, 934
- Chou, Grindlay & Bloser (2001) Chou Y., Grindlay J. E., Bloser P. F. 2001, ApJ, 549, 1135
- Clarkson et al. (2003a) Clarkson W. I., Charles P. A., Coe M. J., Laycock S., Tout M. D., Wilson C. A., 2003a, MNRAS, 339, 447
- Clarkson et al. (2003b) Clarkson W. I., Charles P. A., Coe M. J., Laycock S., 2003b, MNRAS, 343, 1213
- Corbet, Markwardt & Tueller (2007) Corbet R. H. D., Markwardt C. B., Tueller J., 2007, ApJ, 655, 458
- D’Amico et al. (2001) D’Amico F., Heindl W. A., Rothschild R. E., Gruber D. E., 2001, ApJ, 547, L147
- Di Salvo et al. (2002) Di Salvo T., Robba N., Stella L., 2002, MmSAI, 73, 1082
- Di Salvo et al. (2006) Di Salvo T., Goldoni P., Stella L., van der Klis M., Bazzano A., Burderi L., Farinelli R., Frontera F., Israel G. L., Méndez M., Mirabel I. F., Robba N. R., Sizun P., Ubertini P., Lewin W. H. G., 2006, ApJ, 649, L91
- Farrell et al. (2005) Farrell S. A., O’Neill P. M, Sood R. K., 2005, PASA, 22, 267
- Farrell et al. (2008) Farrell S. A., Sood R. K., O’Neill P. M., Dieters S., 2008, MNRAS, 389, 608
- Fender (2006) Fender R., 2006, in Lewin W., van der Klis M., eds., Compact Stellar X-ray Sources. Cambridge University Press, Cambridge, p. 381
- Fiocchi et al. (2006) Fiocchi M., Bazzano A., Ubertini P., Jean P., 2006, ApJ, 651, 416
- Fomalont et al. (2001) Fomalont E. B., Geldzahler B. J., Bradshaw C. F., 2001, ApJ, 553, L27
- Galloway et al. (2006) Galloway D. K., Psaltis D., Muno M. P., Chakrabarty D., 2006, ApJ, 639, 1033
- Giacconi et al. (1962) Giacconi R., Gursky H., Paolini F., Rossi B., 1962, Phys. Rev. Lett., 9, 439
- Giacconi et al. (1974) Giacconi R., Murray S., Gursky H., Kellogg E., Schreier E., Matilsky T., Koch D., Tananbaum H., 1974, ApJS, 27, 37
- Gottlieb et al. (2001) Gottlieb E. W., Wright E. L., Liller W., 1975, ApJ, 195, L33
- Grindlay et al. (1976) Grindlay J. E., Gursky H., Schnopper H., Parsignault D. R., Heise J., Brinkman A. C., Schrijver J., 1976, ApJ, 205, L127
- Grindlay et al. (1988) Grindlay, J. E., Bailyn C. D., Cohn H., Lungger P. M., Thorstensen J. R., Wegner G. 1988, ApJ, 334, L25
- Grindlay (1992) Grindlay, J. E., 1992, in Proc. 28th Yamada Conf., Frontiers of X-Ray Astronomy, eds. Y. Tanaka and K. Koyama, Universal Academy, Tokyo, 69
- Harmon et al. (2004) Harmon B. A., et al., 2004, ApJS, 154, 585
- Hasinger & van der Klis (1989) Hasinger G., van der Klis M., 1989, A&A, 225, 79
- Hoffman et al. (1977) Hoffman J. A., Lewin W. H. G., Doty J., 1977, ApJ, 217, L23
- Homer et al. (2001) Homer L., Charles P. A., Hakala P., Muhli P., Shih I.-C., Smale A. P., Ramsay G., 2001, MNRAS, 322, 827
- Jonker & Nelemans (2004) Jonker P. G., Nelemans G., 2004, MNRAS, 354, 355
- Kong et al. (1998) Kong A. K. H., Charles P. A., Kuulkers E., 1998, NewA, 3, 301
- Kuulkers et al. (2003) Kuulkers E., den Hartog P. R., in’t Zand J. J. M., Verbunt F. W. M., Harris W. E., Cocchi M., 2003, A&A, 399, 663
- Larwood et al. (1996) Larwood J. D., Nelson R. P., Papaloizou J. C. B., Terquem C., 1996, MNRAS, 282, 597
- Lavagetto et al. (2006) Lavagetto G., di Salvo T., Falanga M., Iaria R., Robba N. R., Burderi L., Lewin W. H. G., Méndez M., Stella L., van der Klis M., 2006, A&A, 445, 1089
- Lewin et al. (1977) Lewin W. H. G., Hoffman J. A., Doty J., Clark G. W., Swank J. H., Becker R. H., Pravdo S. H., Serlemitsos P. J., 1977, Nat, 267, 28
- Lomb (1975) Lomb N. R., 1975, ApSS, 39, 447
- Malzac (2007) Malzac J., 2007, Ap&SS, 311, 149
- Margon (1984) Margon B., 1984, ARA&A, 22, 507
- Migliari & Fender (2006) Migliari S., Fender R. P., 2006, MNRAS, 366, 79
- Migliari et al. (2007) Migliari S., et al., 2007, ApJ, 671, 706
- Mirabel & Rodrigues (2003) Mirabel I. F., Rodrigues I., 2003, A&A, 398, L25
- Ogilvie & Dubus (2001) Ogilvie G. I., Dubus G., 2001, MNRAS, 320, 485
- Orosz & Kuulkers (1999) Orosz J. A., Kuulkers E., 1999, MNRAS, 305, 1320
- Paul & Kitamoto (2002) Paul B., Kitamoto S., 2002, JApA, 23, 33
- Paul et al. (2000) Paul B., Kitamoto S., Makino F., 2000, ApJ, 528, 410
- Pedersen et al. (1981) Pedersen H., van Paradijs J., Lewin W. H. G., 1981, Nat, 294, 725
- Peele & White (1996) Peele A. G., White N. E., 1996, IAU Circ., 6524
- Piraino et al. (2002) Piraino S., Santangelo A., Kaaret P., 2002, ApJ, 567, 1091
- Press & Rybicki (1989) Press W. H., Rybicki G. B., 1989, ApJ, 338, 277
- Priedhorsky & Terrell (1984a) Priedhorsky W., Terrell J., 1984a, ApJ, 280, 661
- Priedhorsky & Terrell (1984b) Priedhorsky W., Terrell J., 1984b, ApJ, 284, L17
- Psaltis (2006) Psaltis D., 2006, Compact stellar X-ray sources, 1
- Rappaport et al. (1987) Rappaport S., Ma C. P., Joss P. C., Nelson L. A., 1987, ApJ, 322, 842
- Rutten et al. (1992) Rutten R. G. M., van Paradijs J. Tinbergen J., 1992, AA, 260, 213
- Scargle (1982) Scargle J. D., 1982, ApJ, 263, 835
- Scargle (1989) Scargle J. D., 1989, ApJ, 343, 874
- Schulz & Mudelsee (2002) Schulz M., Mudelsee M., 2002, CG, 28, 421
- Shih et al. (2005) Shih I. C., Bird A. J., Charles P. A., Cornelisse R., Tiramani D., 2005, MNRAS, 361, 602
- Šimon (2005) Šimon V., 2005, A&A, 436, 263
- Smale (1998) Smale A. P., 1998, ApJ, 498, L141
- Smale & Lochner (1992) Smale A. P., Lochner J. C., 1992, ApJ, 395, 582
- Sood et al. (2006) Sood R. K., Farrell S. A., O’Neill P. M, Manchanda R. K., Ashok N. M., 2006, ASR, 38, 2779
- Sood et al. (2007) Sood R. K., Farrell S. A., O’Neill P. M, Dieters S., 2007, ASR, 40, 1528
- Stairs et al. (2000) Stairs I. H., Lyne A. G., Shemar S. L., 2000, Nat, 406, 484
- Stella et al. (1987) Stella L., Priedhorsky W., White N. E., 1987, ApJ, 312, L17
- Swank et al. (1984) Swank J. H., Taam R. E., White N. E., 1984, ApJ, 277, 274
- Strickman & Barret (2000) Strickman M., Barret D., 2000, AIPC, 510, 222
- Tarana et al. (2007) Tarana A., Bazzano A., Ubertini P., Zdziarski A. A., 2007, ApJ, 654, 494
- Trümper et al. (1986) Trümper J., Kahabka P., Ögelman H., Pietsch W., Voges W., 1986, ApJ, 300, L63
- Vanderlinde et al. (2003) Vanderlinde K. W., Levine A. M., Rappaport S. A., 2003, PASP, 115, 739
- Weiler et al. (1992) Weiler K. W., van Dyk S. D., Pringle J. E., Panagia N., 1992, ApJ, 399, 672
- Wen et al. (2006) Wen L., Levine A. M., Corbet R. H. D., Bradt H. V., 2006, ApJS, 163, 372
- White & Swank (1982) White N. E., Swank J. H., 1982, ApJ, 253, L61
- Wijers & Pringle (1999) Wijers R. A. M., Pringle J. E., 1999, MNRAS, 308, 207
- Wijnands et al. (1996) Wijnands R. A. D., Kuulkers E., Smale A. P., 1996, ApJ, 473, L45
- Zdziarski et al. (2007a) Zdziarski A. A., Wen L., Gierliński M., 2007a, MNRAS, 377, 1006
- Zdziarski et al. (2007b) Zdziarski A. A., Gierliński M., Wen L., Kostrzewa Z., 2007b, MNRAS, 377, 1017
- Zhang et al. (1998) Zhang W., Smale A. P., Strohmayer T. E., Swank J. H., 1998, ApJ, 500, L171
Appendix A Light Curves
Appendix B Power Spectra