The solar chromosphere at high resolution with IBIS
Abstract
Context. Filtergrams obtained in Ca II H, Ca II K and H are often employed as diagnostics of the solar chromosphere. The vastly disparate appearance between the typical filtergrams in these different lines calls into question the nature of what is actually being observed.
Aims. We investigate the lack of obvious structures of magnetic origin such as fibrils and mottles in on-disk Ca II H and K images.
Methods. We directly compare a temporal sequence of classical Ca II K filtergrams with a co-spatial and co-temporal sequence of spectrally resolved Ca II 854.2 images obtained with the Interferometric Bidimensional Spectrometer (IBIS), considering the effect of both the spectral and spatial smearing. We analyze the temporal behavior of the two series by means of Fourier analysis.
Results. The lack of fine magnetic structuring in Ca II K filtergrams, even with the narrowest available filters, is due to observational effects, primarily contributions from the bright, photospheric wings of the line that swamp the small and dark chromospheric structures. Signatures of fibrils remain however in the temporal evolution of the filtergrams, in particular with the evidence of magnetic shadows around the network elements. The Ca II K filtergrams do not appear, however, to properly reflect the high-frequency behavior of the chromosphere. Using the same analysis, we find no significant chromospheric signature in the Hinode/SOT Ca II H quiet-Sun filtergrams.
Conclusions. The picture provided by H and Ca II 854.2, which show significant portions of the chromosphere dominated by magnetic structuring, appears to reflect the true and essential nature of the solar chromosphere. Data which do not resolve, spatially or spectrally, this aspect may misrepresent the behavior the chromosphere.
Key Words.:
Sun: Chromosphere — Sun: magnetic fields — instrumentation: high angular resolution — line: formation — techniques: spectroscopic1 Introduction
The Ca II H and K resonance spectral lines have long been used for diagnostics of the solar chromosphere. The crucial results obtained with these strong lines, particularly those based on observations using slit-based spectrographs, have been summarized by Rutten & Uitenbroek (1991). Imaging observations, most often using Lyot-type filters (0.03–0.2 nm FWHM), have also been widely employed. Their use has much increased in recent years in part due to the availability of efficient image stabilizing systems and image reconstructions techniques, both of which allow high spatial resolution to be maintained over long period of times.
Several studies have used filter observations in an effort to assess the characteristics of the chromosphere via the examination of the spatial distribution and temporal evolution of structures in the two-dimensional field of view (e.g. Ermolli et al. 1998; de Wijn et al. 2005a; Wöger et al. 2006; Tritschler et al. 2007). Most recently, a broadband Ca II H filter (0.22 nm FWHM) has been flown on the Hinode satellite, allowing the acquisition of long time series free from terrestrial atmospheric distortions. Novel results from this instrument include small scale penumbral jets (Katsukawa et al. 2007), the spatial patterning of chromospheric umbral oscillations (Nagashima et al. 2007), the rapid evolution of spicules (De Pontieu et al. 2007), and more.
However, the on-disk images obtained in the H and K lines with these filters are always significantly different from the appearance of the chromosphere in the other preeminent chromospheric line, H. Observations in the latter line, using even relatively broad filters (0.1 nm FWHM) show a highly structured environment including fibrils, mottles, and filaments. This is consistent with the increasing dominance of the magnetic field as the plasma drops at increasing heights in the atmosphere. Images in the Ca II H and K lines, instead, do not show many examples of such structuring by the magnetic field, even when using the narrowest available passbands (cf. the images shown in Wöger et al. 2006). Observations of a correspondence between fibrils seen in H and Ca II H and K were observed as long ago as Bumba & Howard (1965) and Beckers (1964) using spectroheliograms, but with a reduced contrast. Rutten (2007) remarks that the fibrils seen in Ca II H and K filtergrams are at best visible only as ghostly impressions of their counterparts observed in H. Why does the observed scene differs so greatly between these two sets of “chromospheric” lines?
Another set of Ca II lines, the so-called “infrared triplet” around 850 nm may provide for the resolution of this apparent discrepancy. Like H, the Ca II IR triplet lines are subordinate, but whereas the lower level of the former is coupled to the hydrogen ground level via the extremely strong Ly radiative transition, the lower level of the latter lines is metastable and only coupled to the Ca II ground level via electronic collisions. This accounts for a stronger coupling of the Ca II IR triplet to local conditions and allows a more straightforward interpretation of the line formation (Uitenbroek 1989). Observationally, the use of the infrared lines also provides several significant advantages with respect to H and K, including a typically better response of digital detectors in the red, a reduction in atmospheric turbulence, and a higher photon flux. Indeed, in recent years, the use of the infrared triplet for solar studies has increased notably (see, e.g. Socas-Navarro et al. 2006; Uitenbroek 2006b; Tziotziou et al. 2006), although studies combining spatial and spectral high resolution over extended fields of view (FOV) are still scarce.
In Paper I and II of this series (Cauzzi et al. 2008; Vecchio et al. 2008) we presented novel observations of the Ca II 854.2 nm line of the infrared triplet, obtained with the Interferometric Bidimensional Spectrometer (IBIS, Cavallini 2006). These studies established the suitability of imaging spectroscopy in this line for high–resolution studies of chromospheric diagnostics. A central finding of Paper I was the nearly ubiquitous occurrence of fibrilar structures. These originate from even the smallest magnetic elements, and appear to fill large portions of the chromospheric volume, even in “quiet” areas. Their presence indicates that even at the relatively low chromospheric heights sampled by the Ca II 854.2 line, the atmosphere is already highly structured by the pervasive magnetic fields, entirely consistent with the picture provided by H images. The fibrils in turn play a crucial role in shaping the chromospheric dynamics, in particular producing a strong reduction in the oscillatory power at periods around 3 minutes, correlated with the absence of chromospheric acoustic shocks (Vecchio et al. 2007, Paper I, Paper II).
The question is then why this subordinate line would display a more “chromospheric” scene than the resonance H and K lines, which have a far larger opacity. In Paper I we put forward the hypothesis that a large part of the problem lies in the strong observational limitations that still affect Ca II H and K imaging. Namely, while the chromospheric contribution of the Ca II H and K is limited to a narrow core of less than 0.02 nm width, virtually all the imaging is performed with much broader filters, having FWHM passbands in the range of 0.03 – 0.3 nm. Further, the decreased photon flux and low filter transmission lead to long exposures (often one second or more) that, combined with the increased seeing disturbances at shorter wavelengths, severely limits the spatial resolution that can be consistently achieved.
In this paper, we explore these and other effects by a direct comparison between spatially and spectrally resolved IBIS Ca II 854.2 data and cotemporal Ca II K filtergrams. This builds on the preliminary results that have been reported in Reardon et al. (2007) and allows us to compare the clear chromospheric signatures seen in the IBIS spectra with the behavior observed in the Ca II K filtergrams.
2 Observations
The observations were obtained on 2 June 2004, starting around 15:00 UT, at the Dunn Solar Telescope (DST) of the US National Solar Observatory. Seeing conditions were excellent during most of the approximately one-hour-long sequence, aided by a high order adaptive optics system (Rimmele 2004). The target region was a quiet area at disk center, that included some portions of enhanced, bipolar network, well observed in the MDI high resolution magnetic maps. At continuum wavelengths the magnetic concentrations corresponded to a few transient pores, that appeared and disappeared repeatedly during the course of the observations. In coronal images, the region appeared as a fading coronal bright point.
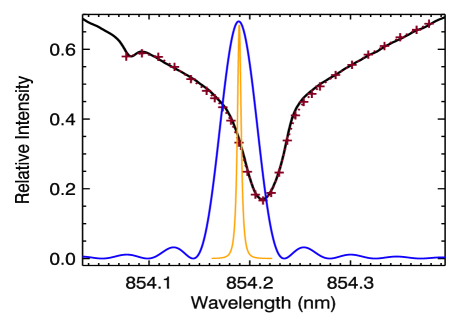
The Ca II 854.2 data utilized in this paper have been described in detail in Paper I. We thus summarize here only the most important aspects of the observations. The field of view (FOV) covered an 80″diameter circle on the Sun with a plate scale of 0.166″/pixel. The Ca II 854.2 nm line was sampled with 27 spectral points (see Fig. 1), which were acquired in a total of 7 seconds. The repetition time between scans was 19 seconds (the entire sequence also included scans of two other photospheric lines). A total of 175 scans of the spectral line were obtained for a total duration of 55 minutes. The instrumental spectral profile of IBIS is described in Reardon & Cavallini (2008) and at this wavelength has a FWHM of 4.4 pm, with spectrally scattered light less than 1.5% of the total transmission.
Simultaneously with the IBIS spectral data, Ca II K images were obtained through a Halle filter with a nominal FWHM = 0.06 nm, centered at 0.03 nm from line core. The spatial scale was set at 0.08″/pix, and a FOV of approximately 82″82″. Given the overall low light level with this setup, the exposure time for each image was 1.2 seconds. Images were obtained every 2 seconds during the same one hour period, producing a sequence of 1576 frames.
Both sequences of data were subjected to destretching, to remove residual distortions introduced by the terrestrial atmosphere. For the narrowband IBIS data, reference images were provided by strictly simultaneous white light images, while the Ca II K data was destretched with respect to an averaged image. The Ca II K data were then interpolated to same spatial scale as the IBIS data, using images of a reference grid acquired for this purpose. Finally, the Ca II K filtergram closest in time to the moment of acquisition of the Ca II 854.2 line core images was selected for each of the 175 spectral scans.
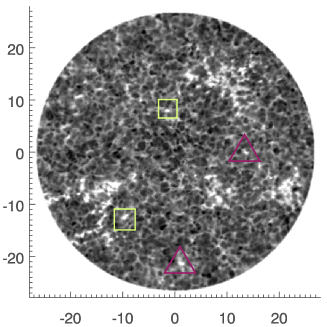
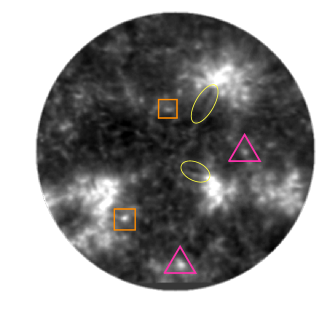
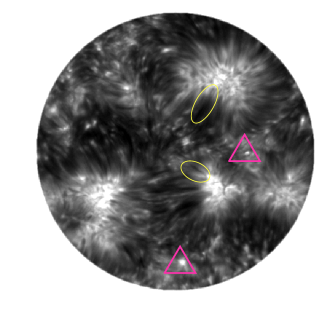
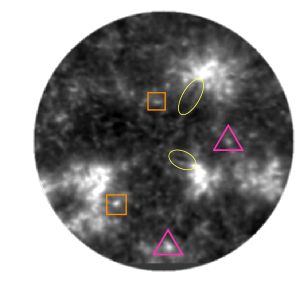
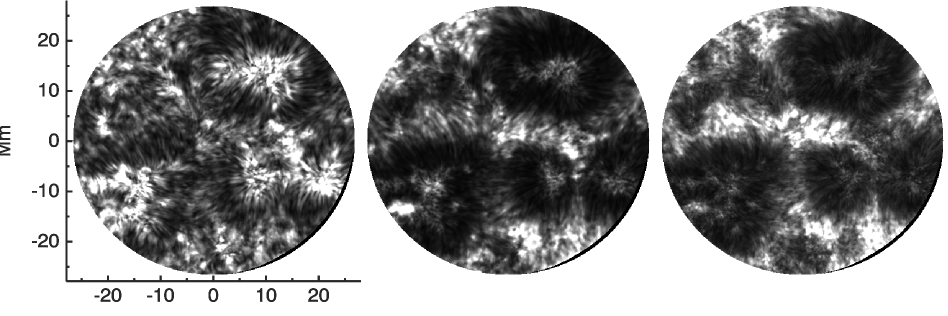
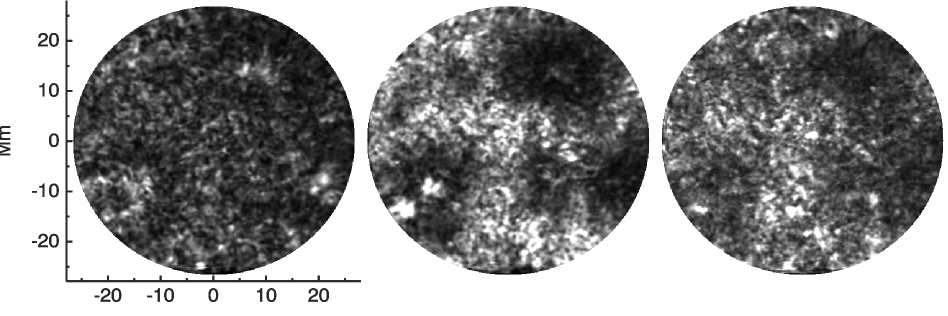
Fig. 2 shows the full FOV of the observations, at one time during the observing sequence. The leftmost panel displays the intensity image acquired at 0.07 nm from the Ca II 854.2 line core. As described in Paper I, this position in the line wing originates at an average height of 200 km and the photospheric reversed granulation pattern (Janssen & Cauzzi 2006; Cheung et al. 2007) and magnetic flux concentrations (Paper I; Leenaarts et al. 2006) are easily discernible throughout the field. The rightmost panel displays instead the intensity at the nominal Ca II 854.2 line core wavelength formed at a height of roughly 1200 km. At the center of the line, fibrils are seen to occupy a large fraction of the FOV, strongly reminiscent of the structures observed in H. The fibrils can be seen as both bright and dark elongated structures originating from even the small magnetic network elements. For how fibrils appear at other wavelengths within the line, we refer the reader to Paper I.
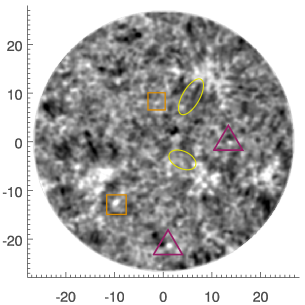
The middle panel of Fig. 2 shows the Ca II K filtergram closest in time to the displayed IBIS images. An essential aspect of this comparison is the presence in the Ca II K image of features that can be associated with structures present in either the Ca II 854.2 line wing images (squares), the line core images (ovals), or both (triangles). In particular, some of the strongest fibrils observed in the Ca II 854.2 core are also visible in the K filtergram.
3 Data Comparison
The net effect of any instrumental spectral profile is to mix information from different portions of a spectral line and thus arising from different layers in the solar atmosphere. This is in addition to the ”smearing” produced from the line formation itself (Uitenbroek 2006a). Such mixing is particularly relevant for the Ca II H and K lines because the large passband of the filters generally employed sum over a significant portion of the entire line profile. In such an integration, the very low residual intensity of the chromospheric line center will be swamped by the much higher flux of the line wings originating in the photosphere. This will strongly dilute the chromospheric signal when observing on disk. As mentioned in the Introduction, in Paper I we put forward the hypothesis that the scarcity of fibrils observations in H and K filtergrams is mainly due to this effect.

On the other hand, IBIS data do not suffer this limitation: the filter passband is comparable to that of a spectrograph, and can effectively isolate the chromospheric portions of the line and resolve fine details in the spectral profiles of Ca II 854.2 (Paper I and II). Currently, it is not possible to obtain similar measurements in the H and K lines since no filters with a comparable width exist in this wavelength range, and it is difficult to obtain spectroheliograms with similar spatial or temporal resolution. Therefore, we compare the observations in these two lines by attempting to replicate the Ca II K filtergram images from the spectrally resolved Ca II 854.2 data.
3.1 “Synthetic” Ca II 854.2 filtergrams
We introduce a “synthetic spectral filter” that, once applied to the Ca II 854.2 spectra, provides a diagnostic as close as possible to that of the K data. We adopted two criteria for the construction of this synthetic filter: 1 – that it have the same spectral shape as the Halle filter, namely a sync function with a large central peak and secondary transmission orders that introduce signal from the far wings; 2 – that the run with height of the response function to temperature variations for the two Ca II lines, once convolved with the respective filter passbands, is as similar as possible. To this end, we synthetised both spectral lines in the static 1-D FALC model of the quiet solar atmosphere (Fontenla et al. 1991). The best match for the temperature response function was obtained when using a sync function of 0.04 nm FWHM, centered at 0.025 nm from the core of the line. Fig. 3 shows the response functions obtained in this case, for the K line (solid) and the 854.2 line (dashed). Using a broader passband for the Ca II 854.2 synthetic filter would move the peak of the temperature response function to much deeper layers, while positioning it further towards the core of the line would increase the chromospheric contribution (heights above 800–900 km) well above the Ca II K case. Although our choice of filter function is dictated by the hydrostatic FAL model, this conclusion would not change much if we would have taken snapshots from chromospheric dynamics simulations as a template, since the source function of the Ca II 854.2 line is strongly dominated by the K line (Uitenbroek 1989), and the response functions of the two lines would change in similar fashion.
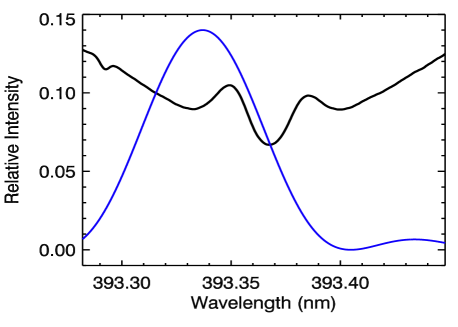
Fig. 1 shows both spectral lines, together with the spectral passband of the respective filters (the actual passband of the Halle filter for Ca II K, and the “synthetic” passband for Ca II 854.2). The top panel further displays the actual IBIS passband at this wavelength, as well as the spectral positions at which the line was sampled during the observations. The spectral range plotted for each of the two lines is proportionate to their wavelength, showing how the position of the K2V and K2R features in the Ca II K line correspond to the “knees” of 854.2 line. Uitenbroek (1989) illustrates this scaling and the behavior of the corresponding line source functions in a quiet-Sun model atmosphere (his Figure 2).
We then summed the monochromatic images obtained with IBIS after applying the relative weighting given by the synthetic spectral filter described above in order to generate “synthetic filtergrams” for the 854.2 line. Only 3% of the total filter transmission lay outside of the range of the IBIS spectral scan and was not included in the construction of the filtergrams.
3.2 Spatial smearing
Both the long exposure times of the Ca II K data (compounded by the worse seeing at shorter wavelengths), as well some astigmatism introduced by the Halle filter produce a loss of spatial resolution in the K images with respect to the IBIS data. The magnitude of the optical degradation was estimated by comparing the images of the reference grids taken in the two lines. The additional seeing degradation for the K data has been estimated by analyzing the spatial profile in the Ca II K images of the sharpest bright features visible in the wings of 854.2, that correspond to isolated magnetic elements. The composite smearing can be effectively described by an asymmetric 2-D Gaussian with widths of 1.0 and 1.6 arcseconds along the two orthogonal axes of the distribution. The Ca II 854.2 synthetic filtergrams were then convolved with this PSF to produce spatially smeared images.
3.3 Radiation temperature


The intensity variations in the two Ca II lines reflect the different sensitivity to velocity, density and temperature variations, the latter mostly due to the different slope of the Planck function at the two different wavelengths. In order to partially account for this effect, we translated the intensity maps into radiation temperature maps, normalizing all the images to the spatio-temporal average intensity over the entire data sets. The radiation temperature corresponding to the average intensity has been derived from the line profiles calculated in the FALC model, after convolution with the spectral transmission profiles, and corresponds to 4540 and 4600 K for the Ca II K and 854.2, respectively. The close match between these two average radiation temperatures indicates that our choice of synthetic filter for the Ca II 854.2 as derived from the temperature response functions line was indeed proper. The final result is displayed in Fig. 4 showing the radiation temperature map obtained for the observed K filtergram (left) and the synthetic 854.2 filtergram (right), at the same temporal step of Fig. 2. The overplotted symbols represent the same features as in Fig. 2. The Ca II K filtergram now shows smaller amplitude excursions than that of the synthetic Ca II 854.2 filtergram, because the former is much less sensitive to the intensity variations induced by the Doppler effect. Indeed, the small spectral features in the core of the Ca II H and K lines (e.g. K and K) create multiple crosstalk signatures of opposite sign that tend to cancel when summed together by the spectral transmission profile, rendering filtergrams in these lines highly insensitive to such crosstalk. The more classical absorption profile of Ca II 854.2 (at least for an averaged atlas profile) shows a significant velocity crosstalk signature even after taking into account the synthetic filter profile (also because it happens to be narrower than the Ca II K filter). Taking into account also the increased amplitude of the Doppler shifts at longer wavelengths, the Ca II 854.2 nm synthetic filtergrams are four times more sensitive than the Ca II K filtergrams to typical chromospheric velocities.
4 Results
4.1 Temporally Averaged Images
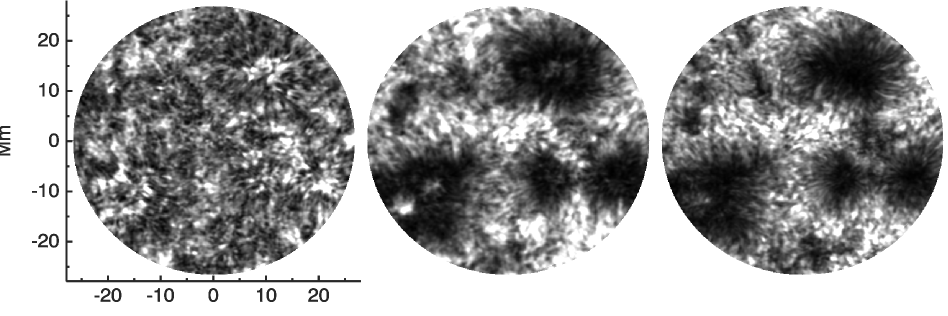
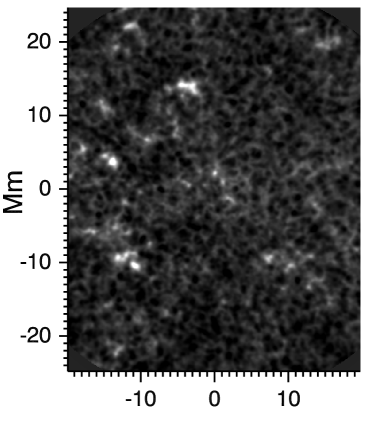
In Figure 5, we display the time-averaged radiation temperature maps for the Ca II 854.2 synthetic filtergrams, the Ca II K filtergrams, and the Ca II 854.2 line minimum intensity. This latter is derived from the position of the core as determined for each spectral profile and removes any effects of velocities in the conversion to the radiation temperature.
The average Trad map for the line minimum still shows a wealth of resolved, darker fibrils surrounding the extended bright network, even in this one hour average. Some of the regions of intermediate intensity (primarily at the top and bottom of the field) indicate the fibril-free portions of the internetwork (see Paper II for further details).
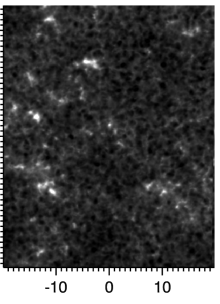
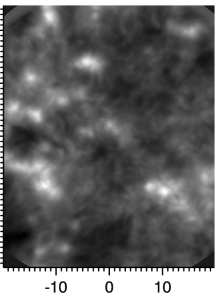
The image of the temporally averaged Ca II 854.2 synthetic filtergrams also shows the bright network surrounded by darker regions of fibrils, though their extent is smaller. The dark streaks surrounding the network are the result of the strong velocity crosstalk from the upflows arising from the base of the chromospheric fibrils.
In the middle image showing the averaged filtergram again the most obvious features are the areas of bright network outlining the magnetic field concentrations. In this image, individual fibrils are not obviously visible, but the network is surrounded by darker regions that correspond closely to the fibril-dominated areas in the Ca II 854.2 image. This indicates that the signature of the fibrils may be present in the Ca II K filtergrams, even if they are not always resolved as individual structures due to the various effects described above.
4.2 Power maps
Since Ca II K images are often used for studies of chromospheric dynamics using Fourier and other temporal analysis, it is important to understand to what extent the chromospheric behavior is encoded in such filtergrams. We therefore compare the Fourier power of the intensity signals in several different frequency bands.
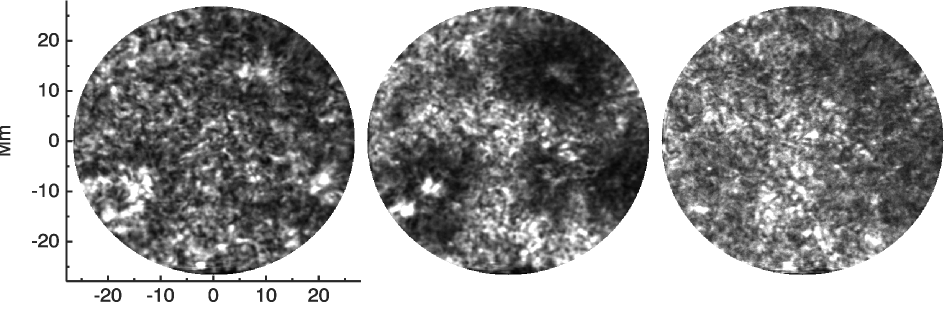
For each time sequence of radiation temperature maps, we calculate the Fourier power of the temperature modulation, separately for each spatial pixel in the FOV. We normalize by the mean intensity in each pixel in order to evaluate the modulation power (see de Wijn et al. 2005b). We then integrate the power over each of three ranges of frequencies: 1.8–4 mHz; 4–7.5 mHz; and 7.5–15 mHz. The calculated power maps are shown in Figure 6 for the Ca II 854.2 line minimum intensity (first row), the 854.2 synthetic filtergrams (second row), and the Ca II K filtergrams (third and fourth row).
Our “pure” chromospheric indicator, the 854.2 line core minimum intensity, shows a relative enhancement of the power in the magnetic network in the five-minute regime and the suppression of the three-minute oscillations in the fibrils surrounding the network (the “magnetic shadows”, see Judge et al. 2001). This is consistent with the behavior found by Vecchio et al. (2007, 2008) in the chromospheric velocities for this same dataset.
The same power maps generated using the Ca II 854.2 synthetic filtergrams and the Ca II K filtergrams show comparable behavior in the five-minute and three-minute bands, with similar spatial distributions of enhanced and suppressed power. There are some interesting differences between various power maps, such as clearer enhancement of the five-minute power in the network in the Ca II K filtergrams as compared to the Ca II 854.2 synthetic filtergrams.
We also note that the shadows are more spatially limited and less pronounced in the both of the filtergram power maps as as compared to the Ca II 854.2 line minimum power maps. Using the regions defined in Reardon et al. (2008), we find that the relative modulation power in the fibril region is reduced by a factor of six relative to the internetwork power in the line core intensities, while the equivalent reductions in the Ca II 854.2 synthetic filtergrams and the Ca II K filtergrams are only a factor of five and three, respectively. This shows that the signature of fibrils remains very clear in the power maps for the Ca II K filtergrams, even if they are not visible in the individual intensity images.
The most striking difference in Fig. 6 is in the high-frequency regime, where magnetic shadows are still present in the power maps calculated for both the line minimum intensity and synthetic filtergrams but are almost nonexistent in the Ca II K power map. We test whether this lack of clear fibril signature might be due to a lower signal-to-noise ratio in the Ca II K filtergrams or perhaps caused by the irregular temporal sampling of the Ca II K sequence (in order to match them to the closest 854.2 scan). We calculate the same power maps using the full sequence of 1576 Ca II K images (bottom row in Fig. 6) taken with a regular two-second cadence. The shadows are only marginally more visible in this case and the overall resemblance to the chromospheric power maps derived from the Ca II 854.2 line core intensity is still poor. It appears that at higher frequencies the Ca II K filtergrams do not accurately represent the behavior of the chromosphere itself. We note that Cram (1978), using a slit spectrograph, observed a similar decreased in the high-frequency power in the Ca II K K intensity, even though the Ca II 854.2 nm line core intensity fluctuations remained significant. This perhaps indicates the lack of high-frequency power is due to a line-formation effect, such as the increased opacity of Ca II K leading to contributions over a larger range of heights, resulting in the cancellation of high-frequency oscillations with a mixtures of phases throughout the contribution region.
4.3 Hinode/SOT Ca II H Filtergrams
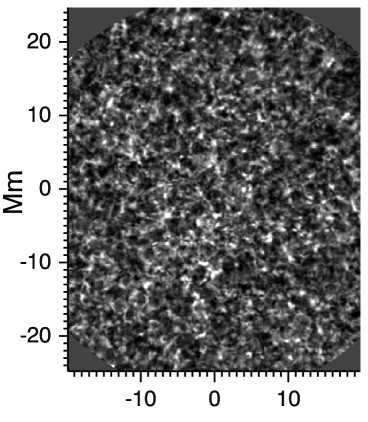
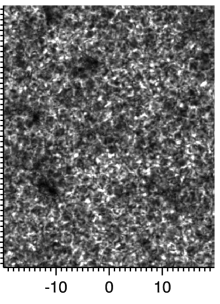
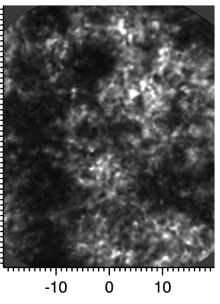
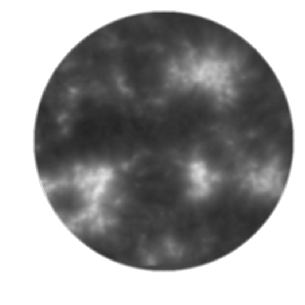
Having identified ways to extract the presence of a chromospheric signal in time series of filtergrams, we apply these techniques to a sequence of Ca II H filtergrams obtained with Hinode/SOT (Kosugi et al. 2007; Tsuneta et al. 2008). We use a different data set, acquired on April 18, 2007 taken near disk center in an equatorial coronal hole We select a one hour interval of simultaneous observations from 16:39 - 17:38 UT. in which we obtained 500 scans of the Ca II 854.2 line with IBIS while the SOT/BFI acquired 176 Ca II H filtergrams. Because the filter has a FWHM of 0.22 nm, we are not able to apply a similar synthetic filter to the IBIS data because of the limits of the spectral coverage. We compute instead the average intensity for the Ca II H filtergrams as well as for the Ca II 854.2 line core minimum intensity and at a position in the 0.075 nm in blue wing of the line (formed in the middle photosphere at an average height of 250 km). As seen in Fig. 7, the Ca II 854.2 line wing and Ca II H images are strikingly similar and the averaged SOT filtergram shows no presence of the chromospheric structures seen in the line core image.
As a further test, we also calculated the three-minute power maps in the same way as in Sec 4.2 for the Ca II H filtergrams as well as the Ca II 854.2 line core and line wing. Even in this very quiet region the magnetic shadows are again clearly visible in the line core intensity power, but there is almost no trace of them in the Ca II H power maps. The Ca II power map is highly similar, even in the small details, to the photospheric power map derived from the wing of the line. Observing on the solar disk, such a broad filter apparently captures very little of the chromospheric dynamics.
5 Conclusions
In this Paper we examine the causes of the very different appearance of on-disk filtergrams obtained with the Ca II H or K lines and those that use other chromospheric lines such as H and Ca II 854.2. Given the widespread use of filtergrams in investigations of the solar atmosphere, it is important to ask to what extent these kind of data actually represent the structure and behavior of the chromosphere.
We used a series of repeated imaging spectral scans through the Ca II 854.2 line in the quiet chromosphere with IBIS and compared them with a simultaneous sequence of Ca II K filtergrams. Our main conclusion is that the lack of well defined chromospheric features in the filtergrams, such as fibrils and mottles, is essentially due to observational limitations. We confirmed this by generating synthetic Ca II “filtergrams” by applying a suitably chosen simulated filter profile to the spectrally resolved 854.2 images. Both the observed Ca II K and synthetic Ca II 854.2 intensities were then transformed into radiation temperature, in order to partially account for the different sensitivity of the Planck function at the vastly different wavelengths of the two lines.
A filter results in the summing of contributions in different points throughout a line profile. This is particularly important in the Ca II H or K lines given the widths of the filters presently available and the broad range of heights over which the line is formed. Using the nominal shape and position of the Halle filter spectral transmission, we derived the temperature response function for the Ca II K line in the reference FALC static atmosphere, and showed that it has a broad contribution with a peak at around 400 km, but equally spanning from the deep photosphere ( 100 km) to the middle chromosphere ( 800 km). This effect has long been known and has also been recently investigated by Carlsson et al. (2007) in a study of high frequency acoustic waves in the quiet chromosphere. They performed a similar calculation for the Ca II H filter on Hinode/SOT (with a 0.22 nm FWHM) and found an average response height of 250 km, with a weaker, broad contribution extending up to 600 km. We confirm this by direct comparison of SOT Ca II H images with images from different positions in the Ca II 854.2 line profile and further show that there is negligible chromospheric signature in the quiet-Sun images taken with the Ca II H filter on SOT.
This summing of contributions results in many chromospheric structures being “swamped” by the stronger photospheric signals from the wings of the line. Dark structures, such as fibrils and filaments, may be most strongly affected by this mixing, since their contribution becomes increasingly negligible compared to the that from the wings of the lines. Brighter chromospheric structures instead tend to persist, especially magnetic structures which show relative brightness enhancement both at chromospheric heights as well as at the mid-photospheric regions that make a significant contribution to the overall filtergram intensity. This explains many of the typical characteristics of Ca II H and K filtergrams: the bright network is clearly defined, but only traces of the strongest chromospheric fibrils are seen. Away from the magnetic network, the filtergrams contain a mixture of the reversed granulation arising from the mid-photosphere, enhancements caused by small internetwork magnetic elements, and the intermittent brightenings due to acoustic events in the chromosphere. There is no way to distinguish whether a brightening observed in a Ca II H or K filtergram is of chromospheric or photospheric origin.
Our results are noteworthy for at least two reasons: first, we prove that this effect is important even for the narrowest available K filters ( 0.05 nm FWHM); and second, we do so by direct comparison with the features observed in a subordinate Ca II line directly related to the resonance lines. No chromospheric model is yet capable of reproducing the spectral characteristics of magnetic features in the quiet atmosphere.
Beyond the effect of the filter transmission profile, there is additional degradation of the chromospheric signal in the Ca II filtergrams due to other observational effects. The decreased spatial resolution in the Ca II filtergrams compared to the Ca II 854.2 images can be explained by the significantly longer exposure time for the filtergrams (due to a combination of dropoff of the Planck function, reduced atmospheric transparency, low filter transmission, and decreased detector efficiency) and the worsening of the atmospheric seeing at the blue wavelengths. There are still differences between the observed and synthetic filtergrams, primarily the greater visibility of the chromospheric fibrils in the Ca II 854.2 filtergrams. This is due in large part to the factor of four increase in the velocity-to-intensity crosstalk in the Ca II 854.2 synthetic filtergrams due to the narrower filter profile, the different shapes of the two underlying line profiles, and the increased magnitude of the Doppler shift at the longer wavelength.
However, even if not immediately visible, the Ca II K filtergrams do contain several signatures of the chromospheric fibrils. These appear more obvious when taking into account the temporal evolution. Temporally averaged filtergrams show a slightly decreased intensity surrounding the network magnetic patches corresponding to the location of the chromospheric fibrils seen the the Ca II 854.2 line core.
An additional chromospheric signature is the presence of the “magnetic shadows” (Judge et al. 2001) in the map of three-minute Fourier power derived from the modulation of the radiation temperature in the Ca II K filtergrams. These shadows are similar to those seen in the analogous power maps derived from the Ca II 854.2 line core intensities, but with a more limited spatial extent and an amplitude reduced by one half. Since these shadows correlate with the presence of the chromospheric fibrils (Vecchio et al. 2007), this indicates that the presence of the fibrils can be extracted in the overall time series of filtergrams. Such properties can be understood in terms of the different temporal variability of the various chromospheric components, and in particular, to the fact that fibrils present the least intensity (radiation temperature) changes (Paper II).
It is also important to note that the Ca II K filtergrams display little of the structuring seen in the power maps at higher frequencies using the Ca II 854.2 line. In the range 7.5–15 mHz, the map produced from Ca II 854.2 line core intensity variations shows a continued dependence on the chromospheric fibril structures, with the magnetic shadows still prominent. In the maps in the same frequency range from the Ca II K filtergrams this chromospheric signature is almost completely absent. This indicates that on-disk filtergrams in the Ca II H and K lines, even with relatively narrow filter, may not be suitable for investigation of the high-frequency behavior of the chromosphere.
Based on the above discussions, it would appear that the picture given by the H and Ca II 854.2 lines, with significant portions of the chromosphere being dominated by magnetic structuring, represents the true nature of the chromosphere. As a corollary, on-disk images that don’t show evidence of such structuring, even in the quiet Sun, cannot be said to realistically portray the chromospheric conditions. We expect that images in Ca II H and K lines taken with higher spatial and spectral resolution will show a silmilar wealth of fibrillar structures (Pietarila et al. 2008). In the absence of such data, and given the observational advantages of working at longer wavelengths (with the one drawback of decreased spatial resolution), the Ca II 854.2 nm line represents an excellent chromospheric indicator.
Acknowledgements.
The authors are grateful to the DST observers D. Gilliam, M. Bradford and J. Elrod, whose patience and skills are greatly appreciated. We thank Rob Rutten for insightful discussions on the presence and visibility of fibrils in Ca II K. IBIS was built by INAF–Osservatorio Astrofisico di Arcetri with contributions from the Università di Firenze and the Università di Roma Tor Vergata . Further support for IBIS operation was provided by the Italian MIUR and MAE, as well as NSO. NSO is operated by the Association of Universities for Research in Astronomy, Inc. (AURA), under cooperative agreement with the National Science Foundation. This research has made use of NASA’s Astrophysics Data System (ADS). Hinode is a Japanese mission developed and launched by ISAS/JAXA, with NAOJ as domestic partner and NASA and STFC (UK) as international partners. It is operated by these agencies in co-operation with ESA and NSC (Norway).References
- Beckers (1964) Beckers, J. M. 1964, PhD thesis, , University of Utrecht (AFCRL-Environmental Research Paper, No.49), (1964)
- Bumba & Howard (1965) Bumba, V. & Howard, R. 1965, Astrophysical Journal, 141, 1492
- Carlsson et al. (2007) Carlsson, M., Hansteen, V. H., de Pontieu, B., et al. 2007, PASJ, 59, 663
- Cauzzi et al. (2008) Cauzzi, G., Reardon, K. P., Uitenbroek, H., et al. 2008, A&A, 480, 515
- Cavallini (2006) Cavallini, F. 2006, Sol. Phys., 236, 415
- Cheung et al. (2007) Cheung, M. C. M., Schüssler, M., & Moreno-Insertis, F. 2007, A&A, 461, 1163
- Cram (1978) Cram, L. E. 1978, A&A, 70, 345
- De Pontieu et al. (2007) De Pontieu, B., McIntosh, S. W., Carlsson, M., et al. 2007, Science, 318, 1574
- de Wijn et al. (2005a) de Wijn, A. G., Rutten, R. J., Haverkamp, E. M. W. P., & Sütterlin, P. 2005a, A&A, 441, 1183
- de Wijn et al. (2005b) de Wijn, A. G., Rutten, R. J., & Tarbell, T. D. 2005b, A&A, 430, 1119
- Ermolli et al. (1998) Ermolli, I., Berrilli, F., Florio, A., & Pietropaolo, E. 1998, in Astronomical Society of the Pacific Conference Series, Vol. 140, Synoptic Solar Physics, ed. K. S. Balasubramaniam, J. Harvey, & D. Rabin, 223–+
- Fontenla et al. (1991) Fontenla, J. M., Avrett, E. H., & Loeser, R. 1991, ApJ, 377, 712
- Janssen & Cauzzi (2006) Janssen, K. & Cauzzi, G. 2006, A&A, 450, 365
- Judge et al. (2001) Judge, P. G., Tarbell, T. D., & Wilhelm, K. 2001, ApJ, 554, 424
- Katsukawa et al. (2007) Katsukawa, Y., Berger, T. E., Ichimoto, K., et al. 2007, Science, 318, 1594
- Kosugi et al. (2007) Kosugi, T., Matsuzaki, K., Sakao, T., et al. 2007, Sol. Phys., 243, 3
- Leenaarts et al. (2006) Leenaarts, J., Rutten, R. J., Sütterlin, P., Carlsson, M., & Uitenbroek, H. 2006, A&A, 449, 1209
- Nagashima et al. (2007) Nagashima, K., Sekii, T., Kosovichev, A. G., et al. 2007, PASJ, 59, 631
- Pietarila et al. (2008) Pietarila, A., Hirzberger, J., Zahkarov, V., & Solanki, S. 2008, European Solar Physics Meeting 12, http://espm.kis.uni-freiburg.de/
- Reardon et al. (2007) Reardon, K. P., Cauzzi, G., & Rimmele, T. 2007, in Astronomical Society of the Pacific Conference Series, Vol. 368, The Physics of Chromospheric Plasmas, ed. P. Heinzel, I. Dorotovič, & R. J. Rutten, 151–+
- Reardon & Cavallini (2008) Reardon, K. P. & Cavallini, F. 2008, A&A, 481, 897
- Reardon et al. (2008) Reardon, K. P., Lepreti, F., Carbone, V., & Vecchio, A. 2008, ApJ, 683, L207
- Rimmele (2004) Rimmele, T. R. 2004, in Presented at the Society of Photo-Optical Instrumentation Engineers (SPIE) Conference, Vol. 5490, Advancements in Adaptive Optics. Edited by Domenico B. Calia, Brent L. Ellerbroek, and Roberto Ragazzoni. Proceedings of the SPIE, Volume 5490, pp. 34-46 (2004)., ed. D. Bonaccini Calia, B. L. Ellerbroek, & R. Ragazzoni, 34–46
- Rutten (2007) Rutten, R. J. 2007, in Astronomical Society of the Pacific Conference Series, Vol. 368, The Physics of Chromospheric Plasmas, ed. P. Heinzel, I. Dorotovič, & R. J. Rutten, 27–+
- Rutten & Uitenbroek (1991) Rutten, R. J. & Uitenbroek, H. 1991, Sol. Phys., 134, 15
- Socas-Navarro et al. (2006) Socas-Navarro, H., Elmore, D., Pietarila, A., et al. 2006, Sol. Phys., 235, 55
- Tritschler et al. (2007) Tritschler, A., Schmidt, W., Uitenbroek, H., & Wedemeyer-Böhm, S. 2007, A&A, 462, 303
- Tsuneta et al. (2008) Tsuneta, S., Ichimoto, K., Katsukawa, Y., et al. 2008, Sol. Phys., 249, 167
- Tziotziou et al. (2006) Tziotziou, K., Tsiropoula, G., Mein, N., & Mein, P. 2006, A&A, 456, 689
- Uitenbroek (1989) Uitenbroek, H. 1989, A&A, 213, 360
- Uitenbroek (2006a) Uitenbroek, H. 2006a, in Astronomical Society of the Pacific Conference Series, Vol. 354, Solar MHD Theory and Observations: A High Spatial Resolution Perspective, ed. J. Leibacher, R. F. Stein, & H. Uitenbroek, 313–+
- Uitenbroek (2006b) Uitenbroek, H. 2006b, ApJ, 639, 516
- Vecchio et al. (2008) Vecchio, A., Cauzzi, G., & Reardon, K. P. 2008, A&A, in press (arXiv:0807.4966)
- Vecchio et al. (2007) Vecchio, A., Cauzzi, G., Reardon, K. P., Janssen, K., & Rimmele, T. 2007, A&A, 461, L1
- Wöger et al. (2006) Wöger, F., Wedemeyer-Böhm, S., Schmidt, W., & von der Lühe, O. 2006, A&A, 459, L9