The 6-GHz Multibeam Maser Survey I. Techniques
Abstract
A new 7-beam 67 GHz receiver has been built to survey the Galaxy and the Magellanic Clouds for newly forming high-mass stars that are pinpointed by strong methanol maser emission at 6668 MHz. The receiver was jointly constructed by Jodrell Bank Observatory (JBO) and the Australia Telescope National Facility (ATNF) and allows simultaneous coverage at 6668 and 6035 MHz. It was successfully commissioned at Parkes in January 2006 and is now being used to conduct the Parkes-Jodrell multibeam maser survey of the Milky Way. This will be the first systematic survey of the entire Galactic plane for masers of not only 6668-MHz methanol, but also 6035-MHz excited-state hydroxyl. The survey is two orders of magnitude faster than most previous systematic surveys and has an rms noise level of 0.17 Jy. This paper describes the observational strategy, techniques and reduction procedures of the Galactic and Magellanic Cloud surveys, together with deeper, pointed, follow-up observations and complementary observations with other instruments. It also includes an estimate of the survey detection efficiency. The 111 days of observations with the Parkes telescope have so far yielded 800 methanol sources, of which 350 are new discoveries. The whole project will provide the first comprehensive Galaxy-wide catalogue of 6668-MHz and 6035-MHz masers.
keywords:
stars: formation, Masers, Surveys, (galaxies:) Magellanic Clouds1 Introduction
The theory and understanding of the formation of high-mass stars is a fundamental unsolved problem in astronomy. Current star formation models encounter difficulties in creating stars much more massive than 8 M⊙ (e.g. Keto, 2003; Yorke, 2004) and observations of these events are hampered by the speed with which the process occurs, and hence the relative rarity of objects in the act of accreting the majority of their final mass. However, since its discovery (Menten, 1991), the 6668-MHz methanol maser has been recognised as one of the clearest signposts to the formation of high-mass young stars. It is the second strongest cosmic maser known, surpassed only by water (H2O) at 22 GHz. The 6668-MHz methanol maser is widespread and, unlike all other strong masers (OH, H2O and SiO), is only found close to high-mass young stars (e.g. Minier et al., 2003) and sometimes associated with ultra compact (UC) Hii regions. Additionally, the methanol masers may trace earlier hot core phases (e.g. Minier et al., 2005; Purcell et al., 2006), although recent kinematic work by van der Walt et al. (2007) argues otherwise. It is possible that heating of the hot molecular core, or shock heating from an outflow liberates methanol from dust mantles and so provides the high column density needed to give strong maser action (Cragg et al., 2002; Codella et al., 2004).
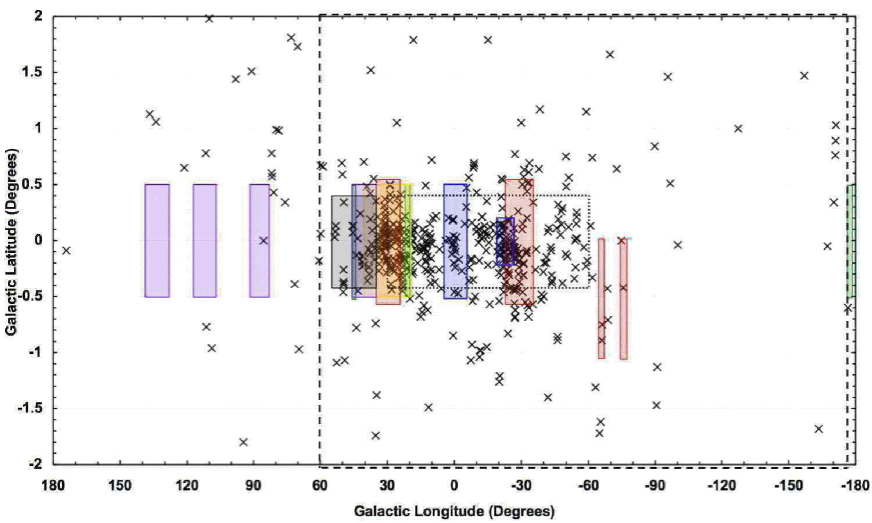
During the past decade, extensive 6668-MHz methanol maser searches have been undertaken in our Galaxy using two different strategies: (1) targeted searches toward colour–selected infrared (IR) sources and known regions of intense star formation (e.g. OH and H2O masers); (2) unbiased surveys covering portions of the Galactic plane in both the northern and southern hemispheres. These methods have yielded different results in terms of detection statistics. Except for the first targeted survey by Menten (1991) and the survey of OH maser positions by Caswell et al. (1995) (with success rates exceeding 80 per cent, and further augmented by the discovery of offset and clustered maser sites), other targeted methanol maser searches have produced detection rates of about 15 per cent (MacLeod et al., 1992; MacLeod & Gaylard, 1992; Gaylard & MacLeod, 1993; Schutte et al., 1993; van der Walt et al., 1995; van der Walt et al., 1996; Walsh et al., 1997; Slysh et al., 1999; Szymczak et al., 2000; Ellingsen, 2007). Generally, the targeted surveys were restricted to known or suspected sites of star formation and missed masers arising in regions where they were not expected. The unbiased searches have produced detection rates lying between 0.22 sources degree-2 (Pestalozzi, Minier & Booth, 2005) and more than 10 sources degree-2 (Caswell, 1996b, a; Ellingsen et al., 1996). A total of 140 degree2 have been surveyed to date. This includes a region of 16 degree2 in the first Galactic quadrant which have been covered in several unbiased surveys (as evident in Table 3 of Pestalozzi et al. 2005). More than 500 sources are listed in the compilation of 6668-MHz methanol sources by Pestalozzi et al. (2005). Fig. 1 shows how these masers are distributed in the Galaxy (for ).
Almost 50 per cent of the detected objects of the untargeted surveys of Ellingsen et al. (1996) and Szymczak et al. (2002) had no previously known counterpart, clearly showing the limitation of targeted observations. In both samples, possible counterparts to the masers have a wide range of infrared colours, with many conspicuously falling outside the UC Hii region IRAS selection criteria of Wood & Churchwell (1989). Therefore, any survey based solely upon long-wavelength infrared colour selection criteria is likely to underestimate the number of masers, and searches using targets based on mid-infrared colour-selected sources of the Spitzer Galactic Legacy Infrared Mid-Plane Survey Extraordinaire (GLIMPSE) infrared survey (Ellingsen, 2007) also seem to be inefficient.
On the other hand, the existing unbiased surveys are deficient because of their incomplete Galactic coverage and heterogeneous sensitivity limits. A recent analysis of the existing surveys suggests that the actual number of methanol masers sources in our Galaxy is about twice that currently known (van der Walt, 2005; Pandian & Goldsmith, 2007). A potential doubling of the number of known young high mass stars clearly has important implications for our view of high-mass star formation in our Galaxy, and provides the opportunity of enhancing our understanding of the nature and origin of 6668-MHz methanol masers.
The only way to determine the actual number of methanol maser sources in the Galaxy, and identify the high-mass star formation regions which they trace, is to carry out a uniform, unbiased survey of the whole Galactic plane. With sufficient sensitivity, such a survey will detect the vast majority of such sources. Since the high brightness of masers allows their positions and velocities to be determined to high precision, such a Galaxy-wide survey will provide an excellent probe of the global distribution of star formation throughout the Galaxy. In addition, the unbiased, homogenous catalogue that such a survey can produce will provide a statistically complete sample for future studies of the early stages of high-mass star formation.
2 The MMB Galactic Plane Survey
The need for a new survey of the Galactic Plane for the 6668-MHz methanol masers led to the development of the Methanol Multibeam (MMB) survey. The survey goal is to produce a high-reliability unbiased survey of 6668-MHz methanol masers in the Galactic plane, with a uniform sensitivity completeness. It will allow a complete census of the high-mass star formation taking place in our Galaxy. In this way, and in combination with other Galaxy-wide surveys, it will be possible to accumulate the statistics necessary to determine the relative lifetimes of the various stages of high-mass star formation, and hence be able to build an empirical model of the evolutionary process. This paper and its forerunner (Green et al., 2008) represent the first two in a series on the MMB survey, soon to be followed by the first Galactic results.
2.1 Survey Parameters
To cover the whole Galactic plane in longitude the MMB team has used the Parkes 64-m radio telescope in the southern hemisphere and currently plans to use the Lovell 76-m radio telescope at Jodrell Bank in the northern hemisphere. The survey area has been split, with longitudes 174∘ 60∘ observed from Parkes and 60∘ 186∘ planned for the northern hemisphere observations.
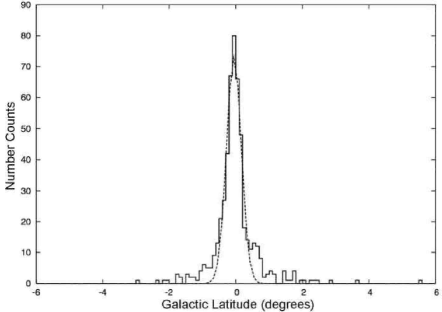
The latitude distribution of methanol masers in the Pestalozzi et al. (2005) compilation has a FWHM of 0.5∘ (Fig. 2), but shows quite broad wings. Also, there is the warp of the Galactic plane, clearly delineated by HI and continuum observations (e.g. Burton, 1976; Dickey & Lockman, 1990; Russeil, 2003). The importance of the warp has been reinforced by the latest molecular cloud surveys which reveal CO clouds in the outer Galaxy more than 1 kpc from the midplane (e.g. Mizuno & Fukui, 2004). Furthermore, Infrared Dark Clouds (IRDCs) detected by the Midcourse Space Experiment (MSX), and recognised as potential star formation regions in their early stages (Carey et al., 2000), have up to 50 per cent of their population outside . Taking these factors into account and balancing them against feasible observing time-scales, we adopted a latitude range of . For the Pestalozzi et al. (2005) compilation 14 sources lie outside this region (four in the inner Galaxy, within 60 degrees of the Galactic centre, and ten in the outer Galaxy).
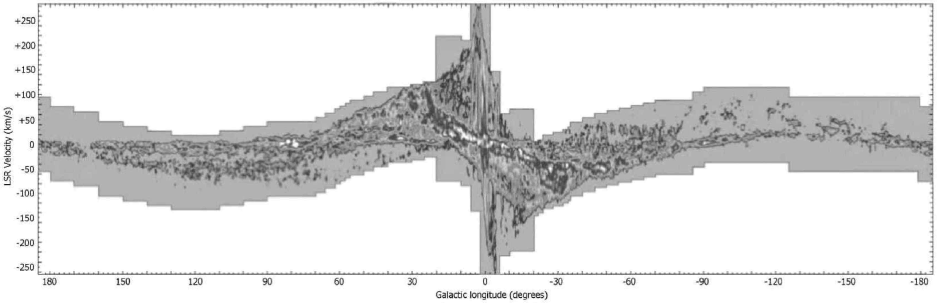
The velocities of the molecular clouds in which the 6668-MHz methanol masers reside are well traced by the emission from the CO molecule. Thus fully sampling the observed velocity spread of CO emission is expected to adequately cover the range of velocities exhibited by 6668-MHz methanol masers (Section 3.3). This velocity coverage is a function of Galactic longitude and is shown on Fig. 3 overlaid on the position-velocity plot of the CO emission from Dame et al. (2001).
The targeted 1 noise level of the MMB survey was 0.2 Jy. This is similar to the deepest previous unbiased surveys which have had 1 sensitivities of between 0.09 Jy and 1 Jy (see Pestalozzi et al. 2005 and Pandian et al. 2007 for details). From the estimates of van der Walt (2005) a 3 threshold at 1 Jy should detect between about 75 and 90 per cent of the total methanol maser population.
Previous surveys with single dish telescopes, such as that of Caswell et al. (1995), have shown that often the emission from several different methanol sources can be blended within the beam. Additionally, the uncertainties in the positions derived from single dish observations at these frequencies are too large to make effective associations and to identify counterparts at other wavelengths. Therefore an integral component of the MMB survey has been to determine the positions of the masers detected in the single dish survey with sub-arcsecond accuracy using interferometer observations.
For the Parkes detections which had not previously been observed at higher angular resolution, we are observing them with the Australia Telescope Compact Array (ATCA), and where possible the Multi Element Radio Linked Interferometer Network (MERLIN); the latter, in addition to its ability to observe sources near declination zero and further north, has the advantage of even higher resolution (15 mas rms position uncertainty when taking into account the systematic error of the phase calibration together with the individual relative position errors).
2.2 A Parallel Survey for Excited OH Masers
The 1-GHz bandwidth of the MMB receiver provided the opportunity to survey the Galactic plane in an excited transition of OH simultaneously with the methanol survey. Often seen in association with 6668-MHz methanol, the 6035-MHz ( J = 5/2, F = 33) excited-state OH maser was first detected in the late-1960s / early-1970s (e.g. Yen et al., 1969; Rydbeck et al., 1970; Zuckerman et al., 1972; Knowles et al., 1973). After a number of small-scale targeted observations (Knowles et al., 1976; Guilloteau et al., 1984), an extensive search by Caswell & Vaile (1995) detected 72 sources (of which 52 were new to that survey). Currently sources are known (Caswell, 1997, 2003). This maser’s susceptibility to Zeeman splitting can provide additional insight into the magnetic fields present at sites of high-mass star formation.
2.3 The Methanol Multibeam Receiver
To make the MMB survey feasible required a new purpose-built multibeam receiver system, prompting construction of a new 7-beam receiver jointly by Jodrell Bank Observatory (JBO) and the Australia Telescope National Facility (ATNF). The receiver comprises seven dual circular polarization feeds, arranged in a hexagonal pattern around the central feed (Fig. 4). It incorporates low noise indium-phosphide High Electron Mobility Transistor (HEMT) amplifiers, which provide a 1-GHz bandwidth. A 500-Hz switched noise diode is available for continuous calibration in the presence of varying incoming power levels. The receiver system is mounted at prime focus. Rotation of the receiver package is required to track parallalactic angle, necessitating a complex arrangement of flexible cabling for the 28 receiver outputs and the helium cooling lines.
3 Multibeam Observational Systems and Analysis
3.1 MMB Survey Techniques
The complete MMB survey will cover the full Galactic plane, l 180∘ with a latitude range of 2∘. In this paper we focus on the southern Galactic plane portion of the survey using the Parkes 64-m telescope; the planned northern hemisphere extension will adopt a similar strategy. For the Parkes survey region of 174∘ l 60∘, the area observed was divided into blocks of 2∘ longitude by 4∘ latitude. Adjacent blocks have no overlap, and in the final reduction are combined seamlessly. The observing parameters are summarised in Table 1.
For the Parkes MMB receiver configuration, adjacent beams are separated by 6.46 arcmin. The FWHM of each beam is 3.2 arcmin at 6668 MHz and 3.4 arcmin at 6035 MHz. The width of the total multibeam footprint is 15 arcmin. For this hexagonal feed configuration, an orientation at an angle of 19.1∘ to the scan direction (the plane of the Galaxy, see Fig. 4) maintains equally spaced tracks for the seven beams (Condon, Broderick & Seielstad, 1989).
Scans were conducted across 2∘ in longitude at a rate of 0.1∘ per min, dumping spectra every 5 seconds. The parallactic angle tracking was updated continuously throughout scans. The beams were then displaced by 1.07 arcmin in latitude before scanning back. There was then a larger displacement of 15 arcmin to the next scan pair, thus fully sampling a block of Galaxy of 2∘ in longitude by 4∘ in latitude with 32 scans (16 pairs of forward and backward scans). For each block, a single schedule file for the Parkes Telescope Control System (TCS) was generated to define the paths of the 32 scans. Only one pass was needed as there was minimal radio frequency interference (RFI) at 6668 and 6035 MHz at the Parkes site. The noise equivalent flux density of the system temperature at both 6668 MHz and 6035 MHz was 60 Jy. Averaged across all the observing sessions, this varied by less than 5 Jy between the different beams at each polarization and frequency. Across a 2∘ by 4∘ block, the sensitivity of a final cube generally varies by no more than 3.5 per cent (due to significant oversampling), but is of course worse in the direction of the few continuum sources that are strong enough to significantly increase the system temperature. The pointing accuracy of the Parkes Telescope is typically better than 15 arcseconds.
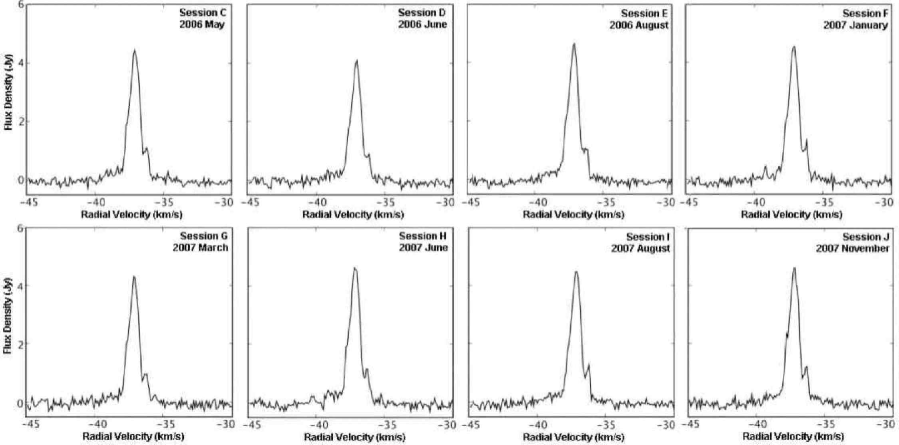
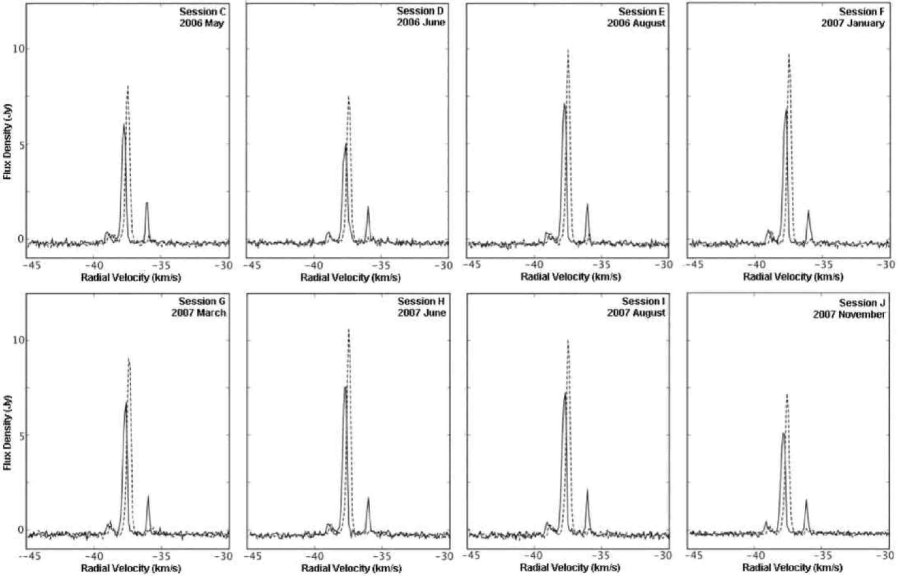
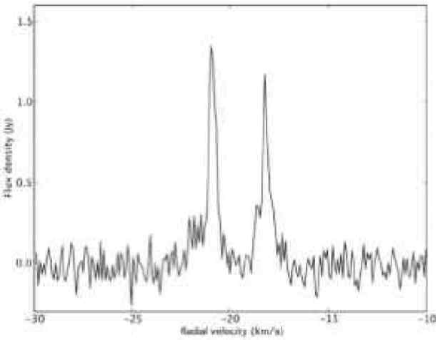
The noise diode is used throughout the survey observations for amplitude calibration. However, its equivalent flux density value is different for each of the 28 recorded channels (7 beams, 2 frequencies, 2 polarizations), and to measure these values, and also check for pointing offsets, the continuum source 1934-638 was observed most days. This used a “SPOT” schedule, which scanned each beam in turn across the source in RA and Dec. 1934-638 was assumed to have a flux density of 3.9 Jy at 6668 MHz and 4.4 Jy at 6035 MHz. Calibration stability was further checked by observing on most days a known maser source using “MX” mode, in which a source was tracked, and the pointing centre cycled through each of the beams. The most commonly used source was G300.969+1.148 for both methanol and excited OH (Fig. 5 and 6). From the repeatability of these measurements we estimate the flux density calibration to be acccurate to a few percent.
The first science run of the MMB occurred at Parkes between 22nd and 31st January 2006. Subsequently a further 101 days spread over the following 22 months (split into ten sessions designated A to J) has yielded a total of 111 days of observations and completed the surveying of the Galactic plane between and .
| Methanol | Hydroxyl | |
| Rest Frequency (MHz) | 6668.519 | 6035.093 |
| Beamwidth (arcmin) | 3.2 | 3.4 |
| Velocity coverage per setting (km s-1) | 180 | 200 |
| Velocity spacing (km s-1) | 0.0875 | 0.0971 |
| Average system noise1 (Jy) | 60.1 | 59.9 |
| Typical survey rms noise2 (Jy) | 0.17 | 0.17 |
| Positional Accuracy (arcsec) | 0.1/0.01 | 0.1/0.01 |
3.2 Targeted Follow-up
In addition to the survey scanning observations, all detections were later observed in pointed observations to provide low noise spectra. These observations tracked the source, cycling the pointing centre through each of the beams (adopting the “MX” mode). These utilised the positions derived from the high-resolution observations described in §4. Each beam was on source for 1 minute, providing an effective integration time of 7 minutes and a 1 noise of 0.1 Jy.
3.3 Multibeam data acquisition system
Spectra were taken using the multibeam correlator and the wideband correlator at Parkes, integrated into a single system. During the first two observing runs, pending some necessary correlator modifications, data were not recorded at 6035 MHz for the right hand circular polarization (RHCP) of three outer beams (2, 4, and 6).
The observing bandwidth was 4 MHz, which corresponds to a velocity range of 180 km s-1 at 6668 MHz (200 km s-1 at 6035 MHz ), but 150 km s-1 was taken as fully usable (and we incorporated a 10 km s-1 overlap for regions with multiple centre velocities). The centre velocities and range for observations were determined from the Galactic CO emission of Dame et al. (2001) (Fig. 3). To fully cover the required velocities there was one setting for ; two for ; three for ; and finally four for .
The two first local oscillators were set to provide Doppler tracking, so that the centre of each 4-MHz band was kept at a constant radial velocity with respect to the kinematic Local Standard of Rest (LSR), for both the methanol and the OH spectral lines. The correlators were configured to provide 2048 frequency channels across each 4-MHz band, at each line frequency and each polarization. Altogether 28 2048-channel spectra were taken every five seconds in normal survey scans. The channel spacing of 1950 Hz corresponds to a velocity spacing of 0.09 km s-1 at 6668 MHz; this provides an effective velocity resolution of 0.11 km s-1, which is sufficient to resolve the narrow maser lines (typically 0.20.3 km s-1 in width). The spectra were not smoothed.
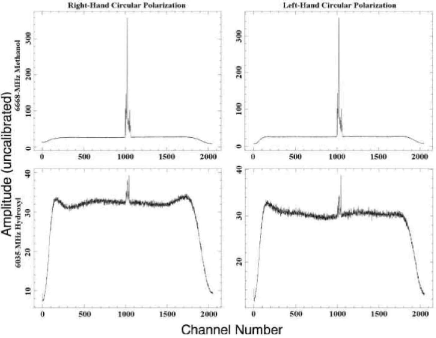
Fig. 7 shows the first light spectra obtained at Parkes on 22nd Jan 2006, with the source G309.921+0.479 in the main beam.
3.4 Multibeam Data Reduction
Initial reduction of the survey data was performed with the program livedata and its sister program gridzilla, developed by Mark Calabretta, for processing of multibeam spectral line data111http://www.atnf.csiro.au/people/mcalabre/livedata.html. The capabilities of this package, and its first use (in the HI Parkes All Sky Survey, HIPASS), have been described extensively by Barnes et al. (2001). While some of our procedures are the same as those used in the HI survey, there are a number of major differences, as we describe here. In particular, we do not encounter interference problems, and have much less need for robust median statistics.
A raw correlator spectrum is a composite of the maser spectrum, bandpass spectrum, noise and potentially, baseline ripples. The bandpass spectrum is the dominant component and was removed through the division of the correlator spectrum by an estimate of the bandpass (reference) spectrum.
An individual reference spectrum is required for each polarization of each frequency for each beam, and is obtained for each 20-minute scan using livedata. Each reference spectrum is formed from the median of the 240 spectra obtained within a scan. If a maser occurs within a scan, it will persist for only 15 of the 240 spectra and thus have negligible influence on the median. The spectra were not smoothed since we do not have features in the spectrum narrower than our resolution (in contrast to the HIPASS survey, for which such features caused serious problems).
Following the bandpass correction, the spectra were calibrated for flux density using the table of values obtained earlier from the noise diode calibration. A fourth order polynomial was then fitted to the baseline, and the first and last 100 edge channels filtered out. The fourth order polynomial provided a 1520 per cent improvement of the systematics over other baseline fits, and was of a low enough order as to not distort any emission or absorption features that may be present.
3.5 Gridding and Imaging
The livedata processing of a 2∘ 4∘ block of correlator data produced 32 scan files of flux density calibrated and bandpass corrected spectral data. Each scan consisted of 240 spectra for each polarization of each beam. The gridzilla package is used to convert the individual spectra into position-position-velocity data cubes. The standard gridding process defines a uniform grid in the observed region and determines how the spectra contribute to a pixel through applying weights which can be chosen to optimise various parameters, such as the signal-to-noise ratio for a point source, the spatial resolution, or minimising susceptibility to interference. A smoothing radius was first chosen to determine which spectra contribute to the pixel. The choice of smoothing radius affects the final gridded beamsize and affects the correlation between pixels and hence the image noise. To balance resolution and positional accuracy with robustness, a top-hat smoothing kernel with a diameter of 4.4 arcmin, and hence a radius cut-off of 2.2 arcmin, was used. Typically, for a total intensity image, 50 spectra contribute to a pixel, 25 from each of the two polarizations. The pixel spacing was chosen to be 1 arcmin so as to be both a convenient value, and somewhat oversampled relative to the Nyquist requirements.
To estimate the flux density at a given pixel, the mean of the contributing spectra was taken, based on the separation of each spectrum from the pixel. We normalise the intensity based on the beam response at this offset, and then down-weight each value by the square of the beam response.
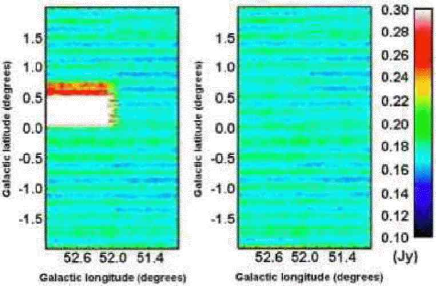
Initial cubes were made at the completion of each block (i.e. for the 32 scans a 2∘ 4∘ image plane is constructed); this was adequate for initial source detection (section 3.6), but sources near the edge of a block cannot be measured precisely without the additional information from the adjacent block. Since there is no overlap between adjacent observing blocks, in our final processing we choose to generate cubes of 2.2∘ 4∘, centred at the block junctions so as to seamlessly blend the adjacent blocks. The increased 2.2 degree longitude span of these final cubes gave a small region of overlap between adjacent cubes which ensured that the analysis on any source could be made without any edge effects. The velocity was also cleanly limited when cubes of differing centre velocities were combined (Fig. 8).
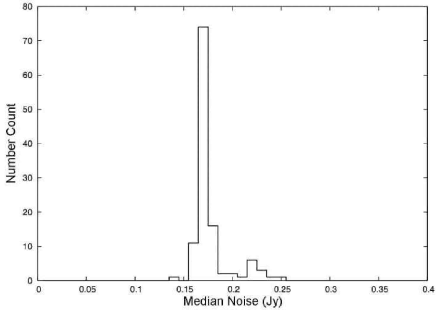
For 6668-MHz methanol, data cubes of total intensity (Stokes I) were produced, combining the right and left circular polarizations. However, for 6035-MHz OH, since the maser emission is typically highly polarized, additional separate left hand circular and right hand circular polarized emission cubes were produced and examined. The distribution of median noise levels across all the final cubes can be seen in Fig. 9.
3.6 Source Detection
Sources were identified in the survey cubes with an algorithm based on that of the ATNF Spectral line Analysis Package222http:///www.atnf.csiro.au/computing/software/asap/. The ASAP 1-dimension routine was run for each of the 32000 spatial pixels contained within a 2.2∘ 4∘ Galactic data cube.
The algorithm operates initially on the spectrum at each position. The value in each spectral pixel (channel) is compared to a baseline estimated from a linear fit to the intensity as a function of frequency in a spectral window covering 5 per cent of the bandwidth ( channels) centred on the channel under examination. This window was narrower than any baseline fluctuations, but significantly broader than a typical maser line. To classify as a detection, three consecutive channels must have values more than 4.7 times the root mean square deviation of their respective baseline fits (i.e. per channel). This threshold was found to be sufficiently high to limit the number of false positives (noise above the threshold), while detecting the majority of real sources.
The algorithm then searched for the tails of emission by extending in both directions in the spectral domain until the difference between the channel flux density and the linear baseline fit changed sign. Spectral lines wholly located in the first 75 (lowest frequency) and last 150 (highest frequency) channels of each spectrum were excluded as they were likely to be due to the edge effects of the bandpass. Once a line was detected, the channels containing it were excluded and the baseline was recalculated. Once the end of the spectrum was reached the process started again, iterating until no further lines were found. Several lines could be detected in one pass, but several iterations were required to detect weak lines in the presence of strong lines. The noise level was determined at each iteration of the algorithm through calculating the average of the variances across the spectrum, excluding 20 per cent of the largest absolute values as well as channels which met the detection criteria.
To search for broader emission the whole process was repeated taking the average of each pair of channels, adopting a smaller sample box of 50 channels and reducing the signal-to-noise threshold by .
When a detection was made in a pixel, all neighbouring spatial pixels were tested in the same way, with successive testing of neighbouring pixels until the signal dropped below the threshold, or the image edge was reached. The channels for each pixel belonging to the new source were merged, but if more than one distinct spectral line component was found, then the spatial separation was compared. If the components were separated by more than one pixel (1 arcmin) the source was split into two (or more) appropriate positions. If sources were close both spatially and spectrally they were combined into a single source. However, there were only a few sources that were falsely combined and these were easily visually separated on inspection of the cubes.
Once this process had iterated across every pixel in a cube, a source list and a series of spectra were compiled. The source list was verified by eye, discarding spurious detections (typically from the edge of the bandpass), and reassessing the velocity range of each source. The resultant maser positions were accurate enough for follow-up observations with the ATCA. The performance of the algorithm was tested with a cube of Gaussian noise and agreed well with the number of false positives expected for the chosen signal-to-noise threshold. The completeness of the detection process is discussed in detail in section 6.
3.7 Targeted Observations Data Reduction
The data from the targeted observations employing the ‘MX’ schedule were processed using asap. The bandpass reference for each beam was estimated using the median spectrum of the six ‘off-source’ positions, and each median reference then combined with the corresponding total power spectrum ‘on-source’ to determine a baseline- and gain-corrected quotient spectrum. For methanol the polarizations were averaged together. The seven spectra were then combined to give a final spectrum with an effective 7 min integration time and a typical rms noise of less than 0.10 Jy in the total intensity spectrum. Flux densities were calibrated from the noise diode data and thus ultimately linked to the ‘SPOT’ observations of the continuum source 1934-638. The spectrum of a new detection from the survey is shown in Fig. 10. The source lies in the first Galactic quadrant and its negative velocity shows that it is a far-side outer Galaxy source.
4 Accurate Position Measurements
All southern sources detected in the Parkes MMB survey without a previously confirmed high resolution position were observed with the ATCA. Northern sources, and those near declination zero, were observed with MERLIN.
The ATCA observations were taken: 2006 March/April and December; 2007 February, May, July and November; and 2008 January and August. The observations were obtained with 6-km EW array configurations, and typically consisted of a loop of targets plus a nearby phase calibrator repeated several times within a 10 hour period. The time on source was typically a few minutes, but was increased to more than 1 hour for weak targets. The correlator was configured with a 4-MHz bandwidth (as for the Parkes observations), but with 1024 frequency channels (rather than 2048), so as to allow a simultaneous search for continuum emission at 8.64 GHz. The primary ATCA flux density calibrator 1934-638 was observed in each session, and usually 1921-293 as a bandpass calibrator. Processing was performed using the packages aips or miriad. Visibility data for each source were calibrated and then converted into a spectral cube image and cleaned. The typical rms noise is 40-60 mJy per 3.9 kHz channel and positions are accurate to 0.1 arcsec.
The MERLIN observations were taken between 2006 April and 2007 November. Observations were taken in phase referencing mode with 5/6 cuts of 10 minutes on the source, at intervals of 2 hours spread over an 10 hour period. Each cut of a source was preceded and followed by 2 minutes on the phase calibrator. The observations used five of the six MERLIN telescopes (the MKII, Darnhall, Tabley, Knockin and Cambridge), with a longest baseline of 217 km, which gives a synthesized beam size of 43 mas at 6.7 GHz. The narrowband correlator setup was 1-MHz bandwidth and 512 channels and the wideband setup was 16-MHz bandwidth with 16 channels. The MERLIN data were initially reduced with local MERLIN software and converted to FITS format with preliminary bandpass scaling, then all further processing was with aips (Diamond et al., 2003). The primary flux density and bandpass calibrator was 3C84 (and on occasion 3C286). This was observed in both wide and narrowband configurations. The phase calibrator, chosen depending on the sources, was observed purely in the wideband setup for optimal signal-to-noise. Sources were observed at fixed frequency. Flux density and phase were calibrated in the narrowband and wideband data respectively, and then the solutions applied to the source data. Inspection of the spectra allowed the brightest channel to be selected and imaged to obtain an accurate position. The typical rms noise is 25 mJy per channel and the positions are accurate to 15 mas. MERLIN observations were made of not only the new detections in the 20∘ to 60∘ longitude region, but also the known sources from the survey of Szymczak et al. (2002) which had no published high-resolution observations.
5 Parallel Surveys
5.1 Magellanic Clouds Survey
In addition to the Galactic plane survey, we have also conducted the first complete survey of the Large and Small Magellanic Clouds for 6668-MHz methanol and 6035-MHz excited-state hydroxyl masers (Green et al., 2008). This included higher-sensitivity targeted searches towards known star-formation regions. The observations yielded the discovery of a fourth 6668-MHz methanol maser in the Large Magellanic Cloud (LMC), found towards the star-forming region N160a, and a second 6035-MHz excited-state hydroxyl maser, found towards N157a. We also re-observed the three previously known 6668-MHz methanol masers and the single 6035-MHz hydroxyl maser. All observations were initially made using the MMB receiver on the Parkes telescope when the Galactic plane was not visible, and accurate positions were measured with the ATCA. Green et al. (2008) present an analysis of the water and ground-state OH maser populations in addition to the excited-state OH and methanol, and found the LMC maser populations to be smaller than their Milky Way counterparts by up to a factor of 45. We failed to detect emission from either transition in the Small Magellanic Cloud.
5.2 Pulsar Piggyback Programme
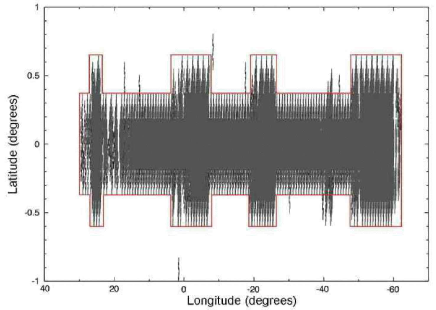
The 6-GHz multibeam receiver was also used for a Galactic pulsar search (Parkes project P512 conducted by Johnston and colleagues; O’Brien et al. (2008)) and we were able to ‘piggyback’ spectral line observations for the 6668-MHz methanol transitions on this program. The pulsar observations were taken at two frequencies, one of which included the 6668-MHz methanol frequency. Piggyback observations occurred over eight sessions between February 2006 and August 2007. The requirements of the primary pulsar observations prevented Doppler tracking and switching of the noise diode during the piggybacked spectral line observations. Due to these restrictions the methanol observations were made using a single fixed centre frequency (6668.5 MHz) that was suitable for a wide range of Galactic positions and a bandwidth of 8 MHz, with 4096 spectral channels. The piggyback survey thus has the same spectral resolution as the main survey, but double the velocity coverage and only observed the methanol transition and not excited OH. The pulsar observations were made using long pointed integrations (as opposed to the scanning strategy employed for the MMB survey). The observations primarily targeted the Galactic centre, covering an area of 51 degree2 distributed over 85 degree2 on the sky (Fig. 11). The typical integration times were 17 min, but a small region near the Galactic centre was covered by even deeper, 5-hour, integrations.
The different observing strategy of the piggyback observations (compared to the main MMB survey) necessitated the development of a separate data reduction approach. For the piggyback observations the data were processed using asap. As noise diode switching was disabled for the pulsar observations there were no system temperature measurements available for the piggyback data. We assumed a system noise equivalent flux density of 65 Jy for each beam in all observations, approximately 8 per cent higher than cold sky values (see section 3.1). We chose this higher value partly to be conservative in our sensitivity estimates and partly to account for the fact that the pulsar observations were more concentrated to regions of higher than average Galactic background continuum emission. The general reduction strategy in the case of the 17 min integration data sets was to form a single reference spectrum for each polarization and beam for each day. The reference was formed using all the spectra for that polarization and beam on a particular day and finding the median value for each channel in the spectrum. The quotient spectra that result from these median references contain baseline ripples with amplitudes of around 1 Jy which cannot be removed even with a high order ( 15th) polynomial. We found that a running median filter (of width 50 channels) produced a smoothed copy of the spectrum, which when subtracted from the original was very effective at removing the baseline ripple with minimal effect on real maser emission. For strong masers (peak flux density 10 Jy) with a velocity range comparable to the filter width this method results in a negative dip in the baseline around the maser emission. This does not effect our ability to detect these masers (all of which are found in the main MMB survey anyway) and the weak (and typically narrow velocity range) masers that are the primary target of the piggyback survey do not suffer this problem. The piggyback survey utilises the same line-finder algorithm employed in the main survey, but using a lower detection threshold of two consecutive channels exceeding three times the rms.
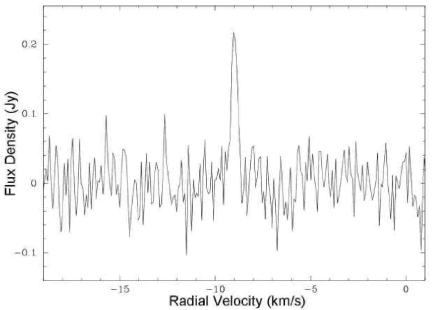
The effective per-beam integration time for the main MMB survey is approximately one minute and so we would expect that the piggyback survey with integration times of 17 minutes should be a factor of approximately four more sensitive. This is indeed the case, with the typical measured rms for a 17 minute integration being 42 mJy. This is approximately a factor of two more sensitive than the Arecibo survey of Pandian et al. (2007). Thus, the piggyback survey is the most sensitive large area methanol maser survey that has been made to date. These data provide a much deeper, but undersampled survey, which will be used to probe the low flux density end of the maser population and the variability of these sources. Fig. 12 shows an example spectrum of a weak new source from the piggyback observations; it demonstrates that the piggyback observations are capable of detecting masers with peak flux densities as low as 0.2 Jy and this is confirmed through numerous detections of strong masers in distant sidelobes. The sensitivity of the piggyback search is such that masers with peak flux densities in excess of a few hundred Jy can be weakly detected in pointings more than half a degree from their true location. A preliminary analysis of approximately 25 per cent of the piggyback data () suggests of the order of 40 new detections, the majority below 0.5 Jy.
6 Survey Sensitivity & Completeness
6.1 Efficiency of Maser Detection
In order to test the efficiency and accuracy of the detection methods employed by the MMB, we constructed several test cubes containing simulated masers. The process involved creating a skymap of positions of masers together with associated data files containing velocities and flux densities for each maser position. To create realistic simulated maser sources we took some observed 10 Jy masers and rescaled them to represent typical sources at a range of flux densities. The 10 Jy masers were selected to have features across a realistic distribution of velocity ranges and were given randomly distributed peak velocities. The rescaled peak flux densities were 0.5, 0.6, 0.7, 0.8, 0.9, 1.0 and 1.1 Jy. Forty simulated masers were created at each flux density level, and split into two batches with random longitudes and latitudes between the ranges of 220∘ 222∘ and 2∘ to 2∘ respectively. This range was chosen so that the simulated masers could be added to an empty real data cube. The simulated sources were then added to the bandpass calibrated data files (sdfits). This was done by calculating the angular separation and parallactic angle between the Parkes beam and the source position, then obtaining the attenuation factor. The simulated spectrum was then scaled using this factor. The scaled spectra were added to the data files. By adding the masers to the data files for a real cube, rather than simulated pure noise, we ensured that the effect of any residual baseline wobble would be taken into account. The beam model was approximated by varying the model of James (1987) to a dish diameter of 64 m and allowing for three feed leg shadows. This never the less had the limitation that it did not fully describe the sidelobe properties.
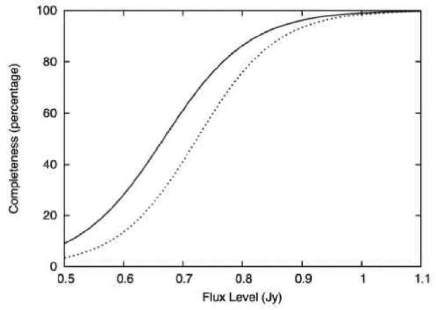
The 14 simulated cubes (with a batch of 20 masers at a given flux density in each cube) were processed in the same manner as the survey data (section 3.7). This allowed us to form two sets of results: the detections made by the program (‘algorithm detections’ in Table 2 and Fig. 13); and the subset of these that were then deemed real by eye (‘catalogued sources’ in Table 2 and Fig. 13). The inspection by eye removes any false detections by the algorithm. From the underlying trend we estimate the completeness to be 80 per cent at 0.8 Jy, approaching 100 per cent at 1 Jy.
| Input | Percentage | Algorithm | Completeness | Catalogued | Total |
|---|---|---|---|---|---|
| Flux | of sources | Detections | of Algorithm | Sources | Completeness |
| (Jy) | below threshold | (per cent) | (per cent) | ||
| 0.5 | 58.8 | 3 | 84 | 0 | 0 |
| 0.6 | 36.9 | 11 | 288 | 7 | 187 |
| 0.7 | 18.7 | 25 | 6313 | 14 | 359 |
| 0.8 | 7.4 | 35 | 8815 | 34 | 8515 |
| 0.9 | 2.3 | 37 | 9315 | 36 | 9015 |
| 1.0 | 0.1 | 36 | 9015 | 32 | 8014 |
| 1.1 | 0.1 | 40 | 10016 | 36 | 9015 |
6.2 Completeness of Catalogue
The recent survey with the Arecibo telescope by Pandian et al. (2007) surveyed the region 35.2∘ 53.7∘, 0.41∘ with a survey threshold of 0.27 Jy (more than 95 per cent probability of detection at 3). The MMB survey region fully encompasses the Arecibo survey region, and of the 86 detections found by Pandian et al. the MMB detected 73. The strongest of the non-detections is G037.77-0.22 with peak flux density 0.82 Jy, and the remaining 12 had peak flux densities (at the epoch of the Arecibo observations) between 0.13 and 0.5 Jy. We note the Arecibo survey had slightly narrower velocity channels, 0.07 km s-1, but was Hanning smoothed. The velocity range was 70 to 110 km s-1, whilst the MMB’s velocity coverage was: 35 to 115 km s-1 for 35.2∘ 40∘; 45 to 105 km s-1 for 40∘ 46∘; 55 to 95 km s-1 for 46∘ 50∘; and 65 to 85 km s-1 for 50∘ 53.7∘. None of the Arecibo sources fall outside the MMB velocity coverage. Comparisons between the two surveys are affected by the variability of sources from the time of the Arecibo survey to the MMB survey (up to three years for some sources). Some methanol masers exhibit large variations within less than a year (e.g. Caswell, Vaile & Ellingsen, 1995; MacLeod & Gaylard, 1996; Goedhart, Gaylard & van der Walt, 2004), and some of the weaker Arecibo masers may have decreased in flux density below our threshold. G037.77-0.22 seems to be an example, since it had a recorded peak flux density of 0.82 Jy in 2005 September, but was not detected above 0.4 Jy by the MMB survey in 2007 September.
Another test of the completeness of the catalogue is obtained by taking deeper observations to much lower detection thresholds. As described in section 5.2, we are able to achieve these through ‘piggybacking’ on pulsar observations. These observations will provide a better estimate of the luminosity distribution within the region and reveal what fraction of the total population we are detecting with the main survey. The results of this work will be fully described in a subsequent paper (Ellingsen et al. in preparation).
Pandian & Goldsmith (2007) in a follow up paper to the Arecibo survey used the van der Walt (2005) model distribution to estimate that in the longitude range 40 to 50 degrees, the fraction of total masers in the Galaxy above the threshold of 0.27 Jy would be between 89 and 93 per cent. If the van der Walt (2005) predictions are applied to MMB survey sensitivity we find between 79 and 86 per cent are above the threshold. A full analysis of the completeness by longitude will be discussed in future papers.
7 Summary
The Methanol Multibeam survey, employing a new purpose-built 7-beam receiver, has completed observing the longitude range 174∘ 60∘ with the Parkes radio telescope. More than 800 6668-MHz methanol masers have been found to date (including several far-side outer Galaxy masers), suggesting a total Galactic population in excess of 1000. We have also surveyed the Magellanic Clouds (Green et al., 2008) and have conducted a deeper survey of a much smaller region in our ‘piggyback’ observations (Ellingsen et al. in preparation). The results of the methanol survey will be released sequentially, starting with the Galactic centre, and will incorporate accurate positions and spectra for each maser. The excited-state OH results will then be released and the data sets will be made available online in due course. Follow-up observational programmes have already been initiated to probe the maser surroundings.
Through incorporating new technology, multiple radio astronomy instruments, and international collaboration, the MMB survey is well on its way to producing the largest unbiased, homogeneous Galactic plane catalogues of 6668-MHz methanol and 6035-MHz hydroxyl masers to date. The Galactic distribution of methanol masers, when combined with distance indicators such as HI self-absorption and maser parallax studies, will allow for the determination of the distribution of high-mass star formation regions, and thus will have implications for understanding spiral arm structure and Galactic dynamics. The precise source positions in the catalogues, when combined with comparable high-precision observations at sub-mm and far-IR wavelengths from future instruments, will hold the key to improving our understanding of the conditions that give birth to high-mass stars.
Acknowledgments
JAG, AA, JCox and DW-McS acknowledge the support of a Science and Technology Facilities Council (STFC) studentship. LQ acknowledges the support of the EU Framework 6 Marie Curie Early Stage Training programme under contract number MEST-CT-2005-19669 “ESTRELA”. MERLIN is a national facility operated by the University of Manchester on behalf of STFC. The Parkes Observatory and the Australia Telescope Compact Array are part of the Australia Telescope which is funded by the Commonwealth of Australia for operation as a National Facility managed by CSIRO. The authors greatly thank the engineering staff both at the Australia Telescope National Facility and Jodrell Bank Observatory, and the staff at the Parkes observatory for ensuring the smooth running of the observations. The authors dedicate this paper to the memory of R. J. Cohen.
References
- Barnes et al. (2001) Barnes D. G., Staveley-Smith L., de Blok W. J. G., et al. 2001, MNRAS, 322, 486
- Burton (1976) Burton W. B., 1976, ARA&A, 14, 275
- Carey et al. (2000) Carey S. J., Feldman P. A., Redman R. O., Egan M. P., MacLeod J. M., Price S. D., 2000, ApJ, 543, 157
- Caswell (1996a) Caswell J. L., 1996a, MNRAS, 283, 606
- Caswell (1996b) Caswell J. L., 1996b, MNRAS, 279, 79
- Caswell (1996c) Caswell J. L., 1996c, in Gredel R., ed., The Galactic Center Vol. 102 of Astronomical Society of the Pacific Conference Series, Masers and Star Formation near the Galactic Centre. p. 247
- Caswell (1997) Caswell J. L., 1997, MNRAS, 289, 203
- Caswell (2003) Caswell J. L., 2003, MNRAS, 341, 551
- Caswell & Vaile (1995) Caswell J. L., Vaile R. A., 1995, MNRAS, 273, 328
- Caswell et al. (1995) Caswell J. L., Vaile R. A., Ellingsen S. P., 1995, Publications of the Astronomical Society of Australia, 12, 37
- Caswell et al. (1995) Caswell J. L., Vaile R. A., Ellingsen S. P., Whiteoak J. B., Norris R. P., 1995, MNRAS, 272, 96
- Codella et al. (2004) Codella C., Lorenzani A., Gallego A. T., Cesaroni R., Moscadelli L., 2004, A&A, 417, 615
- Condon et al. (1989) Condon J. J., Broderick J. J., Seielstad G. A., 1989, AJ, 97, 1064
- Cragg et al. (2002) Cragg D. M., Sobolev A. M., Godfrey P. D., 2002, MNRAS, 331, 521
- Dame et al. (2001) Dame T. M., Hartmann D., Thaddeus P., 2001, ApJ, 547, 792
- Diamond et al. (2003) Diamond P. J., Garrington S. T., Gunn A. G., Leahy J. P., McDonald A., Muxlow T. W. B., Richards A. M. S., Thomasson P., 2003, MERLIN User Guide
- Dickey & Lockman (1990) Dickey J. M., Lockman F. J., 1990, ARA&A, 28, 215
- Ellingsen (2007) Ellingsen S. P., 2007, MNRAS, 377, 571
- Ellingsen et al. (1996) Ellingsen S. P., von Bibra M. L., McCulloch P. M., Norris R. P., Deshpande A. A., Phillips C. J., 1996, MNRAS, 280, 378
- Gaylard & MacLeod (1993) Gaylard M. J., MacLeod G. C., 1993, MNRAS, 262, 43
- Goedhart et al. (2004) Goedhart S., Gaylard M. J., van der Walt D. J., 2004, MNRAS, 355, 553
- Green et al. (2008) Green J. A., Caswell J. L., Fuller G. A., et al. 2008, MNRAS, 385, 948
- Guilloteau et al. (1984) Guilloteau S., Baudry A., Walmsley C. M., Wilson T. L., Winnberg A., 1984, A&A, 131, 45
- James (1987) James G. L., 1987, IEE Proceedings H: Microwaves Antennas and Propagation, 134, 217
- Keto (2003) Keto E., 2003, ApJ, 599, 1196
- Knowles et al. (1976) Knowles S. H., Caswell J. L., Goss W. M., 1976, MNRAS, 175, 537
- Knowles et al. (1973) Knowles S. H., Johnson K. J., Moran J. M., Ball J. A., 1973, ApJ Letters, 180, 117
- MacLeod & Gaylard (1992) MacLeod G. C., Gaylard M. J., 1992, MNRAS, 256, 519
- MacLeod & Gaylard (1996) MacLeod G. C., Gaylard M. J., 1996, MNRAS, 280, 868
- MacLeod et al. (1992) MacLeod G. C., Gaylard M. J., Nicolson G. D., 1992, MNRAS, 254, 1
- Menten (1991) Menten K. M., 1991, ApJ, 380, 75
- Minier et al. (2005) Minier V., Burton M. G., Hill T., Pestalozzi M. R., Purcell C. R., Garay G., Walsh A. J., Longmore S., 2005, A&A, 429, 945
- Minier et al. (2003) Minier V., Ellingsen S. P., Norris R. P., Booth R. S., 2003, A&A, 403, 1095
- Mizuno & Fukui (2004) Mizuno A., Fukui Y., 2004, in Clemens D., Shah R., Brainerd T., eds, Milky Way Surveys: The Structure and Evolution of our Galaxy Vol. 317 of Astronomical Society of the Pacific Conference Series, Physical properties of molecular clouds as revealed by NANTEN CO survey: from the galactic center to the galactic warp. p. 59
- O’Brien et al. (2008) O’Brien J. T., Johnston S., Kramer M., Lyne A. G., et al. 2008, MNRAS, accepted
- Pandian & Goldsmith (2007) Pandian J. D., Goldsmith P. F., 2007, ApJ, 669, 435
- Pandian et al. (2007) Pandian J. D., Goldsmith P. F., Deshpande A. A., 2007, ApJ, 656, 255
- Pestalozzi et al. (2002) Pestalozzi M., Minier V., Booth R., Conway J., 2002, in Migenes V., Reid M. J., eds, Cosmic Masers: From Proto-Stars to Black Holes Vol. 206 of IAU Symposium, The Onsala blind 6.7 GHz survey of the galactic plane: new methanol masers in the northern hemisphere. p. 139
- Pestalozzi et al. (2005) Pestalozzi M. R., Minier V., Booth R. S., 2005, A&A, 432, 737
- Purcell et al. (2006) Purcell C. R., Balasubramanyam R., Burton M. G., et al. 2006, MNRAS, 367, 553
- Russeil (2003) Russeil D., 2003, A&A, 397, 133
- Rydbeck et al. (1970) Rydbeck O. E. H., Kollberg E., Elldér J., 1970, ApJ, 161, 25
- Schutte et al. (1993) Schutte A. J., van der Walt D. J., Gaylard M. J., MacLeod G. C., 1993, MNRAS, 261, 783
- Slysh et al. (1999) Slysh V. I., Val’tts I. E., Kalenskii S. V., Voronkov M. A., Palagi F., Tofani G., Catarzi M., 1999, A&AS, 134, 115
- Szymczak et al. (2000) Szymczak M., Hrynek G., Kus A. J., 2000, A&AS, 143, 269
- Szymczak et al. (2002) Szymczak M., Kus A. J., Hrynek G., Kěpa A., Pazderski E., 2002, A&A, 392, 277
- van der Walt et al. (1995) van der Walt D. J., Gaylard M. J., MacLeod G. C., 1995, A&AS, 110, 81
- van der Walt et al. (1996) van der Walt D. J., Retief S. J. P., Gaylard M. J., MacLeod G. C., 1996, MNRAS, 282, 1085
- van der Walt et al. (2007) van der Walt D. J., Sobolev A. M., Butner H., 2007, A&A, 464, 1015
- van der Walt (2005) van der Walt J., 2005, MNRAS, 360, 153
- Walsh et al. (1997) Walsh A. J., Hyland A. R., Robinson G., Burton M. G., 1997, MNRAS, 291, 261
- Wood & Churchwell (1989) Wood D. O. S., Churchwell E., 1989, ApJ, 340, 265
- Yen et al. (1969) Yen J. L., Zuckerman B., Palmer P., Penfield H., 1969, ApJ Letters, 156, 27
- Yorke (2004) Yorke H. W., 2004, in Garcia-Segura G., Tenorio-Tagle G., Franco J., Yorke H. W., eds, Revista Mexicana de Astronomia y Astrofisica Conference Series Vol. 22 of Revista Mexicana de Astronomia y Astrofisica Conference Series, Protostellar Disks under the Influence of Winds and UV Radiation. pp 42–45
- Zuckerman et al. (1972) Zuckerman B., Yen J. L., Gottlieb C. A., Palmer P., 1972, ApJ, 177, 59