New EUV Fe IX emission line identifications from Hinode/EIS
Abstract
Four Fe ix transitions in the wavelength range 188–198 Å are identified for the first time in spectra from the EUV Imaging Spectrometer on board the Hinode satellite. In particular the emission line at 197.86 Å is unblended and close to the peak of the EIS sensitivity curve, making it a valuable diagnostic of plasma at around 800,000 K – a critical temperature for studying the interface between the corona and transition region. Theoretical ratios amongst the four lines predicted from the CHIANTI database reveal weak sensitivity to density and temperature with observed values consistent with theory. The ratio of 197.86 relative to the 171.07 resonance line of Fe ix is found to be an excellent temperature diagnostic, independent of density, and the derived temperature in the analysed data set is , close to the predicted temperature of maximum ionization of Fe ix.
1 Introduction
Although the solar vacuum ultraviolet (VUV; 100–2000 Å) spectrum has been studied for many years and most of the strong lines identified, there remain a large number of unidentified lines. Classifying these lines is important for several reasons: they may yield new diagnostics for the Sun or other astrophysical bodies; they may contribute to the passbands of solar imaging instruments, distorting results if not accounted for; they add to the total irradiance from the Sun; and they improve our knowledge of atomic structure. While line identifications can be performed in the laboratory, a high resolution solar spectrometer with imaging capability is a particularly powerful tool for line identification studies as the morphology of images formed in a given emission line will be highly characteristic of the temperature the line is formed at, making the parent ion much easier to establish.
Recently the EUV Imaging Spectrometer (EIS; Culhane et al., 2007) was launched on board the Hinode satellite (Kosugi et al., 2007) and it is the first space-borne spectrometer to routinely observe the Sun in the wavelength ranges 170–212 and 246–292 Å at a high spectral resolution. The majority of strong emission lines and their diagnostic properties are known (Young et al., 2007b; Brown et al., 2008), but 45 % of lines were classified as unidentified by Brown et al. (2008). The majority of these unidentified lines likely belong to the iron ions Fe ix–xiv for which there are many levels that do not have experimental energy levels, thus making the wavelengths from these emission lines very uncertain.
This work presents new identifications for four such emission lines that belong to Fe ix. Although the strong 171.07 resonance line of Fe ix is found in the EIS short wavelength band, the effective area is so low (around 1000 times less than the peak effective area of the instrument) that it is not scientifically useful in most circumstances. The newly-identified lines are much stronger in terms of counts at the detector and bring new capability to the instrument, giving access to strong unblended lines from the complete sequence of iron ions from Fe viii to Fe xvii. In addition, the newly-identified line at 197.86 Å is found to contribute to one of the best coronal temperature diagnostics at ultraviolet wavelengths.
2 Observations
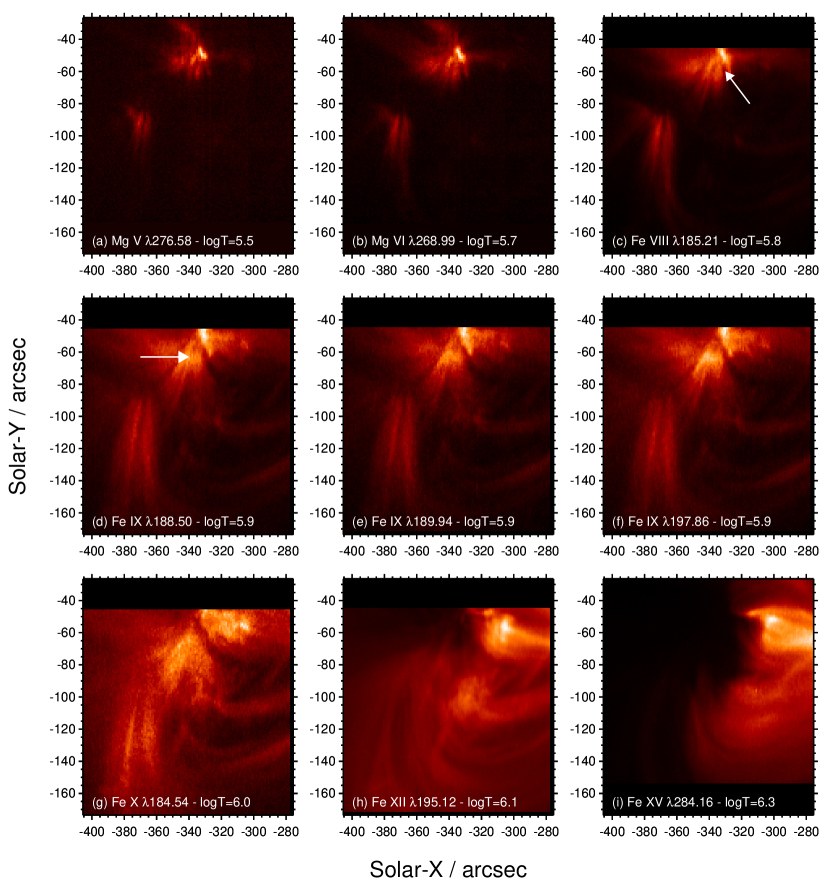
Active region AR 10942 was observed by EIS on 2007 February 21 with the study HPW008_FULLCCD_RAST which covers an area 128 128 with the 1 slit. Full CCD spectra are obtained with an exposure time of 25 s, and the raster duration is 57 mins. Images from the data-set in a variety of emission lines are shown in Fig. 2. The raster is pointed at the footpoint regions on the east side of the active region. A number of spiky structures are seen in the cool lines which are seen to be the footpoints of loops visible in Fe x and Fe xii. A key feature of this observation is a spatial area (indicated by an arrow in Fig. 2c) that is bright at temperatures –6.0, but has relatively little emission from plasma at . The spectrum in this region is not dissimilar to a coronal hole spectrum, but because the observed features are bright coronal loop footpoints the signal-to-noise is high in the spectrum allowing weak lines to be observed.
The data set was calibrated using the routine EIS_PREP, which is described in detail by Young et al. (2008). In order to measure the intensities and wavelengths of the Fe ix lines, a region of 38 spatial pixels indicated by the arrow in Fig. 2d was chosen where the Fe ix lines are particularly enhanced. The spectra from these pixels were averaged, with care taken not to include pixels flagged as ‘missing’ by EIS_PREP. The spatial offsets between different wavelengths highlighted by Young et al. (2008) that are due to the tilt of the EIS grating relative to the EIS CCD have been corrected for to ensure the same spatial region is used for each line.
The present work is focussed on four emission lines at 188.50, 189.94, 191.22 and 197.86 Å that were seen to be strongly enhanced in the loop footpoint regions. Only one of these (197.86) was classified as unidentified by Brown et al. (2008), with 188.50 listed as a Fe xii transition, 189.94 as a Fe xi transition and 191.22 as a blend of Fe xiii and S xi. To identify the lines with Fe ix we compare images formed in the lines with other, known species. Fig. 2 shows images from Mg v 276.58, Mg vi 268.99, Fe viii 185.21, Fe x 184.54, Fe xii 195.12 and Fe xv 284.16, together with images from the lines at 188.50, 189.94 and 197.86 Å. (The 191.22 Å image looks very similar, except there is contribution to the image from hotter plasma. This is due to the blending S xi line – see below.) In each case the images were formed by summing 7 wavelength pixels across the line profile.
Comparing the images it is clear, firstly, that 188.50, 189.94 and 197.86 are formed at the same temperature since the images are very similar to each other and, secondly, that the temperature of formation is somewhere between that of Fe viii and that of Fe x. As the unidentified lines are strong (within a factor 2 in intensity of the strongest Fe viii lines observed by EIS) they must belong to an ion with a high solar abundance. Since line identifications for simple ions are well known at EUV wavelengths, the most likely ion is Fe ix. The fact that the 188.50 and 189.94 images look almost identical to 197.86 (an apparently unblended line) suggests that Fe xii and Fe xi make very little contribution to 188.50 and 189.94, respectively. S xi 191.26 is partly blended with 191.22 and in fact dominates the Fe ix line in the cores of active regions. Note that the Fe ix component compromises the use of S xi 191.26 in de-blending the Fe xii 186.88 density diagnostic line (Young et al., 2007b). The CHIANTI database (Landi et al., 2006; Dere et al., 1997) predicts that the Fe xiii line at 191.2 Å will be negligible in all conditions.
The measured wavelengths and line intensities of the four Fe ix transitions are given in Table 1, together with the newly-suggested line identifications. The details for the measured 171.07 line are also given. The rest wavelengths of the Fe ix lines are derived by first measuring the wavelengths of Fe x 184.54 and 190.04 in the spectrum. The velocity shifts of both lines relative to the rest wavelengths given in Brown et al. (2008) are then derived and averaged. The measured wavelengths of the Fe ix lines are then corrected by subtracting the Fe x velocity shift. This process assumes that Fe ix and Fe x exhibit the same velocity in the data set which we feel is reasonable given their close temperatures of formation.
| Rest | CHIANTI | Observed | Predicted | |
|---|---|---|---|---|
| Wavelength | Transition | wavelength | Intensity | IntensityaaPredicted intensities are from the CHIANTI synthetic spectrum discussed in the text, normalized relative to 188.497. |
| (Å) | (Å) | (erg cm-2 s-1 sr-1) | (erg cm-2 s-1 sr-1) | |
| 171.071 | – | 171.073 | 5794 | 7328 |
| 188.497 | – | 174.245 | 341 | 341 |
| 189.941 | – | 175.477 | 201 | 206 |
| 191.216 | – | 176.660 | 92 | 85 |
| 197.862 | – | 173.149 | 192 | 219 |

3 Atomic data and emission line modeling
The CHIANTI atomic database contains models suitable for predicting emission line spectra from most astrophysically abundant ions. The Fe ix model consists of observed energies from v.3.0 of the NIST Atomic Database, and theoretical energies, Maxwellian-averaged electron collision strengths and radiative decay rates from Storey et al. (2002). The model has 140 levels from six configurations.
To help identify the Fe ix transitions a synthetic isothermal spectrum was generated using CHIANTI at a temperature and electron density . Although the ionization balance calculations of Bryans et al. (2006) give a temperature of maximum ionization, , of for Fe ix, we believe it is actually : from EIS observations Fe viii clearly has (Young et al., 2007a) yet Bryans et al. (2006) give . Fe ix must thus be principally formed at . From the EIS spectrum obtained in the Fe ix emitting region, we used the Mg vii 280.75/278.39 density diagnostic (Young et al., 2007a), formed at a slightly cooler temperature of compared to Fe ix, to derive a density of , and so this value was used. The synthetic spectrum reveals a number of lines clustered around the 171.07 resonance line between 155 and 185 Å, several of which have intensities comparable to the – transitions 217.10 and 244.91, and thus would be expected to be observed if they fall in the EIS wavelength range. Every one of the emission lines between 155 and 185 Å (except 171.07) only have theoretical wavelengths, and all but two of them are – transitions.
As found in the previous section, the four unidentified EIS lines have formation temperatures close to that of Fe ix thus we look to identify these with the predicted CHIANTI lines. The strongest of the lines between 155 and 185 Å we identify with the strongest of the EIS lines, namely 188.50. As this is a transition between levels and then, based on standard atomic physics properties for multiplets, we expect weaker – and – transitions whose wavelength separations will be fairly similar to the separations in CHIANTI. The wavelengths and intensities given in Table 1 demonstrate that 189.94 and 191.22 are an excellent match for these transitions.
The closest CHIANTI transition to match the intensity of the feature at 197.86 Å is – , whose theoretical wavelength is 173.149 Å. As this is a singlet–singlet transition then there are no companion lines to serve as a check, but the diagnostic ratios presented in the following section are consistent with the identification.
New energy values for the upper levels of the new identifications are provided in Table 2. We note that the differences with the theoretical energies of Storey et al. (2002) are 4 % and 6 % for the and , respectively, which are consistent with the accuracy expected of theoretical energy calculations at these energies. The error bars on the energy estimates are obtained as follows: for the energy is derived from the wavelength of 171.07 and the wavelength of 197.86. The latter is derived here with an accuracy of 0.005 Å, while the rest wavelength of the former is taken from Behring et al. (1976) who give an accuracy of 0.004 Å. For the – transitions, the energies of the lower levels are provided by Edlén & Smitt (1978). Since none of the levels decay to the ground level, their energies are derived indirectly through allowed transitions to the configuration, and allowed transitions from this configuration to the ground configuration. Uncertainties are not provided by Edlén & Smitt (1978) but we can estimate values of 15 cm-1 from the wavelength errors provided by Smitt & Svensson (1983). Combining with the uncertainties in the measured EIS wavelengths of 0.005 Å yields the uncertainties in Table 2.
| Level | Energy / cm-1 | IndexaaThe level index in the CHIANTI v5.2 model. |
|---|---|---|
| 94 | ||
| 95 | ||
| 96 | ||
| 140 |
4 Diagnostic possibilities
Amongst the newly identified Fe ix lines, the CHIANTI model predicts some density and temperature sensitivity. Figs. 3(a,b) show the 191.22/188.50, 189.94/188.50 and 197.86/188.50 ratios as a function of density for temperatures , 5.9 and 6.0. The horizontal lines in the plots indicate the measured ratios from the 2007 February 21 data set and good agreement is found with the density derived from the slightly cooler Mg vii density diagnostic.
In Fig. 3(c) the CHIANTI prediction for the 197.86/171.07 ratio as a function of temperature is given. The ratio is an excellent temperature diagnostic and we find a temperature of from the spectrum analysed here. This is close to the value of 5.9 discussed earlier, giving confidence in our identification of the 197.86 line. This Fe ix diagnostic is of great interest as the lines are close in wavelength and have very little density sensitivity, making it one of the best temperature diagnostics available in the VUV.
5 Summary
Four new Fe ix line identifications in the wavelength range 188 to 198 Å have been presented, based on spectra obtained by the Hinode/EIS instrument. The lines give temperature coverage for the EIS instrument at , a region not covered by any other ion species observed by EIS, and one of great interest as it is where the transition region gives way to the corona.
The identified 188.50 and 197.86 lines are comparable in strength in terms of counts measured on the detector, but 197.86 is preferred for observations as it appears to be unblended and there are no strong lines nearby to it. Since 188.50 lies close to the strong Fe xi 188.23, 188.30 lines then many observing studies already obtained with EIS will have observed this line. E.g., a wavelength window set to 32 pixels and centered on 188.23 Å will include wavelengths up to 188.60 Å.
197.86/171.07 is found to be an excellent temperature diagnostic, with very little density sensitivity and lines relatively close in wavelength. The ratio is difficult to use from EIS data as the EIS sensitivity is very low at 171 Å, but designs for a future EUV solar spectrometer should give consideration to observing both lines.

References
- Behring et al. (1976) Behring, W. E., Cohen, L., Doschek, G. A., & Feldman, U. 1976, ApJ, 203, 521
- Brown et al. (2008) Brown, C. M., Feldman, U., Seely, J. F., Korendyke, C. M., & Hara, H. 2008, ApJS, 176, 511
- Bryans et al. (2006) Bryans, P., Badnell, N. R., Gorczyca, T. W., et al. 2006, ApJS, 167, 343
- Culhane et al. (2007) Culhane, J. L., Harra, L. K., James, A. M., et al. 2007, Solar Physics, 243, 19
- Dere et al. (1997) Dere, K. P., Landi, E., Mason, H. E., Monsignori-Fossi, B. C., & Young, P. R. 1997, A&AS, 125, 149
- Edlén & Smitt (1978) Edlén, B., & Smitt, R. 1978, Sol. Phys., 57, 329
- Kosugi et al. (2007) Kosugi, T., Matsuzaki, K., Sakao, T., et al. 2007, Sol. Phys., 243, 3
- Landi et al. (2006) Landi, E., Del Zanna, G., Young, P.R. et al. 2006, ApJS, 162, 261
- Smitt & Svensson (1983) Smitt, R., & Svensson, L. A. 1983, Phys. Scripta, 27, 364
- Storey et al. (2002) Storey, P. J., Zeippen, C. J., & Le Dourneuf, M. 2002, A&A, 394, 753
- Young et al. (2007a) Young, P. R., Del Zanna, G., Mason, H. E., et al. 2007a, PASJ, 59, S727
- Young et al. (2007b) Young, P. R., Del Zanna, G., Mason, H. E., et al. 2007b, PASJ, 59, S857
- Young et al. (2008) Young, P. R., Watanabe, T., Hara, H., & Mariska, J. T. 2008, A&A, in press (arXiv:0805.0958)
Facilities: Hinode (EIS).