Origin of the narrow, single peak in the fission-fragment mass distribution for 258Fm
Abstract
We discuss the origin of the narrowness of the single peak at mass-symmetric division in the fragment mass-yield curve for spontaneous fission of 258Fm. For this purpose, we employ the macroscopic-microscopic model, and calculate a potential-energy curve at the mass-symmetric compact scission configuration, as a function of the fragment mass number, which is obtained from the single-particle wave-function densities. In the calculations, we minimize total energies by varying the deformations of the two fragments, with constraints on the mass quadrupole moment and keeping the neck radius zero, as a function of mass asymmetry. Using the obtained potential, we solve the one-dimensional Schrödinger equation with a microscopic coordinate-dependent inertial mass to calculate the fragment mass-yield curve. The calculated mass yield, expressed in terms of the microscopic mass density, is consistent with the extremely narrow experimental mass distribution.
pacs:
24.75.+i, 27.90.+bIn spontaneous fission the fragment mass-yield distributions change abruptly from a double-peaked, broad, mass-asymmetric distribution for 256Fm to a single-peaked, very narrow, symmetric distribution for 258Fm Hoffman et al. (1980); Hulet et al. (1986, 1989). In addition, in 258Fm the kinetic-energy distribution can be expressed as a sum of a low-energy and a high-energy component, whose mean energies differ by about 35 MeV. The mechanism behind this phenomenon, called bimodal fission, is the strong nuclear shell effects that appear when symmetric division into two fragments which both are near the doubly magic nucleus 132Sn becomes possible. The experimental observations of the sudden emergence of a mass-symmetric division near 258Fm has always been assumed to be due to an emergence in fission potential-energy surfaces of a fission path, strongly stabilized by fragment shell effects Hoffman et al. (1980); Zhao et al. (1999, 2000); Britt et al. (1984); Hoffman and Lane (1995). However, no such intuitive picture of the mechanism behind the narrowness of the symmetric mass distribution peak has been advanced, nor has a convincing quantitative calculation explaining the extremely narrow FWHM been presented.
So far, theoretical investigations have mainly focused on obtaining the transition point between competing fission modes near 258Fm by calculating the potential-energy surface versus various chosen sets of deformation coordinates. In fact, theoretical models, such as the macroscopic-microscopic model Möller et al. (1987); Pashkevich (1988); Möller et al. (1989); Ćwiok et al. (1989); Möller and Nix (1994); Möller et al. (2001), the constrained Hartree-Fock+BCS (HFBCS) model Bonneau (2006); Staszczak et al. (2007), and the constrained Hartree-Fock-Bogoliubov (HFB) model Warda et al. (2002); Dubray et al. (2008), have to a varying degree of success described such a shell-stabilized path, and the transition point between asymmetric and symmetric fission modes near 258Fm, that is, the emergence here of path leading to mass-symmetric divisions with compact scission configurations, referred to as the compact symmetric path. Through these investigations the energy-minimum path leading to high-kinetic-energy, symmetric fission has been well established, but the structure of the potential valley along this path and plausible mechanisms behind the extremely narrow FWHM have been less extensively studied.
In this paper, we calculate quantitatively the mass distribution of 258Fm in the compact symmetric valley. The calculations are based on studies of the dynamics of the zero-neck-radius scission configuration in the mass-asymmetry shape degree of freedom Vandenbosch and Huizenga (1973). We also impose spherical fragment shapes, which leaves us with mass asymmetry as the only collective coordinate. This approach implies that the mass distribution originates from zero-point vibrations or thermal fluctuations in the mass-asymmetry degree of freedom at scission. In the specific case of 258Fm considered here, it is a reasonable assumption and approximation, since in spontaneous fission the exit point after barrier penetration is approximately the zero-neck scission configuration.
We use the macroscopic-microscopic model Bolsterli et al. (1972); Möller et al. (1995) constrained to shapes with zero neck radius. Using a macroscopic-microscopic model, slightly different from our implementation, Pashkevich failed to find any significant difference between the curvatures of the compact and elongated symmetric valleys for 264Fm Pashkevich (1988). Furthermore, in his cranking-model analysis of the mass distribution widths associated with the zero-point oscillations in his asymmetry degree of freedom he obtained similar mass yield distribution widths in both valleys, approximately consistent with the narrow distribution observed experimentally for 258Fm. His dynamical study has significant similarities with our study here. However, Pashkevich characterized fragment mass numbers by the asymmetry of the homogeneous macroscopic volume defined by the parametrization of the nuclear surface. Here we use microscopic densities to characterize the mass distribution, which gives very different mass-distribution curves close to magic numbers. As we discuss in detail below, we propose it is the shell gaps that restrict fluctuations in the microscopic mass-asymmetry degree of freedom.
We use the three-quadratic-surface parametrization Nix (1968, 1969) to describe macroscopic nuclear shapes in a five-dimensional deformation space. The shape degrees of freedom are a quadrupole-moment parameter , a neck parameter , left- and right-fragment deformation parameters, and , respectively, and a mass-asymmetry parameter . The parameter is the dimensionless quadrupole moment in units of (e2b), where is the proton number and is the nuclear radius. The parameter varies from 0 to 1. Scission, with zero neck radius, corresponds to . The parameter is the Nilsson perturbed-spheroid parameter. Near scission we have to a very good approximation , where and are the volumes of the left and right nascent fragments, respectively. The microscopic single-particle potential is calculated by folding a Yukawa function over the macroscopic shape or “sharp-surface generating volume” Bolsterli et al. (1972).
To study the properties of the compact, mass-symmetric valley, we calculate the five-dimensional potential-energy surface for 258Fm and analyze it by use of the immersion method. Details of the calculation are given in Ref. Möller et al. . The parameters correspond to FRLDM(2002) Möller et al. (2004). For simplicity, we calculate the pairing effect based on the BCS model Möller and Nix (1992). Since we mainly consider scission or near-scission shapes, we can ignore the shape dependence of the Wigner term. We calculate the potential energies at grid points for , , , , and , respectively.
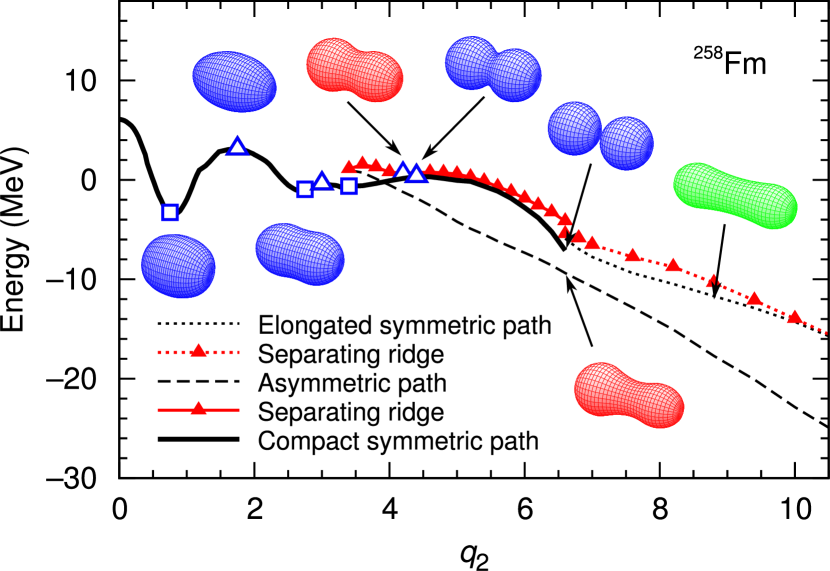
Figure 1 shows some main structures identified by immersion techniques in the calculated potential-energy surface for 258Fm as a function of . The open squares and triangles are minima and optimal saddles between minima, respectively. The energy of the saddle point on the path to compact symmetric fission is 0.34 MeV, while that of the asymmetric fission is 0.58 MeV. The scission point for the compact symmetric fission is at , , and . In the figure, we show the compact symmetric and the asymmetric valleys, denoted by a solid and a dashed line, respectively. Those are separated by a ridge, denoted by a solid line with triangles. We also find a path leading to elongated mass-symmetric divisions, denoted by a dotted line, but its separating ridge to the asymmetric valley, denoted by the dotted line with triangles, vanishes at around , indicating that the scission point of this path strongly depends on the dynamics after going through this valley.
Before we discuss the dependence of the potential energy on mass asymmetry at the compact scission configuration we need to discuss the relation between fragment mass numbers and single-particle energy levels. For this purpose, we calculate the proton density for each single-particle state and the total proton number of the left fragment as a function of . For , the volume of the left fragment is greater than the right fragment. We take and to be 0 in the calculation. If we maintain our restriction to axially symmetric shapes, the proton density for the -th single-particle state is given by , where is the single-particle wave function in the cylindrical coordinate system. The single-proton occupation probability in left of two nascent fragments is thus obtained by
| (1) |
where is at a macroscopic neck radius of 0 fm. The values and (negative) are set sufficiently large that becomes negligible outside the integration intervals. The total proton number is the sum of the single-proton occupation probability from the lowest level to the Fermi level. We also calculate the total proton number taking into account the pairing effect, , given by , where is the occupation probability calculated using the BCS pairing model.
We use two density concepts when we discuss the mass asymmetry in our study. One definition is based on calculating the mass asymmetry from the single-particle densities, the other from the asymmetry of the homogeneous volume defined by the parametrization of the nuclear surface, denoted “microscopic” and “macroscopic”, respectively.
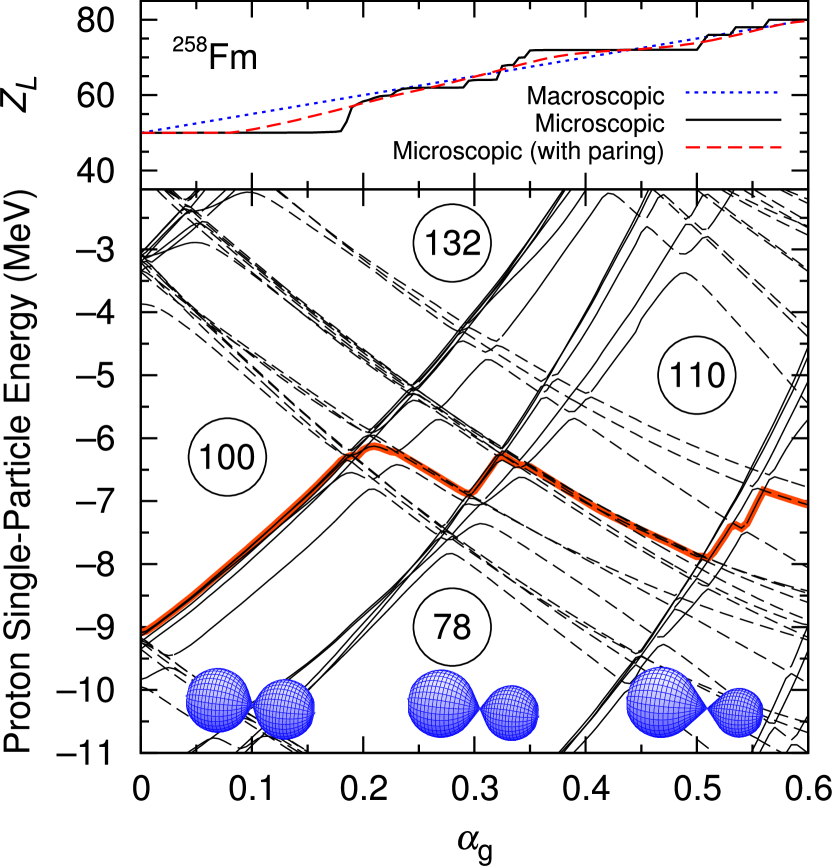
Figure 2 shows important features of our results. The solid and dashed lines in the upper panel of Fig. 2 show the total number of protons without and with the pairing effects, and , respectively. The lower panel of Fig. 2 is a Nilsson diagram versus . The thick gray (red) line is the Fermi level. The energy levels are plotted dashed when more than half the density is in the left part of the potential, solid otherwise [see the insets from (a) to (f) in Fig. 3]. The upper panel shows that in the absence of pairing the total proton number remains constant at in the interval Just below , suddenly jumps to about 60. One can also see such discontinuities at large . Those discontinuities occur where single-particle shell gaps change, that is they coincide with the level crossing points in the Nilsson diagram. It is here the downward-sloping states whose wave functions are localized in the left fragment come below the Fermi level and can be populated with particles transferring from the right fragment. These sudden features are smoothed out when we include the pairing correlation.
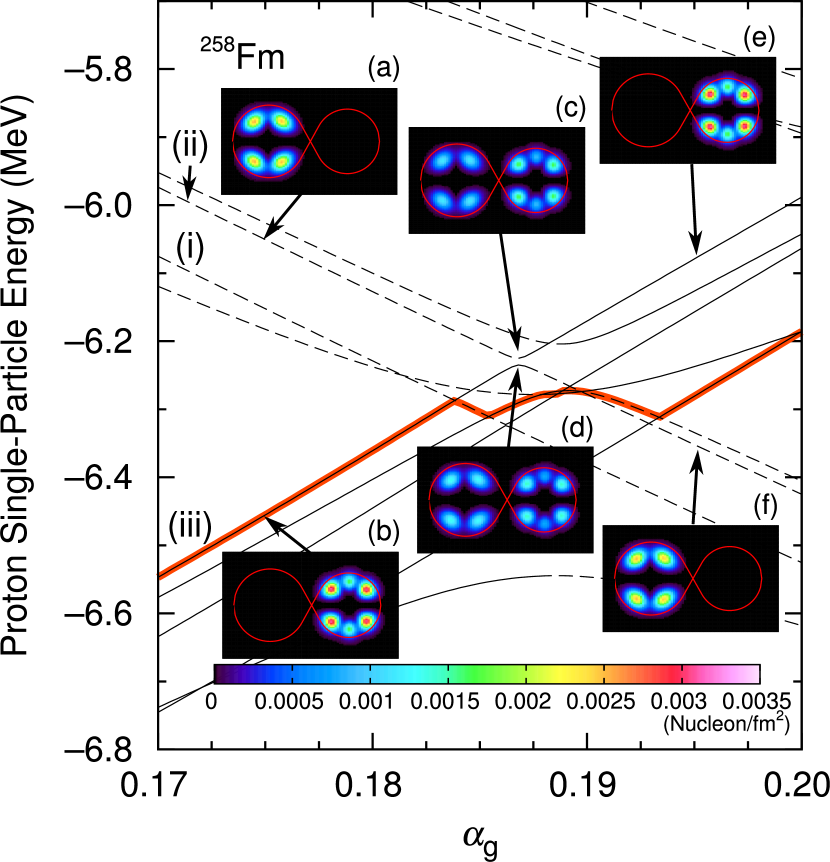
In order to see more clearly how increases we show in Fig. 3 an enlargement of the Fermi-surface region of Fig. 2, with some wave-function densities inserted. In the figure, the downward-sloping state denoted by the line (i), coming from above the Fermi level, dives below the Fermi level. In the case we have here with paired particles, protons can transfer from the right fragment into this previously unoccupied state in the left fragment, which leads to an increase of . In contrast, in the case the particle number is odd then the odd particle can not transfer to a level of different , in a sudden shape change. Rather, the odd particle remains in its level until another level with the same quantum number is encountered, giving rise to a “specialization energy” and an increase in barrier height. This is the mechanism behind the long spontaneous fission half-lives of odd nuclei Newton (1955); Randrup et al. (1973). When a downward sloping level encounters an upward-sloping level of the same quantum number when it crosses the Fermi surface, then a repulsion between the single-particle states occurs. This is the case for the states denoted by (ii) and (iii), which have the same quantum number, , but their wave functions localize on the right- and left fragments, respectively [see the insets (a) and (b) in Fig. 3]. The transfer mechanism in the even, paired system is similar to case (i), but in the single-particle picture it appears different because when these states come close to each other the states mix (“level repulsion”), in this case near [see the insets (c) and (d)]. After the mixing region, the localizations of the wave functions are interchanged [see the insets (e) and (f)], and the lower level remains below the Fermi level, but with a new set of quantum numbers. This microscopic mechanism is responsible for the increase in with increasing .


As shown by the dashed line in the upper panel of Fig. 2, the pairing interaction smooths the change in the fragment proton number versus asymmetry, because it incorporates wave-function admixtures across the single-particle Fermi surface into the sum of the single-proton densities. As a consequence, if the density of states just above a shell gap occurring at the Fermi surface is high, then more closely tracks the macroscopic proton number. At large this condition is particularly well fulfilled and the dashed line is close to the macroscopic density, denoted by the dotted line in the figure. However, we found that from to 0.10, still remains constant at 50 due to the very substantial shell gap, indicating that proton number is extremely stable. We will show below that this stability may to a large part be the mechanism that leads the very narrow fragment mass distribution.
We now calculate the potential-energy curve at the scission configuration in the compact symmetric valley as a function of the fragment mass number. In this first study we take and to be zero in calculating the potential energy and the inertial mass. We have checked this approximation by minimizing the total energy with respect to and with constraints on and a neck radius of 0 fm, as increases. From to 0.1, we found that the minimum energy occurs at and equal zero due to the large spherical shell gap, but abruptly jumps to other valleys near . Inaccuracies due to this approximation can therefore be expected to be fairly insignificant. We calculated the fragment mass number using the single-particle wave functions with the BCS paring effect, before this jump takes place.
Figures 4 (a), (b), and (c) show calculated potential energies as functions of the fragment microscopic proton, neutron, and total mass densities, respectively. These results are given by the solid lines. As a comparison, results versus the macroscopic density are also given, displayed as dashed lines. The potential-energy curves versus the microscopic density rise much more steeply than the curves plotted versus the macroscopic density. In particular, the result versus the proton density depends drastically on the choice of density variable. We therefore expect that the physical origin of the narrow mass distribution is the large shell gap. Below we investigate this hypothesis through a quantitative study.

In order to calculate the mass distribution in the compact symmetric mode, we calculate the zero-point vibration corresponding to the calculated potential-energy curves displayed in Fig. 4, by solving the one-dimensional Schrödinger equation in terms of with a coordinate-dependent inertial mass Lichtner et al. (1973). For the compact symmetric valley, we expect the zero-point vibration to be dominating, because the observed excitation energy of the fission fragments of the nearby 260Md in compact, symmetric fission was extremely low Wild et al. (1990). The Schrödinger equation thus reads
| (2) |
where is the wave function and is the inertial mass in the mass-asymmetric direction .
For the inertial mass, we employ the Inglis-Belyaev formula Brack et al. (1972); Randrup et al. (1976), given by
| (3) |
where is the single-particle Hamiltonian, and are the BCS occupancy and vacancy amplitudes, and is the energy of the quasi-particle state . The term gives the contribution from couplings to the pairing vibrations. We use the finite-difference method to calculate . Figure 5 shows the calculated inertial mass in units of , where MeV is the atomic mass unit. The solid lines with squares and circles show the evaluated first term in the right hand side of Eq. 3 for the neutrons and the protons, respectively. The dashed and dotted lines show the evaluated for neutrons and protons, respectively. The solid line is the sum of those four terms.
We calculate in Eq. 2 using the finite-difference method. The calculated zero-point energy is MeV. The calculated , which is the macroscopic density amplitude, is converted into a mass yield function in terms of fragment microscopic densities through, , where is a renormalization factor. We chose so that the total area of is equal to 0.5, because the component originating from the compact symmetric valley is about 50% of the total yield. This has been estimated from the two-mode analysis of the experimental total kinetic-energy distribution Hulet et al. (1989). The structure of our calculated potential-energy surface is consistent with this assumption, because the calculated height of the saddle point leading to the compact symmetric valley is comparable to that of the asymmetric valley. See also Refs. Möller and Nix (1994); Möller et al. .

Figure 6 shows the macroscopic and microscopic mass-yield curves. The same data are shown as histograms in Fig. 7, so that we can compare directly to the experimental data, which are given in histogram form E. K. Hulet et al. : . In transforming to the histograms, we calculate the average of integrated values of the mass-yield curve for the 4 u interval used in the presentation of the experimental data E. K. Hulet et al. : . The solid and the dashed lines in Fig. 6 correspond to the microscopic and the macroscopic densities, respectively. The calculated peak value is consistent with the experimental one, although a one-dimensional model could have a tendency to overestimate the peak value of the mass-yield curve Lichtner et al. (1973). On the other hand, it is clearly seen that the result of the macroscopic density is not in agreement with the extremely narrow peak of the experimental mass-yield curve. That is, the single-particle configuration, and specifically the large shell gap, is the source of the extremely narrow FWHM of the fragment mass-yield curve. We thus expect that the FWHM of the compact symmetric component is 3.6 u.
In order to obtain the whole mass distribution, it would be necessary to clarify valley structures for all fission paths and superpose their contributions. However, we could not employ our scission-point model to the other valleys, because it was not possible to obtain unique scission points for the asymmetric and elongated symmetric paths. For those paths the separating ridge vanishes before the scission configurations, indicating that these components must be modeled in a more complex dynamical approach.
One may ask how the features we studied here manifest themselves in self-consistent mean-field calculations which have also studied 258Fm. In those models the potential and microscopic densities are “self-consistent”. One could anticipate that perhaps no self-consistent solutions exist for octupole constraints corresponding to the range 0 to 0.18 of in Fig. 2. And when a solution exists there would be a large increase in energy. If these expectations do occur in self-consistent models this behavior would tend to very much restrict the fluctuations in the mass-yield curve, just like in our studies here. However, in the papers Bonneau (2006); Dubray et al. (2008) we find no results that shed light on precisely these issues. But the calculated barrier versus a quadrupole constraint in Bonneau (2006) is very similar to the barrier obtained here. Recently Dubray et al. (2008) looked at correlations between various fission fragment properties of Fm isotopes. These calculations do not clearly identify any fragment shell effect on mass yield widths. This is probably because they were not specifically designed to study such a possibility. In Ref. Dubray et al. (2008), the Hartree-Fock-Bogoliubov method is used to calculate potential-energy surfaces of Fm isotopes along a scission line. The results for the 258Fm potential energy shown in Fig. 7 have quite different shape compared to our Fig. 4(c). In particular the potential shows a very shallow minimum centered at symmetric division. The comparisons of calculated total kinetic energies to data is not very convincing. The substantially different results we obtain are likely due to the very different designs of the two studies, not to the differences between self-consistent and non-selfconsistent models. In our case we study mass oscillations near the exit point of compact scission. In the HFB study energy partitioning along the entire scission line is the mechanism governing the fragment properties. Since that mechanism shows substantial differences with respect to measured data, we feel it is more appropriate to describe origin of the narrow mass distribution in terms of the large shell gap at the barrier exit point, as we do here.
In summary, we have presented potential-energy curves of 258Fm at scission as functions of both macroscopic and microscopic fragment mass densities. We calculated the zero-point vibration corresponding to this potential-energy curve by solving a one-dimensional Schrödinger equation with a coordinate-dependent inertial mass based on the cranking model. An important point in the calculation is that the fragment masses are defined by the single-particle wave functions, rather than the macroscopic potential volumes. We have shown that the mass numbers of two nascent fragments strongly depend on the single-particle configurations. In particular, the proton number of the fission fragments originating from the compact symmetric valley for 258Fm is strongly constrained to due to the large shell gap. The calculated mass-yield curve is consistent with the extremely narrow experimental mass yield curve. We obtain that the FWHM of the fission fragments originating from the compact symmetric valley is 3.6 u. For 258Fm, it would be interesting to measure the ratio of protons to neutrons on the mass yield curve, because the neutron distribution may be wider than the proton distribution, since the mean fragment neutron number is not magic. This would be a very strong test of the mechanism behind the narrow mass distribution.
Acknowledgements.
TI is grateful for the Special Postdoctoral Researcher Program in RIKEN. The numerical calculations have been performed at the RSCC system, RIKEN. PM would like to acknowledge that this work was carried out under the auspices of the National Nuclear Security Administration of the U.S. Department of Energy at Los Alamos National Laboratory under Contract No. DE-AC52-06NA25396 and was also supported by a travel grant to JUSTIPEN (Japan-U.S. Theory Institute for Physics with Exotic Nuclei) under grant number DE-FG02-06ER41407 (U. Tennessee).References
- Hoffman et al. (1980) D. C. Hoffman, J. B. Wilhelmy, J. Weber, W. R. Daniels, E. K. Hulet, R. W. Lougheed, J. H. Landrum, J. F. Wild, and R. J. Dupzyk, Phys. Rev. C 21, 972 (1980).
- Hulet et al. (1986) E. K. Hulet, J. F. Wild, R. J. Dougan, R. W. Lougheed, J. H. Landrum, A. D. Dougan, M. Schadel, R. L. Hahn, P. A. Baisden, C. M. Henderson, et al., Phys. Rev. Lett. 56, 313 (1986).
- Hulet et al. (1989) E. K. Hulet, J. F. Wild, R. J. Dougan, R. W. Lougheed, J. H. Landrum, A. D. Dougan, P. A. Baisden, C. M. Henderson, R. J. Dupzyk, R. L. Hahn, et al., Phys. Rev. C 40, 770 (1989).
- Zhao et al. (1999) Y. L. Zhao, I. Nishinaka, Y. Nagame, M. Tanikawa, K. Tsukada, S. Ichikawa, K. Sueki, Y. Oura, H. Ikezoe, S. Mitsuoka, et al., Phys. Rev. Lett. 82, 3408 (1999).
- Zhao et al. (2000) Y. L. Zhao, Y. Nagame, I. Nishinaka, K. Sueki, and H. Nakahara, Phys. Rev. C 62, 014612 (2000).
- Britt et al. (1984) H. C. Britt, D. C. Hoffman, J. van der Plicht, J. B. Wilhelmy, E. Cheifetz, R. J. Dupzyk, and R. W. Lougheed, Phys. Rev. C 30, 559 (1984).
- Hoffman and Lane (1995) D. C. Hoffman and M. R. Lane, Radiochim. Acta 70/71, 135 (1995).
- Möller et al. (1987) P. Möller, J. R. Nix, and W. J. Swiatecki, Nuclear Physics A 469, 1 (1987).
- Pashkevich (1988) V. V. Pashkevich, Nucl. Phys. A 477, 1 (1988).
- Möller et al. (1989) P. Möller, J. R. Nix, and W. J. Swiatecki, Nuclear Physics A 492, 349 (1989).
- Ćwiok et al. (1989) S. Ćwiok, P. Rozmej, A. Sobiczewski, and Z. Patyk, Nucl. Phys. A 491, 281 (1989).
- Möller and Nix (1994) P. Möller and J. R. Nix, J. Phys. G: Nucl. Part. Phys. 20, 1681 (1994).
- Möller et al. (2001) P. Möller, D. G. Madland, A. J. Sierk, and A. Iwamoto, Nature (London) 409, 785 (2001).
- Bonneau (2006) L. Bonneau, Phys. Rev. C 74, 014301 (2006).
- Staszczak et al. (2007) A. Staszczak, J. Dobaczewski, and W. Nazarewicz, Acta Phys. Pol. B 38, 1589 (2007).
- Warda et al. (2002) M. Warda, J. L. Egido, L. M. Robledo, and K. Pomorski, Phys. Rev. C 66, 014310 (2002).
- Dubray et al. (2008) N. Dubray, H. Goutte, and J.-P. Delaroche, Phys. Rev. C 77, 014310 (2008).
- Vandenbosch and Huizenga (1973) R. Vandenbosch and J. R. Huizenga, Nuclear fission (Academic Press, INC., London, 1973).
- Bolsterli et al. (1972) M. Bolsterli, E. O. Fiset, J. R. Nix, and J. L. Norton, Phys. Rev. C 5, 1050 (1972).
- Möller et al. (1995) P. Möller, J. R. Nix, W. D. Myers, and W. J. Swiatecki, At. Data Nucl. Data Tables 59, 185 (1995).
- Nix (1968) J. R. Nix, University of California Radiation Laboratory Report UCRL-17958 (1968).
- Nix (1969) J. R. Nix, Nucl. Phys. A130, 241 (1969).
- (23) P. Möller, A. J. Sierk, T. Ichikawa, A. Iwamoto, R. Bengtsson, H. Uhrenholt, and S. Åberg, to be published.
- Möller et al. (2004) P. Möller, A. J. Sierk, and A. Iwamoto, Phys. Rev. Lett. 92, 072501 (2004).
- Möller and Nix (1992) P. Möller and J. R. Nix, Nucl. Phys. A 536, 20 (1992).
- Newton (1955) J. O. Newton, Prog. Nucl. Phys. 4, 234 (1955).
- Randrup et al. (1973) J. Randrup, C. F. Tsang, P. Möller, S. Nilsson, and S. E. Larsson, Nucl. Phys. A217, 221 (1973).
- Lichtner et al. (1973) P. Lichtner, D. Drechesel, J. Maruhn, and W. Greiner, Phys. Lett. 45B, 175 (1973).
- Wild et al. (1990) J. F. Wild, J. van Aarle, W. Westmeier, R. W. Lougheed, E. K. Hulet, K. J. Moody, R. J. Dougan, E.-A. Koop, R. E. Glaser, R. Brandt, et al., Phys. Rev. C 41, 640 (1990).
- Brack et al. (1972) M. Brack, J. Damgaard, A. S. Jensen, H. C. Pauli, V. M. Strutinsky, and C. Y. Wong, Rev. Mod. Phys. 44, 320 (1972).
- Randrup et al. (1976) J. Randrup, S. E. Larsson, P. Möller, S. G. Nilsson, K. Pomorski, and A. Sobiczewski, Phys. Rev. C 13, 229 (1976).
- (32) E. K. Hulet et al. :Data file EXFOR-13191.002 dated 1998-08-01, compare Phys. Rev. C 40, 770 (1989). EXFOR data received from the IAEA Nuclear Data Section, Vienna.