11email: jdebuizer@sofia.usra.edu 22institutetext: Gemini Observatory, Casilla 603, La Serena, Chile 33institutetext: National Research Council of Canada, 5071 W. Saanich Rd, Victoria, BC V9E 2E7, Canada 44institutetext: School of Physics, University of New South Wales, Sydney, 2052 NSW, Australia 55institutetext: Australia Telescope National Facility, CSIRO, PO Box 76 Epping, NSW 1710, Australia
SiO Outflow Signatures Toward Massive Young Stellar Objects with Linearly Distributed Methanol Masers
Abstract
Context. Methanol masers are often found in linear distributions, and it has been hypothesized that these masers are tracing circumstellar accretion disks around young massive stars. However, recent observations in H2 emission have shown what appear to be outflows at similar angles to the maser distribution angles, not perpendicular as expected in the maser-disk scenario.
Aims. The main motivation behind the observations presented here is to determine from the presence and morphology of an independent outflow tracer, namely SiO, if there are indeed outflows present in these regions and if they are consistent or inconsistent with the maser-disk hypothesis.
Methods. For ten sources with H2 emission we obtained JCMT single dish SiO (6–5) observations to search for the presence of this outflow indicator. We followed up those observations with ATCA interferometric mapping of the SiO emission in the (2–1) line in six sources.
Results. The JCMT observations yielded a detection in the SiO (6–5) line in nine of the ten sources. All of the sources with bright SiO lines display broad line wings indicative of outflow. A subset of the sources observed with the JCMT have methanol maser velocities significantly offset from their parent cloud velocities, supporting the idea that the masers in these sources are likely not associated with circumstellar disks. The ATCA maps of the SiO emission show five of the six sources do indeed have SiO outflows (the only non-detection being the same source that was a non-detection in the JCMT observations). The spatial orientations of the outflows are not consistent with the methanol masers delineating disk orientations. Overall, the observations presented here seem to provide further evidence against the hypothesis that linearly distributed methanol masers generally trace the orientations of circumstellar disks around massive young stars.
Key Words.:
stars: formation – stars: early type – ISM: jets and outflows – circumstellar matter – molecular data – masers – line: profiles – infrared: ISM – radio continuum: ISM – radio lines: ISM1 Introduction
Our understanding of star formation, despite decades of research, is still quite limited. The development of a reasonably detailed model of isolated low mass star formation through core accretion onto a disk (Shu, Adams, & Lizano 1987), which has recently been reviewed by Arce et al. (2007), has been guided by extensive observations of nearby protostars. However, there are problems when modeling the formation of the highest mass stars with core accretion - most notably the effects of radiation pressure which may inhibit further accretion once the star has accreted 10 M⊙. Since stars more massive than 10 M⊙ do exist, and since they tend to form in the middle of dense clusters, the idea has been proposed that massive stars form through a process of coalescence of low mass stars or protostars (e.g., Bonnell, Bate & Zinnecker 1998) or through a process of “competitive accretion” (e.g., Bonnell et al. 2001; Bonnell & Bate 2006) within the cluster. However, recent modeling by several authors (e.g., McKee & Tan 2002, 2003; Krumholz, McKee, & Klein 2005) has shown that despite all the alleged problems, the highest mass stars may indeed be formed theoretically in a scaled-up version of low-mass star formation via core accretion onto disks. However, it is not known with certainty if massive stars form in this way because direct imaging of the accretion disks that are hypothesized to be feeding very young B and O type stars is very difficult.
Several factors complicate the observational problem. First, regions of massive star formation lie at distances of typically a few to 10 kpc away, making it harder to resolve spatial detail than for low mass star forming regions where there are many examples (e.g., Taurus) that are much less than 1 kpc away. Second, the earliest stages of massive star formation are difficult to observe because they occur extremely rapidly, and furthermore occur in the most obscured regions of giant molecular clouds. There are still no directly imaged accretion disks confirmed to exist around a star of spectral type B2 or earlier.
Despite these difficulties, it is relatively easy to find massive young stellar objects (YSOs) at a phase just prior to the formation of an UC HII region, because they often excite methanol maser emission in the surrounding molecular gas. Surveys of methanol maser emission by Norris et al. (1998) and Walsh et al. (1998) found numerous massive YSOs scattered along the Galactic Plane, and subsequent studies (see for example Minier et al. 2003, Walsh et al. 2003, and Ellingsen 2008) confirm that methanol masers are reliable indicators of massive star formation. Walsh et al. (1998) note that methanol maser activity may fade out as the UC HII develops, indicating that this is a transitory phase tracing mainly the earliest stages of massive star formation when accretion is thought to be occurring.
Approximately half of the sources with methanol maser emission display this emission as a grouping of many discrete maser “spots” arranged in a roughly linear structure as projected on the sky. Norris et al. (1998) hypothesized that these masers are excited in edge-on accretion disks surrounding the stars at the center of the massive YSOs. The surprisingly large fraction of edge-on disks was attributed in large part to the longer path lengths within the disk for maser amplification compared to the path lengths in more face-on systems. Velocity gradients that are only occasionally present along the line of maser spots (12% according to Walsh et al. 1998) are thought to be suggestive of rotating disks. A theory of how masers could be excited in an accretion disk has been developed by Durisen et al. (2001). There is some observational evidence from individual sources that methanol masers may indeed be excited in disks. For example, Bartkiewicz et al. (2005) have found a ring-like structure of methanol masers around the candidate high-mass YSO G23.657-0.127. Observations of methanol maser regions at higher resolution with VLBI and the VLBA (e.g., NGC 7538 IRS 1, Pestalozzi et al. 2004) have shown linear structures also exist at smaller scales (0.01-0.2), some of which have velocity structures consistent with an edge-on Keplerian disk. However, only a small number of these sources have been studied in detail, and they may or may not be related to the larger (0.3-1.5) linear distributions we are studying here. More recent evidence of the maser-disk connection comes from Pillai et al. (2006), who interpret the line of methanol masers associated with a massive YSO in the infrared-dark cloud G11.110.12 as evidence for an accretion disk driving an outflow traced by H2O maser emission.
There are, however, both observational and theoretical reasons to question whether the methanol masers are actually excited in the accretion disks around massive YSOs in general, even in the cases where the maser spots have a linear distribution. Observationally, Walsh et al. (1998), in a major survey of methanol maser sources, concluded that the maser emission from the majority of the sources with linear distributions of maser spots was not likely to have arisen in disks. Alternative models generally invoke shocks. Dodson, Ojha, & Ellingsen (2004) have shown that externally driven planar shocks moving through the molecular gas can reproduce many of the observed properties when viewed edge-on. Even Bartkiewicz et al. (2005) have considered whether the ring of maser spots in G23.657-0.127 might be better explained by a spherical shock encountering a planar structure in the molecular gas, rather than a disk around the massive young stellar object itself.
In this paper we will refer to the hypothesis that the linearly distributed methanol masers are being excited in an edge-on accretion disk around a massive YSO as the maser-disk hypothesis, and we explicitly note that our data only include methanol maser sources that are linearly distributed on the sky with arcsecond scales (0.3 to 1.5), due to the numerous studies of these sources at these spatial scales.
Although accretion disks have been difficult to observe unambiguously, an active accretion disk should still reveal its presence by driving bipolar outflows into the surrounding medium, and these are often easier to detect and characterize. The bipolar outflow emerges along the axis of rotation perpendicular to the plane of the accretion disk. Lee et al. (2001) were the first to observe H2 (10) S(1) emission near three methanol maser sources. They concluded that the H2 emission most likely arises in terminal shocks at the tips of high-speed bipolar outflows and that the orientation of the line of methanol masers for one source (IRAS 16076-5134) was consistent with the masers being excited in an edge-on accretion disk that could be driving the outflow responsible for the H2 emission. In a larger study of 28 sources specifically chosen to have linear distributions of methanol masers, De Buizer (2003) tried to test the maser-disk hypothesis by searching for outflows perpendicular to the methanol maser distributions. He obtained wide-field images of the sites of linearly distributed methanol masers using the 2.12 m H2 () S(1) line as the outflow diagnostic. H2 emission from potential outflows were found to be aligned perpendicular to the maser distribution (as would have been expected under the maser-disk hypothesis) in only 2 of the 28 cases. Surprisingly, the emission was distributed within 45∘ of parallel in 12 of the 15 fields where H2 emission was detected and thought to be outflow related. It was therefore suggested that the methanol masers in these sources do not delineate circumstellar disks, but may have some relationship to the outflows, as Moscadelli et al. (2002) found.
The interpretation of the results from De Buizer (2003) remains ambiguous because 2.12 m H2 line emission can be excited both by outflow shocks and by radiative UV excitation and cascade. In fact, a subset of the sources in that survey showed clear signs of H2 emission associated with radiative excitation from nearby dusty star-forming centers. Of the 15 sources in that survey where the H2 emission was deemed to be not associated with radiative excitation, the overall morphologies of the emission did not resemble the simple bipolar outflows seen around young, low-mass stars. Consequently, without additional evidence, it could not be conclusively ascertained which mechanism is stimulating the H2 emission near these massive YSOs, nor definitively link the alleged outflows to the methanol masers.
We therefore undertook a series of observations of these sources in a set of independent outflow indicators. Our primary outflow tracer was thermal emission from SiO that is liberated from grains and excited into emission behind strong shocks. SiO can be a useful shock tracer because its abundance is enhanced by factors of up to 106 behind strong shocks within a high-speed outflow or along its immediate boundary (Avery & Chiao 1996; Dutrey, Guilloteau, & Bachiller 1997; Arce et al. 2007). Emission from more volatile molecules such as methanol and SO are also enhanced by shocks as the higher temperatures liberate molecules frozen onto grains, but these molecules are also commonly present in the molecular gas of the ambient cloud and especially in the hot cores surrounding massive YSOs. Emission from these molecules typically arises in a dense shell surrounding the outflow cavity and may indicate a wider outflow angle than the SiO emission. The wings of these lines can be useful indicators of high-speed outflows, but the line cores are better indicators of conditions in the ambient gas. By choosing our molecular transitions appropriately, we can therefore get a graduated set of probes. H2 spots trace bow shocks on the tips of high-speed outflows. SiO emission will trace the high-speed outflows responsible for exciting the H2 spots. SO and thermal methanol emission serve as secondary indicators of the outflows (in the line wings) and also measure the properties of the hot cores surrounding the massive YSO.
In the rest of this paper, we will describe the single dish observations we have obtained using the JCMT in the SiO () line to detect the presence of SiO in selected sources from the H2 survey of De Buizer (2003). We will also describe the follow-up interferometric observations with the ATCA in the SiO () line, used to map the SiO outflows from a subsample of those JCMT targets. We will show that there are indeed outflows from these sources but that they are not orthogonal to the linear distributions of methanol masers. That, and other evidence presented, create a serious problem for the hypothesis that linearly distributed methanol masers generally arise in, and define the orientation of, circumstellar disks.
2 Observations
2.1 The JCMT SiO(6–5), SO, and CH3OH Observations
JCMT observations of the SiO transition at 260.51802 GHz were made in service mode during the 2005A (February to July) observing semester, with data being taken on April 2, 3, 4, 12, May 3, 8, and July 13. The sources observed with JCMT are listed in Table 1. The observations were taken with the receiver RxA3. At this frequency the beam size is 18.4.
Since it was recognized that the SiO lines might be very weak, that the source elevations would never be very high, and that the velocities of the molecular clouds were often unknown, the observations were designed to distinguish weak, wide SiO lines from irregularities in the spectral baseline. We chose to observe the SiO – line at 260.51802 GHz, which would allow us to observe simultaneously the SO ( – ) at 261.84368 GHz and CH3OH ( – ) at 261.80570 GHz. To this end, a custom observing mode was developed by the JCMT staff that split the correlator into two sections centered on the SiO and SO lines, the latter spectrum also covering the CH3OH line, with an offset equivalent to 42 km/s.
All three of these molecules are expected to have enhanced abundance behind shocks where high temperatures liberate molecules from the icy mantles of grains. Much higher temperatures are required to create significant quantities of SiO, so in the cold gas near low-mass protostars SiO is an excellent tracer of high-speed shocks (Arce et al. 2007).
Calibration of data taken with RxA3 at this frequency is unusually difficult, with a systematic error of about 25% that varied from night-to-night. With an appropriate choice of sideband, however, the sensitivity of the receiver was not impaired. The correct sideband was determined each night from observations of the sources IRAS 16293-2422 and L1157. In this paper, we only use the spectra to determine the kinematics of the molecular cloud and outflowing gas, which does not require accurate calibration of the temperature scale.
The data were reduced using the Starlink SPECX package, rebinning the data to 0.5 km/s resolution. Position-switched observations with a single-detector receiver like RxA cannot be used to measure the continuum emission from any but the brightest sources, because the continuum signal is dominated by fluctuations in the atmospheric transmission between the on-source and off-source integrations. Also, on physical grounds we expect that continuum emission from dust will normally be several orders of magnitude weaker than optically thick line emission in most astrophysical sources. A linear baseline has therefore been subtracted from all of the spectra shown in Figures 1 and 2, taking care not to fit the baselines to parts of the spectra with apparent emission in the line wings, and Table 1 does not include any estimate of the continuum emission at 1.2 mm. It is notable that none of our spectra show systematically negative signals, indicating that the baseline fits are good in spite of the challenging observational circumstances, and that even the weak, extended line wings are believable in the spectra.
There were 15 sources in the survey of De Buizer (2003) where H2 was detected and not ruled out as unrelated to outflow. Of those, only one source could not be reached with the JCMT because of its large southern declination (G305.21+0.21). Therefore our original source list for the JCMT comprised the remaining 14 sources but required only 12 pointings since there were two pairs of sources too close to separate with the JCMT beam (G345.01+1.79/G345.01+1.80 and G321.031-0.484/G321.034-0.483). Final observations were for 10 pointings since weather and time constraints prevented observations for 2 of the 12 pointings (G321.031-0.484/G321.034-0.483 and G313.77-0.86).
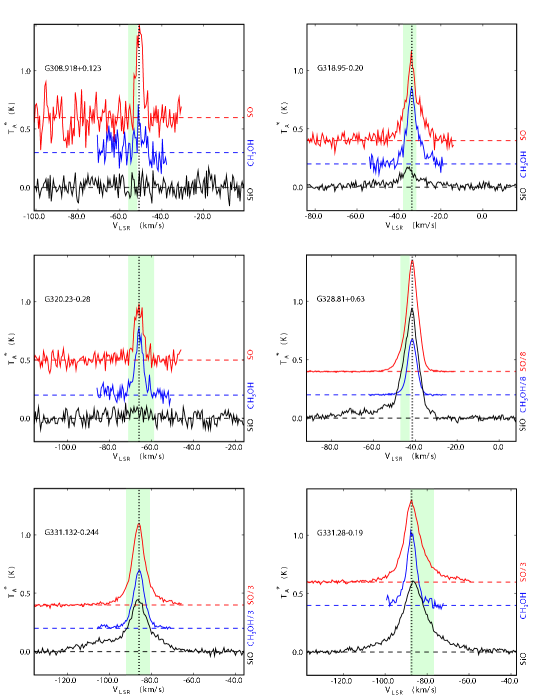
Table 1 lists the line properties of all ten sources observed in the JCMT survey. Plots of the spectra obtained are shown in Figures 1-2. Since most of the lines have significant wings, the systemic velocity reported in Table 1 is simply the velocity of the peaks of the SO and CH3OH lines, shown in Figure 1 and 2 as the vertical dashed line. These values were checked against other molecular species not affected by outflow (i.e., NH3, CH3CN), and the line-of-sight velocities were very similar in all cases where data was available (e.g. Longmore et al. 2007, Purcell et al. 2006). The velocity width in Table 1 was determined by a visual inspection of where the line wings reached zero intensity. This number may be significantly underestimated for the CH3OH line because the blue wing of that line often blends with the red wing of the SO line, and because the red wing may be cut off by both the edge of the spectrum and the baseline fit. The integrated intensity given in Table 1 is a simple summation of the measured intensity between the zero-intensity limits multiplied by the channel spacing . The formal RMS error in each pixel was estimated from an empty part of the spectrum and the formal RMS error of was calculated from . For the weaker lines, this error estimate can be used to determine the signal-to-noise of the detection, but it does not include the calibration error that could be as large as 25%.
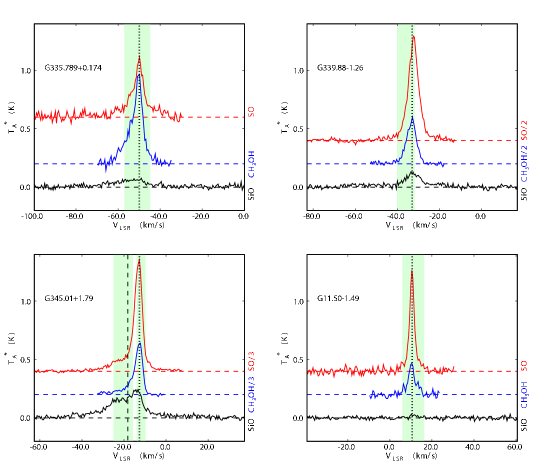
Of the ten sources observed only G308.918+0.123 yielded a non-detection in the SiO line. G308.918+0.123 was observed in the wrong sideband, resulting in an effective system temperature four times worse than normal and yielding the rather noisy spectra in Figure 1. Even here, integrating the SiO signal over the velocity range of the SO line yields 0.300.13, i.e. a formal significance of 2.3 . This is suggestive but not a formal detection, so we only claim a formal 3 upper limit of 0.4 K km/s in Table 1. In addition, the weakest detected source, G11.50-1.49, may be considered marginal with a formal significance of only 4 (Figure 2). Since the average detection rate of SiO in outflows around low-mass protostars is only 50% (Codella, Bachiller, & Reipurth 1999), this is a notably high detection rate.
2.2 The ATCA SiO (2–1) and 3mm Continuum Observations
The ATCA observations in the SiO (86.8469 GHz) line were taken on 2006 September 12-13. The compact, H75 array configuration (baselines of 31 to 86 m) was used with 5 antennae in both east-west and north-south baselines to allow for snapshot imaging. The primary and synthesized beam sizes (field of view and angular resolution) were 33 and 7, respectively. The correlator setting was used, providing 128 channels across 64 MHz (221 km s-1) bandwidth for a velocity resolution of 1.7 km s-1. Only 6 of the 10 fields observed with the JCMT were observed with the ATCA because of time constraints. The fields observed with the ATCA are given in Table 2. Each field was observed for 8-9 10 min cuts separated over 6 h. A bright ( 1.5 Jy), close, phase calibrator was observed for 3 min before and after each cut. PKS 1253-055 and Mars were used as the bandpass and flux calibrator for all the observations.
The data were reduced using the MIRIAD (see Sault, Tueben & Wright 1995) package. Bad visibilities were flagged, edge channels removed and the gain solution from the calibrator applied to the source. The visibilities were Fourier transformed to form image cubes and CLEANed to remove the sidelobes of the synthesized beam response. Continuum emission was extracted by fitting a low-order polynomial to the line-free channels and imaged in the same way. The noise characteristics and detected line and continuum flux densities are listed in Table 2.
We were awarded enough time to observe 6 of our 10 JCMT sources with the ATCA. We chose G328.81+0.63, G331.28-0.19, G331.132-0.244 because they were the three strongest SiO (6–5) detections at the JCMT. G308.918+0.123, G318.95-0.20, and G320.23-0.28 were chosen because they were the three most impressive sources of H2 emission from De Buizer (2003).
2.3 The Gemini T-ReCS Mid-IR Observations
Sources G318.95-0.20, G328.81+0.63, and G331.28-0.19 were also observed with the Thermal Region Camera and Spectrograph (T-ReCS) at the Gemini Telescope in Chile on 2005 April 19. All three sources were observed using the Si-5 (c=11.7 m, =1.1 m) filter and Qa filter (c=18.3 m, =1.6 m), with on-source exposure times of 108s for both filters. T-ReCS utilizes a Raytheon 320240 pixel Si:As BIB array which is optimized for use in the 7–26 m wavelength range. The pixel scale is 0.089/pixel, yielding a field of view of 288216. Sky and telescope radiative offsets were removed using the standard chop-nod technique.
Co-added frames were saved every 10 sec, and the telescope was nodded every 30 sec. The co-added frames were examined individually during the data reduction process and those plagued by clouds (i.e., showing high and/or variable background or decreased source flux) were discarded. The T-ReCS observations were made under partly cloudy skies, and most of the images had to have some frames removed. Final effective exposure times of the images varied from 30 to 80s on-source.
Flux calibration of the final images was difficult given the variable observing conditions. Standard stars were observed at similar airmasses to the science targets, and the derived calibration factors varied by 20% among them. All three maser fields have been previously observed at the CTIO 4-m by De Buizer, Piña, & Telesco (2000) with a spatial resolution coarser by a factor of two. However, a comparison of the derived flux densities from the T-ReCS to the CTIO data show that they agree to within 20%. Therefore we will not quote here new flux density values for any of the sources already detected by De Buizer, Piña, &Telesco (2000) since those values will be more accurate. We will only quote T-ReCS flux densities for any new sources detected in these same fields.
3 Results
3.1 General Results from the JCMT Observations
Sufficiently sensitive transitions of outflow tracers like SiO, SO and thermal methanol should show the lines to have wide wings from gas entrained in the outflow. As can be seen in Figures 1-2, all sources with strong detections display line wings in the SiO line. The SO and CH3OH lines show similar line wings, although they are relatively weaker and narrower than the wings of the SiO line, as was expected. This behavior is characteristic of emission from outflows. The green regions plotted in each of the panels in Figures 1-2 show the velocity ranges of the methanol masers that are linearly distributed and associated with each source.
It is always possible that a source can have apparent line wings due to unrelated sources in the beam at different local standard of rest velocities. In this case one would expect similar structure in all three lines, SiO, SO and CH3OH. This is apparently the case for G345.01+1.79 (see Figure 2), where there is a very prominent blue shoulder in all three lines. In this case the JCMT beam includes G345.01+1.80, another massive young stellar object 15 away from G345.01+1.79. As shown in the figure, the velocity range of the methanol maser emission is [-14.0, -10.0] km s-1 for G345.01+1.80 and is [-25.0, -16.0] km s-1 for G345.01+1.79 matching the two emission peaks that are seen in all three lines observed with the JCMT. The primary peak in SiO in Figure 2 is caused by G345.01+1.80, and the secondary peak by G345.01+1.79. In addition, there appears to be a very broad blue wing to this double line, indicating that one or both sources has an outflow.
The near-ubiquity of the wide line wings and especially of SiO emission in these spectra indicates that powerful outflows driving strong shocks are present within the JCMT beam for most of these targets. Taken by itself, this appears to support the interpretation of De Buizer (2003) that the H2 emission near these sources are being excited in the bow shocks of outflows. We will revisit this issue in sections 4.1 and 4.2, after considering the rest of the evidence.
3.2 Results from the ATCA and T-ReCS observations
To follow up the JCMT single dish observations we endeavored to map the SiO emission from these regions to verify the outflow nature of the emission, and observe the outflow geometries with respect to the methanol maser distribution angles. Observations with the JCMT of SiO (6–5) emission at 260.5 GHz have previously been used to detect low-mass YSO outflows in infrared-dark cloud cores (Feldman et al. 2004). Subsequent BIMA observations of SiO (2–1) at 86.8 GHz from four of these sources verified that the emission arises from bipolar outflows (R. Redman, priv. communication). Therefore, to map out the outflows from our southern hemisphere targets, we went to the ATCA to similarly map out the SiO emission in the (2–1) transition.
Projection effects should be unimportant under the maser disk hypothesis, because the disks are selected to be edge-on. Thus, the maser-disk hypothesis makes the clear prediction that outflows traced by SiO emission and H2 emission spots should be on average orthogonal to the disks traced by the maser emission. Even allowing for precession of the inner accretion disk and for outflows with significant opening angles, we would expect the majority of outflow tracers to be found within 45∘ of perpendicular to the orientation of the disk, and hence perpendicular to the line of maser spots.
Furthermore, if the methanol masers do indeed exist in actively accreting disks, all such disk sources should display outflow. Unlike low-mass stars, massive stars are not believed to have a long period after accretion where their disks are passive. The environment of massive stars is so caustic (i.e. photo-ionization, radiation pressure, winds), that as soon as accretion halts, the timescale for dispersal of the disk is very short (104 yrs; Blum et al. 2004, Shen & Lou 2006).
Geometrically, we can verify that the outflow traced by SiO emission is driven by the massive YSO by noting whether the patches of SiO emission are colinear with the location of the massive YSO. Under the maser-disk hypothesis, the massive YSO should be spatially coincident with the methanol maser spots because of the very high MIR intensities required to excite the methanol masers (Sobolev & Deguchi 1994, Sobolev et al. 1997). In other outflows where SiO is observed it is excited primarily behind a small number of strong shocks that are propagating along the outflows, so in our sources we expect that the morphology of the SiO emission will consist of discrete bright spots along the outflow marking the locations of the strongest shocks rather than a continuous line; under such conditions colinearity of the SiO emission with the massive YSO/masers is the best that can be established by the observations. If the SiO emission lobes are not colinear with the masers, then the outflow must originate in a different star.
In the following subsections, we will discuss the ATCA and T-ReCS observations and results on a source-by-source basis in the context of the maser-disk hypothesis. Since many of these targeted regions have been observed here for the first time at these wavelengths and resolutions, there are several results that are not directly associated with the main theme of this work. These results are summarized in the Appendix. A summary of observational properties for each target is listed in Table 3, showing results derived from our new data and from the literature.
3.2.1 G308.918+0.123 (IRAS 13395-6153)
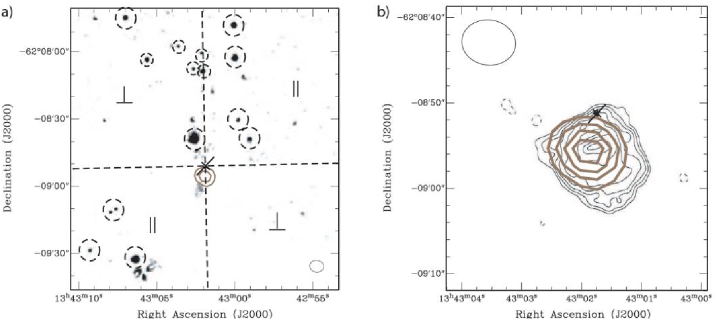
G308.918+0.123 has the most impressive collection of H2 knots in the entire survey of De Buizer (2003), spread out over a 12080 area (Figure 3a). The vast majority of H2 spots are contained within regions 45∘ from parallel with respect to the methanol maser distribution. The 8.6 GHz radio continuum observations of Phillips et al. (1998) show the linear distribution of four maser spots lie on the northern edge of a 1515 arcsec2 UC HII region (Figure 3b).
This target was a formal non-detection in the JCMT SiO (6–5) survey, but was accidentally observed in the wrong sideband, resulting in a much higher noise level than other observations with comparable integration times. The observation is still adequate to show that the integrated emission of the SiO line is weaker for this source than for any of the other targets except G11.50-1.49. Given the interesting nature of the H2 emission, we observed this target with the ATCA. However, no SiO (2–1) was detected on the field with the ATCA, though a bright (49 mJy) unresolved 3mm continuum source was detected with a peak 5 from the methanol maser location and coincident with the cm UC HII region (Figure 3b).
Since there was no SiO detection we can draw no further conclusions about the maser-disk hypothesis with respect to this source, other than saying that further observations will be needed in other outflow indicators to see if there really is an outflow at this location as indicated by the H2 emission. However, a confirmed lack of any outflow would also be counter to the maser-disk hypothesis since all of these sources are likely to be actively outflowing if they have accretion disks with masers in them.
3.2.2 G318.95-0.20
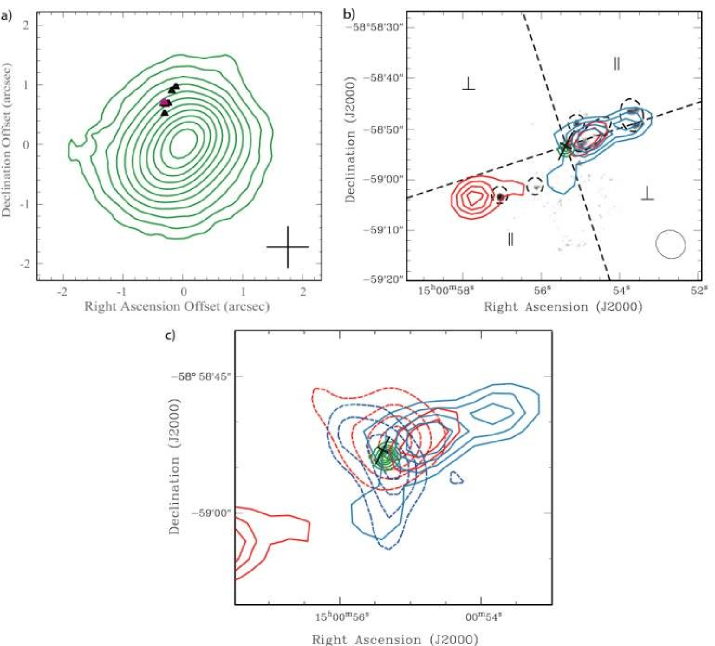
The methanol maser emission for this target consists of seven maser spots in a linear pattern spanning 0.5. There is a semi-ordered velocity gradient along the spot distribution (Norris et al. 1993). Seen in Figure 4b, knots of H2 emission, as well as some diffuse H2 emission was found at this site (De Buizer 2003). The maser location is coincident with a bright near-IR continuum source (De Buizer 2003), that was also detected in the mid-IR (De Buizer, Piña, & Telesco 2000) and re-imaged here with T-ReCS at higher angular resolution (Figure 4a, A.2).
The outflow maps obtained with the ATCA show the SiO emission to be coincident with the H2 emission on this field (Figure 4b) thereby confirming the outflow nature of the H2 emission suggested by De Buizer (2003). However, this region may be too complicated to be modeled adequately with just a single outflow (however, see A.2). In addition to the red-shifted velocity component to the northwest of the maser sources, there is a blue-shifted component to the southwest, on the side dominated by red-shifted emission. These two components can reasonably be attributed to a second outflow from a second source.
The HCO+ emission contours for this source from Minier et al. (2004) are shown in Figure 4c. Since the blue-shifted component of the HCO+ emission coincides with the second blue-shifted component of the SiO emission, the HCO+ emission may be dominated by the second outflow. If so, it seems to be oriented more nearly north-south, and is even more closely parallel to the line of methanol maser spots than the main outflow.
Minier et al. (2004) detect an unresolved source of thermal CH3OH emission coincident with the HCO+ red-shifted emission peak, which they claim may be the hot molecular core exciting the HCO+ outflow. The peak of this CH3OH core is offset 2 to the northwest of the methanol maser location and further offset from the mid-infrared source. Therefore it appears that this region has two outflows with slightly different position angles and with opposite senses of outflow direction, one apparently centered on the mid-infrared emission and the other on a nearby hot molecular core.
The simplest interpretation of this region is that the massive YSO responsible for exciting the methanol masers is also likely driving a high-speed outflow traced by the brightest part of the SiO emission, and that this outflow is responsible for most if not all of the H2 emission spots. A second, smaller outflow is also likely to be present in the field that may be contributing significantly to the HCO+ emission. Both of the outflows are aligned within 45 degrees of parallel to the line of methanol maser spots, and their orientations are both inconsistent with the scenario that the methanol masers are tracing the orientation of a circumstellar disk.
3.2.3 G320.23-0.28 (IRAS 15061-5814)
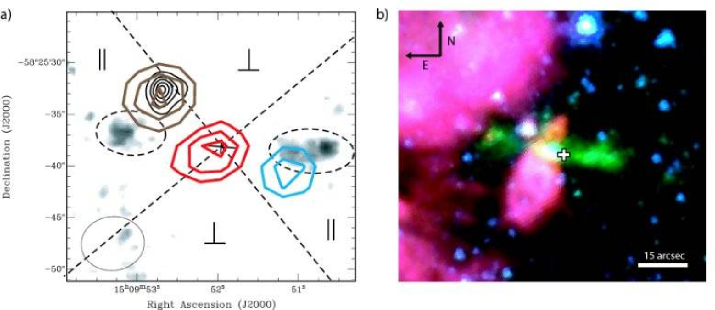
There are ten methanol maser spots in the linear distribution associated with G320.23-0.28, spread out over 0.5 and at an angle of 86∘. In De Buizer (2003), it is explained that the H2 emission from this source most closely resembles a bi-lobed outflow morphology. Also, the H2 emission is situated exactly parallel to the position angle of the methanol maser distribution. In De Buizer (2003) this source was considered to be the best candidate for further observations in disproving the circumstellar disk hypothesis for linearly distributed methanol masers.
Our ATCA observations have revealed SiO emission distributed at the same angle as the H2 emission and the methanol maser position angle (Figure 5a). The blue-shifted lobe of the SiO outflow is nearly coincident with the western H2 emission region. The red-shifted SiO emission is found to be coincident with the maser location, and not the eastern H2 emission. However, all of the H2 and SiO emission lie along the same outflow axis and so are presumed to be all coming from a single outflow parallel to the methanol maser linear distribution angle.
A 3-color image created from the Spitzer GLIMPSE archival data for this region is shown in Figure 5b. In this image we can see that the masers are located on the western edge of a large dusty region, which is also seen in the near-IR images of De Buizer (2003). However, there is no source seen specifically at the maser location in these Spitzer images, though there are nearby (5) mid-infrared sources to the east. The wavelength represented as green in Figure 5b is the IRAC channel 2. This filter is centered at 4.5 m and has been shown to be a tracer of shock in the outflows of many astrophysical sources (i.e., Noriega-Crespo et al. 2004). In Figure 5b we see the 4.5 m emission (green) is distributed at the same position angle as all the other outflow indicators in this field, adding further evidence to the outflow nature of the H2 emission.
Given that all outflow indicators (SiO, H2, Spitzer 4.5 m emission) are all distributed within 15∘ of parallel to the methanol maser distribution, this source is clearly not compatible with the maser-disk hypothesis.
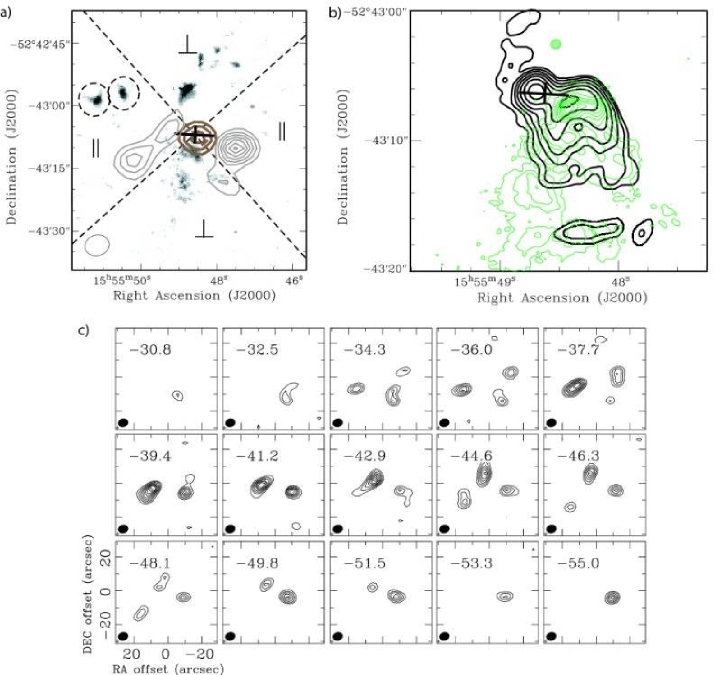
3.2.4 G328.81+0.63 (IRAS 15520-5234)
The nine linearly distributed maser spots (Norris et al. 1998) at this location are surrounded by a complex of sources and emission at several wavelengths.
The new observations presented here add further complexity to the knowledge of this region. The high spatial resolution mid-infrared images taken with T-ReCS (Figure 6b) reveal a large (1515 arcsec2) extended emission region with 8 peaks (or knots). The two brightest peaks are situated E-W at a position angle similar to the methanol maser distribution angle of 86∘. The overall shape of the extended mid-infrared emission is cometary, with the apex pointing to the north. This emission is coincident with the cometary UC HII region seen here at cm wavelengths (Ellingsen, Shabala, & Kurtz 2005). However, the compact cm continuum source to the northeast of (and just resolved from) the cometary UC HII has no associated mid-infrared emission. The methanol masers lie between these two cm continuum sources, and at the edge of the emission from the brightest mid-infrared source (Figure 6b).
Our observations reveal that the SiO emission is distributed on either side of the cm/mid-infrared/mm continuum emission in a E-W fashion similar to the methanol maser distribution angle (Figure 6a). However, the velocity structure of the SiO emission is not like the others, i.e. there is not simply a red-shifted lobe and a blue-shifted lobe. The velocity structure of the SiO emission is quite complex, as demonstrated by the velocity channel map in Figure 6c. There are two likely reasons for this complex velocity structure. First, there may be multiple outflows present all with similar E-W orientations. With several mid-infrared and radio sources between the two SiO lobes, there is a very good possibility that two or more of these could be the young stellar sources responsible for the outflows. A second possibility is that it is a single E-W outflow that is oriented close to the plane of the sky. Therefore no coherent line-of-sight velocity structure would be apparent.
Even with all of the complexity of this region, the SiO emission is clearly not coming from an outflow (or outflows) centered at the maser location and perpendicular to the angle of the methanol maser distribution. Consequently, these observations are inconsistent with the maser-disk hypothesis.
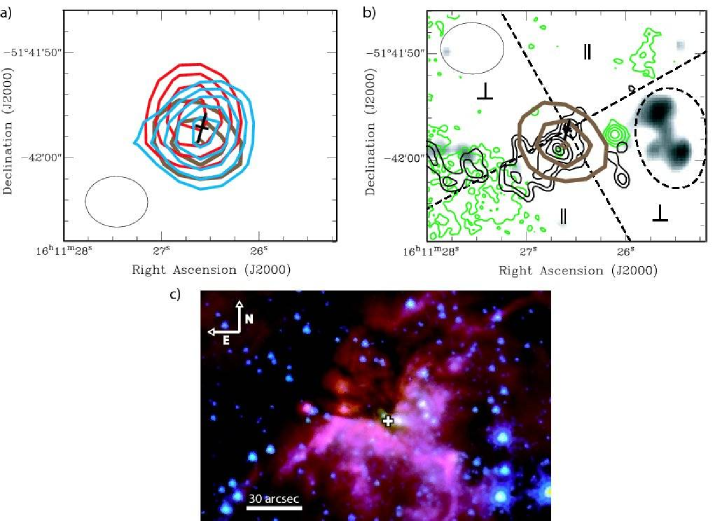
3.2.5 G331.132-0.244 (IRAS 16071-5142)
This source contains nine methanol maser spots oriented E-W with a velocity gradient along the spot distribution (Phillips et al. 1998). It is coincident with an extended (710 arcsec2) cm continuum emission region (Phillips et al. 1998) that is also seen in GLIMPSE 8 m images. There is no near-infrared continuum emission at the maser location, however it does appear that a nearby and extended near-infrared source may overlap spatially with the southern part of the extended cm continuum emission here (Figure 7b). There is another round, extended (10 in diameter) cm continuum source located 15 southwest from the maser location, but is most likely unrelated to the maser emission itself.
There is a 3 mm continuum source detected at this location, with the masers situated on its northeast edge. It overlaps spatially with the near-infrared continuum emission and the cm continuum emission here. Given the offset, it is not clear what the relationship of the mm continuum source is with respect to the maser emission, nor is it clear where the source exciting the outflow is.
There is only one knot of H2 emission on the field that is elongated in its morphology and situated close to the linear maser distribution axis. Our SiO map (Figure 7a) shows that the SiO emission is centered on the maser location and distributed at an angle very close to that of the methanol masers. The H2 emission lies at the eastern edge of the red-shifted SiO lobe. The blue-shifted emission peak lies to the west of the red-shifted emission peak, however, there is significant overlap of blue-shifted emission at the location of the red-shifted emission. Again, this may have something to do with orientation of the outflow being near the plane of the sky or the presence of multiple outflows, though it is impossible to tell from the data at present.
However, it is certain that the collective SiO emission is distributed along an axis that is within 10∘ of parallel with the methanol maser distribution angle for this source, and clearly not what is expected if the masers delineate a disk orientation.
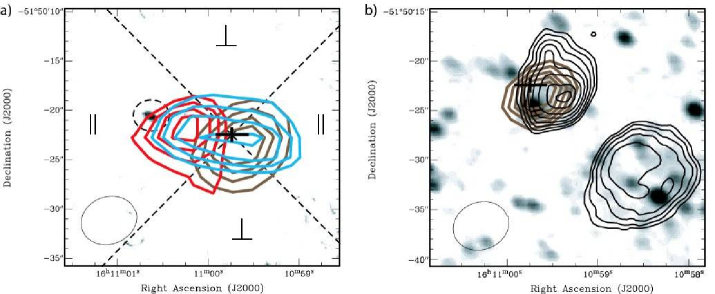
3.2.6 G331.28-0.19 (IRAS 16076-5134)
Though there is some disagreement of the maser distribution angle (see the appendix), this source appears to have masers that are linearly distributed at an angle of 170∘, and is one of the only two target fields in the survey of De Buizer (2003) to have H2 emission distributed in the perpendicular regions of the field with respect to the maser distribution angle.
Near-infrared continuum observations of the field show that the maser location is bordered to the south and west by diffuse extended emission (De Buizer 2003; Lee et al. 2001). GLIMPSE 8 m observations show that this is a complex region of extended dust emission with the masers at the “corner” of extended N-S and E-W “walls” of emission (Figure 8c). It is within these “walls” of dust that the H2 emission seen to the west by De Buizer (2003), as well as the more sensitive H2 observations of emission to the south and west seen by Lee et al. (2001) are located. Given the extensive nature of this dusty star forming region, it is most likely that the H2 emission is associated with radiative excitation of the star formation ongoing in these “walls”. This whole region contains diffuse and extended cm continuum emission (Phillips et al. 1998) testifying to the radiative ionization of the gas in the region (Figure 8b).
High resolution T-ReCS observations (Figure 8b) show a resolved mid-infrared source near (3) the brightest H2 emission seen by De Buizer (2003), which was first seen by De Buizer, Piña, and Telesco (2000). This source is likely a massive young stellar object responsible for radiative stimulation of the H2 emission at that location.
Our 3 mm maps reveal an unresolved mm continuum source with an emission peak 1.5 south of the maser location. SiO emission is also found in the field, with blue-shifted and red-shifted lobes nearly coincident with the 3 mm continuum location. There appears to be a 2 offset between the two lobes at a position angle of 206∘. This outflow axis is within 45∘ of parallel with the maser position angle of 170∘, and therefore would be inconsistent with the maser-disk hypothesis. However, the offset between the lobes is smaller than the synthesized beam of 6.04.8. The relative position uncertainty, , between two unresolved components in a well calibrated image such as this can be estimated through , where is the synthesized beam and is the signal-to-noise ratio (Fomalont 1999). With a signal-to-noise of 6 for both lobes, the 2 separation is 4 times the relative position uncertainty, giving us confidence that the offset between the lobes is real. We can use a similar argument to test the robustness of the measured orientation angle between the two peaks. Even if each of the lobes was offset by the relative positional uncertainty given above, in opposite directions orthogonal to the position angle between the peaks, this would lead to a maximum change in measured positional angle of 25∘. We therefore argue it is statistically unlikely that calibration errors could alter the measured lobe position angle enough to change the outflow direction to be perpendicular to the maser position angle.
The H2 emission in this case is likely to not be outflow related at all, and instead radiatively excited by the nearby mid-infrared source at the H2 location. Further SiO images (or other outflow indicator) at higher spatial resolution are needed to unambiguously determine an outflow axis.
4 Discussion
Table 3 summarizes the observational properties of the sources in the ATCA survey. The general result from the observations is that these sources of linear methanol maser emission do indeed have SiO outflows, and that these outflows are not oriented perpendicular to the linear methanol maser distributions. In four of the six cases the H2 and SiO emission have approximately the same position angle (G318.95-0.20, G320.23-0.28, G328.81+0.63, G331.132-0.244), indicating that H2 is indeed a good tracer of outflows from these objects. The two exceptions are G308.918+0.123, where no SiO emission was found in either the JCMT or the ATCA observations, and G331.28-0.19, where the outflow in SiO is at a different position angle to the H2 emission on the field. In both cases it is likely that the H2 emission that was detected is radiatively excited by other massive YSOs and not outflow related. However, observations in other outflow tracers may still be warranted considering that massive YSOs likely have a wide variety of chemistries, energetics, and environmental factors that may favor the excitation of certain outflow tracers over others.
For the five ATCA sources where SiO emission was detected and mapped, all five have their linear maser distributions at approximately the same angle as the overall SiO distributions on the field. The largest deviation from parallel is G331.28-0.19, where the SiO emission is distributed at an angle 35∘ from the methanol maser distribution angle. In the case of G318.95-0.20, there are possibly two outflows, though both are contained within the quadrants parallel to the maser distribution angle in Figure 4. The other three sources, G320.23-0.28, G328.81+0.63, and G331.132-0.244 all have their SiO emission distributed within 15∘ of parallel to their methanol maser distribution angles, though G328.81+0.63 is likely to also contain multiple outflows at similar angles. Because in no case presented here is there evidence for SiO emission perpendicular to the methanol maser distributions, we conclude that these observations are incompatible with the hypothesis that linearly distributed methanol masers are generally delineating the orientations of circumstellar accretion disks around massive stars.
4.1 Linking the outflow emission to the sources exciting the maser emission
Massive stars do not form in isolation, and therefore the large scale H2 emission and the small-scale maser emission for a source can not be implicitly linked through the same outflow a priori. However, using our observations we can clarify two main points. First, the H2 emission does generally seem to be excited by shocks associated with outflows, and not by fluorescence. And second, the outflows that excite the H2 emission are driven by the massive YSOs that excite the methanol masers, and not by nearby low-mass protostars.
We undertook the ATCA observations to address this first point by checking that the outflows traced by the SiO emission are colinear with the H2 emission spots. Figures 4 through 7 show that in the four sources imaged with ATCA which showed significantly extended SiO emission, the dominant features in the SiO emission are colinear with the H2 emission spots and the massive YSO whose location is marked by the methanol maser emission. For the three sources, G318.95-0.20, G320.23-0.28, and G331.132-0.244, this alignment is very clear. For G328.81+0.63, the complexity of the SiO emission makes the case less compelling, but the brightest SiO emission spot to the ESE of the massive YSO is almost perfectly aligned opposite the H2 emission spots to the WNW of the massive YSO, and a weaker SiO feature appears midway between the massive YSO and the H2 emission spots.
In only one case, G331.28-0.19, is there evidence that the outflow traced by SiO emission does not excite the H2 emission spots. As discussed in Section 3.2.6, the H2 emission spots are probably excited by fluorescence in an unrelated source, and it is surely significant that in this one case the H2 emission spots are not aligned with the axis of the outflow traced by the SiO emission (which is admittedly very poorly determined in this barely resolved source).
Now we address our second point. If we had been studying isolated low-mass protostars, there would have been no question that the outflows observed at each source are driven by the target YSO and are the same as the outflows directed towards the H2 emission spots. However, each of the massive YSOs in our sample is probably surrounded by a crowd of low-mass protostars, some of which may be driving their own outflows. This makes it important to establish that the massive YSO responsible for the methanol maser excitation is also driving the outflow that excites the H2 spots.
A significant result of De Buizer (2003) was that the H2 emission near these sources is normally confined to a small range of position angles on either side of each massive YSO. Since the outflows from unrelated YSOs are unlikely to be aligned, this by itself indicates that there is normally a single dominant outflow in each target region, and it is the source of that outflow that is of interest.
Our observations show significant SiO emission in nine of the ten sources, where observations of low-mass protostars (Codella et al. 1999, Gibb et al. 2004) would have suggested only half of the sources should have exhibited significant SiO emission. We draw the conclusion that outflows from massive YSOs may be more energetic than those from lower mass protostars and hence more likely to excite SiO emission.
Geometrically, we can verify that the outflow traced by SiO emission is driven by the massive YSO by noting whether the SiO emission regions excited by the outflow are colinear with the location of the massive YSO deduced from the maser spots. If unrelated YSOs were responsible for the strongest outflow, we would expect significant misalignments between the massive YSO and the axis defined by the SiO emission and the H2 emission spots in most sources. The possible presence of weaker outflows that are not aligned across the massive YSO in the fields of G318.95-0.20 and G328.81+0.63 confirms this expectation, and again emphasizes that outflows capable of exciting SiO emission are quite rare, even in regions like these that should be crowded with young YSOs and protostars undergoing active accretion. In fact, in the five sources where SiO emission was detected, there is a dominant outflow in the field and the massive YSO is coincident with the SiO emission and/or lies on the axis defined by the brightest SiO emission and H2 spots.
With the ATCA observations we have presented here, where no SiO emission is found in any of the cases to be perpendicular to the maser alignment, linking the outflow emission to the sources exciting the masers is not strictly necessary for the testing of the maser-disk hypothesis. If these sources have accretion disks delineated by methanol masers, we should see at least some fields with confirmed outflows perpendicular to the maser distribution in our observations, and this is not the case. While this presents a major problem for the maser-disk hypothesis, the establishment of the direct relationship of the massive YSO exciting the masers to the outflow is important for testing other possible hypotheses, which we will address in the next section.
4.2 Association with shocks or outflows?
One consequence of the linking of the masers to the outflows in the last section is that the relative position angles of the lines of maser spots and H2 emission spots can validly be compared to test other suggested mechanisms of methanol maser emission near high-mass YSOs.
Dodson, Ojha, & Ellingsen (2004) have developed a model in which the methanol masers arise in an edge-on shock propagating through the hot core around the massive YSO. This model has many attractive properties, especially in its natural explanation of velocity gradients across the line of maser spots. However, it is perhaps surprising that so many massive YSOs would be associated with externally driven, edge-on shocks during the very brief period in which the massive YSO is sufficiently bright to excite methanol maser emission but before the growing H II region overwhelms the hot core. It is unclear what other energy sources could be driving all these shocks when the massive YSOs are the most powerful sources in the region. The results of this paper are even more difficult to accommodate within this model, since we have demonstrated that in most cases massive YSOs with linearly distributed methanol masers are driving bipolar outflows traced by SiO emission that are aligned with both the lines of methanol maser spots and shock excited H2 emission. It is not plausible that an externally driven shock should routinely align itself with an outflow jet.
The fact that 12 of the 15 the fields in De Buizer (2003) showed H2 emission organized within 45∘ of parallel to their maser distribution angles led him to hypothesize that most linearly distributed methanol masers may be directly associated with outflows, an idea we will refer to as the maser-outflow hypothesis. Nor was he the first to reach this conclusion; Minier, Booth, & Conway (2000) also considered that shocks associated with bipolar outflows provided a more generally satisfactory paradigm than locating the methanol masers in disks.
The first evidence of this may come from our JCMT data. Given that for each JCMT target the SiO, SO, and thermal methanol lines all peak at the same velocity, and that in general massive stars are found closest to the cluster centers, it is reasonable to assume the massive YSOs in our sample are at the local velocity of their parent molecular clouds. Furthermore it is reasonable to assume that any outflows present in the region will be dominated by the massive young stellar source. It is therefore striking that in four of the ten sources (G308.918+0.123, G328.81+0.63, G331.28-0.19, and G339.88-1.26), the methanol maser velocities lie mostly or entirely on one side of the SO line core (Figures 1-2). If the maser emission is associated with outflows, this behavior would not be unexpected because in some lower-mass sources, like L1157, the thermal methanol emission can come almost entirely from one side of the bipolar outflow (Avery & Chiao 1996). In L1157 the thermal methanol and SiO emission each come from opposite sides of the bipolar outflow, probably because the speed of the outflow and the temperature and density of the ambient gas is different on the two sides. Likewise, masers in bipolar outflows from YSOs should also generally have both red- and blue-shifted velocities with respect to the YSO velocity, but there will be some instances where chemistry or geometry is only appropriate on one side of the bipolar outflow to generate maser emission observable from the Earth.
It is also possible, but much less likely, to get such asymmetric maser emission from methanol masers excited in circumstellar disks. Although we would expect a high degree of circular symmetry in a disk, clumping and turbulence would ensure that only a random selection of lines of sight through the disk would have strong maser amplification. Recent modeling by Krumholtz, Klein, & McKee (2007) has shown that massive disks have strong gravitational instabilities and may have significant sub-structure and non-axisymmetry in the disks. They claim that such star-disk velocity offsets could be of the order of a few km s-1. However, the largest offset in maser velocities in G339.88-1.26 and G331.28-0.19 are 9 km s-1 and 12 km s-1, respectively, which are much larger than expected from disk asymmetry. Therefore, in our sample there may be kinematic evidence for the association of the methanol masers with outflows rather than circumstellar disks.
Although an analytical model of a bipolar outflow with structures on scales ranging from the size of the maser spots out to the bow shocks that excite the H2 emission would be far too complex to develop in an observational paper such as this, we do have enough evidence in hand to qualitatively guide what such a model might look like.
Our JCMT observations demonstrate that the high-speed jet that forms the core of the outflow has speeds much higher than the methanol masers. For most sources in Figures 1-2, the maser lines have a velocity distribution slightly wider than the line cores of the SO and CH3OH lines, but not nearly as wide as the wings of the SiO lines when these are observed. If these masers are indeed associated with outflows, this suggests that the masers are excited in gas that has been shocked and partially entrained by the outflows, but not in the high-speed outflows themselves. The methanol masers would be excited behind shocks propagating away from the axis of the outflow, which might account for gradients in the maser velocities across the line of the emission spots.
This suggestion is very similar to the conclusions of Moscadelli et al. (2002) who observed the 12 GHz methanol masers in W3(OH) and found that the maser proper motions were consistent with outflow away from the central source, with plane-of-the-sky speeds around 4 km/s. The gas involved would be moving supersonically but substantially more slowly than the gas on-axis in the bipolar outflows. They suggest a model in which the masers originate in gas entrained on a conical boundary delimiting the outflow cavity. In such cases, with an appropriate allowance for the opening angle of the outflow, the maser spots would align closely, but likely not exactly parallel, with the outflow axis, even for distributions of maser spots that do not form well-collimated lines. This conical opening angle of the outflow may explain why in our data the maser distribution angles are often not exactly colinear with the SiO (or H2) outflow axes.
To conclude, there may be evidence in our observations, as well as those in the literature, that linearly distributed methanol masers are directly associated with outflow and/or outflow cavities. However, to date, the evidence is only suggestive and further observations as well as a detailed physical model will be needed to confirm this possible relationship.
4.3 Association of continuum emission to the masers
Unrelated to the main goals of our observations, we can make some comment on the association of the methanol maser emission to the mid-IR and mm continuum emission sources that we have detected in our fields. For the six ATCA sources we have continuum information at cm, mm, mid-infrared, and near-infrared wavelengths. Table 3 shows that there are fewer detections in the near-infrared than any other wavelength, and that the mid-infrared has the highest detection rate. This is not to be unexpected given that methanol masers are radiatively pumped by mid-infrared photons (Sobolev & Deguchi 1994, Sobolev et al. 1997). The canonical size of a massive YSO is about 0.1 pc, which at the distance of our farthest source (5 kpc) would subtend about 5. Given this, Table 3 lists the detection of unresolved sources with emission peaks 5 from the maser reference location, or if the masers lie within an extended continuum source. However, it is clear that several of the continuum sources that are at the edge of this cut-off are far enough away that they might not be directly associated with the masers themselves.
For instance, in the mid-infrared, sources with definite spatial coincidence (to within the FWHM of the mid-infrared source) with the masers are G308.918+0.123, G318.95-0.20, and G331.132-0.244, even though mid-infrared emission is detected on all six fields. For the other sources the masers lie either outside the FHWM of the mid-infrared emission or are completely spatially separate from the mid-infrared source on the field. Likewise in the mm we detect sources on five of the six fields, however, even at the coarse resolution of our mm maps (7) we can see that only for three targets do the methanol masers lie within the FWHM of the mm sources: G328.81+0.63, G331.132-0.244, and G331.28-0.19.
According to the survey of Beuther et al. (2002) there is a 100% detection rate of 1.2 mm continuum emission towards methanol maser sites at a spatial resolution of 11. Perhaps this means higher angular resolution is needed in order to say for sure if there is real physical connection between the mm emission and the masers, or perhaps the sources seen at 1 mm are completely different sources than what we could detect at 3 mm. Indeed, when we look to the 1.2 mm continuum survey of Hill et al. (2005), we find two of our sources included in their sample. Both sources, G318.95-0.20 and G331.28-0.19, were measured to have peak intensities approximately 1.9 Jy/beam. Extrapolating this to 3 mm assuming a dependence leads to an estimate of 2.8 mJy/beam peak intensity, which means given our sensitivities (Table 2) we would be unlikely to have detected dust emission from those sources at 3 mm. Therefore, because of the clustered nature of massive star formation, the presence of emission at different wavelengths may come from several different nearby sources unrelated to the maser emission, and may explain why in some cases in this survey the 3 mm continuum emission is not associated with the massive YSO exciting the methanol masers.
5 Conclusions
The main motivation behind the observations presented in this article was to determine from the presence and morphology of the SiO emission if there are indeed outflows present in these regions, and if they are consistent or inconsistent with the hypothesis that linearly distributed methanol masers generally trace circumstellar accretion disks around young massive stars. We obtained JCMT single dish observations of ten sources from the H2 survey of De Buizer (2003) and all but one yielded a detection in the SiO (6–5) line. All of the sources with bright SiO lines displayed broad line wings indicative of outflow.
It also appears from comparisons between the JCMT thermal line velocities and the maser velocities that there may be kinematic evidence that the masers are not associated with disks, and that perhaps there indeed is an association between outflows and methanol masers. Four of the ten sources observed with the JCMT have methanol maser velocities significantly offset from the thermal line velocities of their parent clouds, which may support the suggestion of De Buizer (2003) that the masers in these sources are participating in the outflows themselves.
We followed up the JCMT single dish SiO (6–5) observations with ATCA interferometric mapping in the SiO (2–1) line of 6 sources. None of these fields had outflows oriented within 45∘ of perpendicular to the position angles to the linear methanol maser distributions. However, five of these six sources of linear methanol maser emission do indeed have SiO outflows, the only non-detection being the same source that was a non-detection in the JCMT observations.
G331.28-0.19 was one of only two sources in the De Buizer (2003) survey where the H2 emission was actually found to be perpendicular to the linear methanol maser distribution, and therefore could be an example of a case where the linear methanol masers are tracing an accretion disk. However, the ATCA SiO maps for this source reveal an outflow that is not perpendicular to the maser distribution. Mid-infrared observations appear to show that the H2 emission is likely associated with a nearby star-forming region and not an outflow from the maser location.
From the ATCA SiO observations of G318.95-0.20 and G328.81+0.63 it is obvious that some of these sources are highly complex in their SiO emission, and higher spatial resolution observations are needed to understand the velocity patterns in the outflow lobes. It is likely that multiple outflows are present, but they cannot be distinguished in our coarse resolution observations. Follow-up studies at higher spatial resolution and with other outflow tracers may reveal further important clues regarding the relationship between the SiO, H2, and methanol maser emission.
Unrelated to our main goals, we have also found that there are fewer detections of continuum emission towards the maser locations in the near-infrared than any other wavelength, and that the mid-infrared has the highest detection rate. There also appears to be a higher detection rate of continuum emission at 1 mm ( 100% according to Beuther et al. 2002) than at 3 mm towards methanol maser sites. We find that only half of our methanol maser locations are co-spatial with 3 mm continuum emission.
To conclude, overall the new SiO observations presented here seem to provide further evidence against the hypothesis that, in general, linearly distributed methanol masers are tracing circumstellar disks around massive young stars. This is not to say that there cannot exist cases where there are methanol masers in disks. However, as a population, these 0.2–1.5-scale linearly distributed methanol masers are not disk indicators. 80% of the fields in De Buizer (2003) showed H2 emission organized parallel to their maser distribution angles, and the probability of this occurring simply by chance is low. Consequently, that data led to the hypothesis advanced by De Buizer (2003) that, in general, linearly distributed methanol masers may be associated with outflows. Kinematic evidence from the JCMT observations presented here, as well as the overall geometries of the SiO outflows we have mapped out with the ATCA, are compatible with (but do not yet provide sufficient proof to confirm) this maser-outflow scenario, but are clearly inconsistent with the maser-disk hypothesis. However, without a detailed analytic model, and given the complexity of some of the sources presented here, there is likely a lot of detail “swept under the rug” that needs to be explored before one can definitely say that, as a population, linearly distributed methanol masers are general tracers of outflows from young massive stars.
Acknowledgements.
We would like to thank the referee, Andrew Walsh, for coherent and constructive comments, which helped to improve the paper.This research was based partially on observations obtained at the James Clerk Maxwell Telescope under program M05AC16. The JCMT is operated by the Joint Astronomy Centre on behalf of the Science and Technology Facilities Council of the United Kingdom, the Netherlands Organisation for Scientific Research, and the National Research Council of Canada. The Australia Telescope Compact Array is part of the Australia Telescope which is funded by the Commonwealth of Australia for operation as a National Facility managed by CSIRO. JMDB was partially supported by Gemini Observatory, which is operated by the AURA, Inc., under a cooperative agreement with the NSF on behalf of the Gemini partnership: NSF (US), PPARC (UK), NRC (Canada), CONICYT (Chile), ARC (Australia), CNPq (Brazil) and CONICET (Argentina). Gemini program ID associated with the results in this paper is GS-2005A-DD-5. This research has made use of the NASA/ IPAC Infrared Science Archive, which is operated by the Jet Propulsion Laboratory, California Institute of Technology, under contract with the National Aeronautics and Space Administration.References
- Arce et al. (2007) Arce, H. G., Shepherd, D., Gueth, F., Lee, C.-F., Bachiller, R., Rosen, A., & Beuther, H. 2007, in Protostars and Planets V, ed. B. Reipurth, D. Jewitt, & K. Keil, (Tucson; University of Arizona Press), 245
- Avery & Chiao (1996) Avery, L. W., & Chiao, M. 1996, ApJ, 463, 642
- Bartkiewicz et al. (2005) Bartkiewicz, A., Szymczak, M., & van Langevelde, H. J. 2005, A&A, 442, L61
- Beuther et al. (2002) Beuther, H., Walsh, A., Schilke, P., Sridharan, T. K., Menten, K. M., & Wyrowski, F. 2002, A&A, 390, 289
- Blum et al. (2004) Blum, R. D., Barbosa, C. L., Damineli, A., Conti, P. S., & Ridgway, S. 2004, ApJ, 617, 1167
- Bonnell et al. (1998) Bonnell, I. A., Bate, M. R., & Zinnecker, H. 1998, MNRAS, 298, 93
- Bonnell et al. (2001) Bonnell, I. A., Bate, M. R., Clarke, C. J., & Pringle, J. E. 2001, MNRAS, 323, 785
- Bonnell & Bate (2006) Bonnell, I. A., & Bate, M. R. 2006, MNRAS, 370, 488
- Cesaroni et al. (2005) Cesaroni, R., Neri, R., Olmi, L., Testi, L., Walmsley, C. M., Hofner, P. 2005, A&A, 434, 1039
- Codella et al. (1999) Codella, C., Bachiller, R., & Reipurth, B. 1999, A&A, 343, 585
- De Buizer et al. (2000) De Buizer, J. M., Piña, R. K., & Telesco, C. M. 2000, ApJS, 130, 437
- De Buizer, (2003) De Buizer, J. M. 2003, MNRAS, 341, 277
- De Buizer & Minier (2005) De Buizer, J. M., & Minier, V. 2005, ApJ, 628, L151
- De Buizer (2006) De Buizer, J. M. 2006, ApJ, 642, L57
- De Buizer (2007) De Buizer, J. M. 2007, ApJ, 654, L147
- Durisen et al. (2001) Durisen, R. H., Mejia, A. C., Pickett, B. K., Hartquist, T. W. 2001, ApJ, 563, L157
- Dodson, Ojha & Ellingsen (2004) Dodson, R., Ojha, R., & Ellingsen, S. P. 2004, MNRAS, 351, 779
- Dutrey et al. (1997) Dutrey, A., Guilloteau, S., & Bachiller, R. 1997, A&A, 325, 758
- Ellingsen et al. (2005) Ellingsen, S. P., Shabala, S. S., & Kurtz, S. E. 2005, MNRAS, 357, 1003
- Ellingsen (2008) Ellingsen, S. P. 2005, MNRAS, 357, 1003
- (21) Feldman, P. A., Redman, R. O., Avery, L. W., Di Francesco, J., Fiege, J. D., Carey, S. J., & Wyrowski, F. 2004, Can. J. Chem., 82, 740
- (22) Fomalont, E. 1999, in Synthesis Imaging in Radio Astronomy II (ASP Conf. Series 180), ed. G. B. Taylor, C. L. Carilli, and R. A. Perley, 301
- (23) Gibb, A. G., Richer, J. S., Chandler, C. J., & Davis, C. J. 2004, ApJ, 603, 198
- Goedhart et al. (2002) Goedhart, S., van der Walt, D. J., & Gaylard, M. J. 2002, MNRAS, 335, 125
- (25) Hill, T., Burton, M. G., Minier, V.,Thompson, M.A., Walsh, A. J., Hunt-Cunningham, M., & Garay, G. 2005, MNRAS, 363, 405
- Krumholz et al. (2005) Krumholz, M. R., McKee, C. F., & Klein, R. I. 2005, Nature, 438, 332
- Krumholz et al. (2007) Krumholz, M. R., Klein, R. I., & McKee, C. F. 2007, ApJ, 665, 478
- Lee et al. (2001) Lee, J.-K., Walsh, A. J., Burton, M. G., & Ashley, M. C. B. 2001, MNRAS, 324, 1102
- Longmore et al. (2007) Longmore, S. N., Burton, M. G., Barnes, P. J., Wong, T., Purcell, C. R., & Ott, J. 2007, MNRAS, 379, 535
- McKee & Tan (2002) McKee, C. F., & Tan, J. C. 2002, Nature, 416, 59
- McKee & Tan (2003) McKee, C. F., & Tan, J. C. 2003, ApJ, 585, 850
- Minier (2004) Minier, V. 2004, Star Formation at High Angular Resolution, 221, 275
- Minier, Booth, & Conway (2000) Minier, V., Booth, R. S., & Conway, J. E. 2000, A&A, 362, 1093
- Minier, Booth, & Conway (2002) Minier, V., Booth, R. S., & Conway, J. E. 2002, A&A, 383, 614
- Minier et al. (2003) Minier, V., Ellingsen, S. P., Norris, R. P., & Booth, R. S. 2003, A&A, 403, 1095
- Moscadelli, et al. (2002) Moscadelli, L., Menten, K. M., Walmsley, C. M., & Reid, M. J. 2002, ApJ, 564, 813
- Noriega-Crespo et al. (2004) Noriega-Crespo, A., et al. 2004, ApJS, 154, 352
- Norris et al. (1993) Norris, R. P., Whiteoak, J. B., Caswell, J. L., Wieringa, M. H., & Gough, R. G. 1993, ApJ, 412, 222
- Norris et al. (1998) Norris, R. P., et al. 1998, ApJ, 508, 275
- Pestalozzi et al. (2004) Pestalozzi, M. R., Elitzur, M., Conway, J. E., & Booth, R. S. 2004, ApJ, 603, L113
- Phillips et al. (1998) Phillips, C. J., Norris, R. P., Ellingsen, S. P., & McCulloch, P. M. 1998, MNRAS, 300, 1131
- Pillai, et al. (2006) Pillai, T., Wyrowski, F., Menten, K. M., Krugel, E. 2006, A&A, 447, 929
- Purcell et al. (2006) Purcell, C. R., et al. 2006, MNRAS, 367, 553
- Sault et al. (1995) Sault, R. J., Teuben, P. J., & Wright, M. C. H. 1995, Astronomical Data Analysis Software and Systems IV, 77, 433
- Shen & Lou (2006) Shen, Y., & Lou, Y.-Q. 2006, MNRAS, 370, L85
- Shu et al. (1987) Shu, F. H., Adams, F. C., & Lizano, S. 1987, ARA&A, 25, 23
- (47) Sobolev, A. M., & Deguchi, S. 1994, A&A, 291, 569
- (48) Sobolev, A. M., Cragg, D. M., & Godfrey, P. D. 1997, A&A, 324, 211
- Walsh et al. (1998) Walsh, A. J., Burton, M. G., Hyland, A. R., & Robinson, G. 1998, MNRAS, 301, 640
- Walsh et al. (2001) Walsh, A. J., Bertoldi, F., Burton, M. G., & Nikola, T. 2001, MNRAS, 326, 36
- Walsh et al. (2003) Walsh, A. J., Macdonald, G. H., Alvey, N. D. S., Burton, M. G., & Lee, J.-K. 2003, A&A, 410, 597
Appendix A Further details of the individual sources in the survey
We summarize here for each source in our survey any further observational results determined from our data.
A.1 G308.918+0.123 (IRAS 13395-6153)
In the near infrared observations of De Buizer (2003), there is a bright continuum source at 2 m at the location of the masers. This source is also observed at 11.5 m by Phillips et al. (in prep) as an unresolved but very bright source (266 Jy). Given the spatial coincidence, this near-IR/mid-IR object is likely to be the massive stellar source within the UC HII region with a direct association to the masers.
Though this field has an impressive collection of H2 knots, there is very little extended H2 emission on the field. Phillips et al. (1998) point out that the size and shape of the UC HII region indicates that there may be substructure, possibly due to a cluster of massive stars. Along the lines of the discussion in 4.5, a 3-color image created from the Spitzer GLIMPSE archival data for this region shows no enhanced emission from IRAC channel 2 (4.5 m), which is believed to be a tracer of shock in the outflows of many astrophysical sources. This fact, combined with no clear sign of SiO outflow, means that another possibility is that the cm/mm continuum source (or possibly unresolved group of sources) and H2 knots are all YSOs in a large cluster centered on the methanol maser location. H2 emission could be radiatively excited in the near vicinity of hot massive stars. Outflow observations in another indicator will be needed to completely understand the nature of the observed H2 emission in this region.
A.2 G318.95-0.20
Other than the near- and mid-infrared emission source, there are no other detected continuum sources in the area around G318.95-0.20; no compact cm continuum emission (Ellingsen, Shabala, & Kurtz 2005), and we detect no 3 mm continuum in the field.
This infrared source was imaged with Gemini and T-ReCS (Figure 4a), and was found to be elongated in its mid-IR continuum emission at a similar position angle (145∘) to the methanol maser distribution angle (151∘). Astrometry tests were performed during these T-ReCS observations, and the absolute astrometric accuracy of the mid-infrared data is good to 0.6. The mid-infrared source peak is offset approximately 0.80 southeast of the maser reference spot (see Figure 4a). The coincidence of the mid-infrared emission and the masers, the velocity gradient along the maser spots, and the fact that the maser distribution is at the same position angle as the elongated thermal dust emission would appear to favor the disk interpretation for this source. However, the ATCA outflow observations show that this is not the case.
The ATCA SiO observations shows that the outflow direction is not perpendicular to the maser distribution angle (Figure 4). Given that the SiO outflow is only 28∘ from the mid-infrared source elongation angle, it is possible that the mid-infrared emission from this source is elongated because we are seeing emission from the dusty outflow or outflow cavities. High-resolution observations are showing massive young stellar objects appear to often have strong, extended, mid-infrared continuum emission from their outflows (e.g., De Buizer & Minier 2005; De Buizer 2006; De Buizer 2007). In this case we may be seeing one or both outflow cavities from this source, but lack the resolution required to confirm this.
While we discuss in 4.2 the idea that there are likely two outflows in this region, a plausible alternate scenario could be that there is emission from the red-shifted wing at the location of the brightest part of the blue-shifted wing of the SiO emission because the outflow is nearly in the plane of the sky. Turbulence or an expansion of the shock away from the axis of the high-speed outflow would easily account for both line wings being visible at the same location. As discussed in the introduction, emission from volatile molecules like methanol and HCO+ will most likely arise from a dense, shocked shell of gas surrounding the cavity excavated by the high-speed outflow. These molecules can indicate a wider opening angle for the outflow than suggested by the high-speed jet, either because the jet wanders with time or because it is surrounded by a lower-speed outflow that clears out the cavity (Arce et al. 2007). This would be consistent with the interpretation of the HCO+ emission contours from Minier et al. (2004) that are shown in Figure 4c.
This source, along with G331.132-0.244, are the only two sources mapped with the ATCA that have a clear velocity gradient in their methanol maser linear distributions. If linearly distributed methanol masers do indeed trace some area or material near the root of an outflow, as has been alternatively proposed (De Buizer 2003), one may expect that the red- and blue- shifted masers should be oriented toward the red- and blue-shifted SiO outflow components, respectively. In G318.95-0.20 the masers are more blue-shifted to the northwest, and red-shifted more to the southeast. Figure 4 shows that the majority of the blue-shifted SiO emission is indeed to the northwest and the majority of the red-shifted emission is to the southeast. This velocity correspondence between masers and SiO emission is also seen in G331.132-0.244 (see A.5). However, we remind the reader that velocity gradients in the methanol maser distributions are not common (Walsh et al. 1998), and there are scenarios where the masers can be linearly distributed and associated with the outflow, but need not have any velocity gradient (i.e., if the masers are located in the material of the outflow cavity walls).
A.3 G320.23-0.28 (IRAS 15061-5814)
This source was not observed with T-ReCS, and there exist no high spatial resolution mid-infrared images of this site. There is no source detected in near-infrared continuum emission directly at the maser location (De Buizer 2003), and the cm continuum source observed by Walsh et al. (1998) is located 8 northeast of the maser location.
We detect a 3 mm continuum source at the same location as the cm continuum source of Walsh et al. (1998). This continuum source does not appear to have any direct relationship to the masers or the outflow (Figure 5a).
A.4 G328.81+0.63 (IRAS 15520-5234)
While there appears to be no near-infrared source at the maser location at 2 m (De Buizer 2003; Goedhart et al. 2002) there is some emission seen in the L band (3.3 m, Walsh et al. 2001). There are two UC HII regions near the maser location (Figure 6b), one compact and round, and the other large and cometary shaped (Ellingsen, Shabala, & Kurtz 2005).
A.5 G331.132-0.244 (IRAS 16071-5142)
As mentioned in A.2, this source, along with G318.95-0.20, are the only two sources in our SiO ATCA sample that have a clear velocity gradient in their methanol maser linear distributions. G331.132-0.244 has blue-shifted masers more to the west of the linear maser distribution and red-shifted masers more to the east. Figure 7a shows that this matches the velocity pattern of the SiO emission. Therefore if linearly distributed methanol masers do indeed trace some area or material near the root of an outflow, both sources have maser velocities consistent with this idea.
A.6 G331.28-0.19 (IRAS 16076-5134)
It has been pointed out since the De Buizer (2003) paper was published that there is some disagreement in the literature as to whether the masers associated with this location are in a linear distribution or not. According to Norris et al. (1993, 1998) this field contains nine 6.7 GHz methanol masers and four 12.2 GHz methanol masers, all distributed in an elongated fashion at an angle of 166∘. More sensitive follow-up observations by Phillips et al. (1998) discovered eleven 6.7 GHz methanol maser spots distributed in a similar pattern in an elongated structure at a similar position angle of 170∘. Interestingly, the 6.7 GHz methanol maser observations of Walsh et al. (1998) show a grouping of ten maser spots with no discernible linear distribution to within the relative astrometric precision of the individual maser spots (0.3). It is unclear why the maser distribution from Walsh et al. (1998) is so different to that of Norris et al. (1993, 1998) and Phillips et al. (1998) given the fact that the maser components in their spectra have velocities that are very similar. Norris et al. (1998) quote a relative astrometric precision of the individual maser spot locations of 0.2, however even if one adopts the 0.3 accuracy of Walsh et al. (1998), the masers shown in Norris et al. (1993, 1998) and Phillips et al. (1998) would still appear to be in an elongated distribution.
Unlike previous mid-infrared images of this region, the T-ReCS images detect a small source southeast of the maser location near the 3 mm peak, which also has an associated cm continuum peak (Figure 8b). We derive a flux density for this source of 23 mJy at 11.7 m, from the T-ReCS images. No Qa flux density can be quoted because of the very poor images of this site at that wavelength. In the T-ReCS images, diffuse extended emission can also be seen corresponding to the “walls” of dust seen in the Spitzer images. A knot of cm continuum emission is also seen at the maser location, however no near-infrared continuum source is detected there, and there is no mid-infrared continuum source at the precise maser location in the T-ReCS images.
| SiO (6–5) | SO (67–56) | CH3OH (21,1–10,1) | |||||||||||
| Source | RA | Dec | Dist. | VLSR | TK | TK | TK | ||||||
| (J2000.0) | (J2000.0) | kpc | km/s | K km s-1 | km s-1 | K km s-1 | km s-1 | K km s-1 | km s-1 | ||||
| G308.918+0.123 | 13 43 01.75 | –62 08 51.3 | 5.2 | –51.0 | 0.4 | – | 3.1 0.28 | 8 | 1.2 0.28 | 8 | |||
| G318.95–0.20 | 15 00 55.40 | –58 58 53.0 | 2.4 | –34.0 | 2.32 0.11 | 45 | 5.6 0.14 | 30 | 4.2 0.11 | 20 | |||
| G320.23–0.28 | 15 09 51.95 | –58 25 38.1 | 4.7 | –66.0 | 0.92 0.15 | 20 | 2.6 0.15 | 20 | 2.8 0.13 | 15 | |||
| G328.81+0.63 | 15 55 48.61 | –52 43 06.2 | 3.0 | –41.5 | 10.02 0.08 | 60 | 55.3 0.10 | 30 | 22.1 0.08 | 22 | |||
| G331.132–0.244 | 16 10 59.74 | –51 50 22.7 | 5.2 | –86.0 | 7.42 0.09 | 65 | 18.9 0.10 | 35 | 10.8 0.09 | 28 | |||
| G331.28–0.19 | 16 11 26.60 | –51 41 56.6 | 4.8 | –87.5 | 10.42 0.05 | 65 | 24.7 0.13 | 50 | 4.1 0.08 | 20 | |||
| G335.789+0.174 | 16 29 47.33 | –48 15 52.4 | 3.4 | –50.0 | 1.22 0.05 | 30 | 3.9 0.11 | 30 | 5.5 0.10 | 25 | |||
| G339.88–1.26 | 16 52 04.66 | –46 08 34.2 | 3.1 | –33.0 | 1.72 0.07 | 50 | 11.8 0.09 | 30 | 4.5 0.06 | 15 | |||
| G345.01+1.79 | 16 56 47.56 | –40 14 26.2 | 2.1 | –12.8 | 4.52 0.06 | 30 | 17.9 0.10 | 42 | 7.7 0.08 | 24 | |||
| G11.50–1.49 | 18 16 22.13 | –19 41 27.3 | 1.7 | –10.5 | 0.12 0.03 | 16 | 3.0 0.07 | 16 | 1.2 0.07 | 16 | |||
| Target | F3mm | F3mm RMS | SiO (2-1) Peak | SiO (2-1) RMS | Vred Range | Vblue Range |
|---|---|---|---|---|---|---|
| (mJy) | (mJy/beam) | (mJy/beam/chan) | (mJy/beam/chan) | (km/s) | (km/s) | |
| G308.918+0.123 | 49 | 7 | - | 25 | - | - |
| G318.95-0.20 | - | 8 | 178 | 16 | -24.0/-32.6 | -37.8/-39.5 |
| G320.23-0.28 | 87 | 5 | 90 | 14 | -63.7/-65.5 | -70.6/-72.4 |
| G328.81+0.63 | 500 | 26 | 326 | 12 | -23.9/-36.0 | -51.5/-60.2 |
| G331.132-0.244 | 56 | 3 | 266 | 11 | -63.5/-84.7 | -91.1/-110.1 |
| G331.28-0.19 | 16 | 2 | 546 | 14 | -61.8/-79.0 | -92.8/-117.0 |
Note – Absolute flux calibration errors are estimated to be 20%.
| Target | 3 cm | 3 mm | MIR | NIR | H2 Angle w.r.t. | SiO (6-5) | SiO (2-1) | Maser | SiO | SiO Angle w.r.t. |
|---|---|---|---|---|---|---|---|---|---|---|
| Cont? | Cont? | Cont? | Cont? | Maser P.A. | Line? | Line? | P.A. | P.A. | Maser P.A. | |
| G308.918+0.123 | Yesa | Yes | Yesb | Yes | Parallel | No | No | 137 | n/a | n/a |
| G318.95-0.20 | Noc | No | Yes | Yes | Parallel | Yes | Yes | 151 | 117 (148)d | Parallel |
| G320.23-0.28 | Noe | No | Yesf | No | Parallel | Yes | Yes | 86 | 75 | Parallel |
| G328.81+0.63 | Yesc | Yes | Yes | Yesg | Parallel | Yes | Yes | 86 | 90h | Parallel |
| G331.132-0.244 | Yesa | Yes | Yesf | No | Parallel | Yes | Yes | 90 | 81 | Parallel |
| G331.28-0.19 | Yesa | Yes | Yes | No | Perpendiculari | Yes | Yes | 170i | 206 | Paralleli |
Note – Near-infrared continuum (2 m) and H2 and
maser position angle information is from De Buizer (2003).
Mid-infrared continuum (12 and 18 m) information unless
otherwise indicated is from the T-ReCS data presented in this work.
Columns 2, 3, and 4 address the presence of continuum emission at
the maser location only. For unresolved continuum sources this means
the emission peak is within 5 of the reference feature. See
3 for details on individual sources.
aFrom Phillips et al. (1998).
bFrom Phillips et al. (in prep).
cFrom Ellingsen, Shabala, & Kurtz (2005).
dThere appears to be two outflows present in G318.95-0.20. See 4.2.
eFrom Walsh et al. (1998).
fFrom GLIMPSE 8m data.
gFrom Walsh et al. (2001). These are L-band (3.3 m) observations.
hG328.81+0.63 has a complex velocity behavior in SiO emission;
however the overall distribution angle is parallel to the methanol
maser distribution angle.
iThere is some inconsistency in the maser distribution orientation in the
literature. See 4.6.