XMM-Newton observations of IGR J00291+5934: signs of a thermal spectral component during quiescence
Abstract
We present X–ray observations of the transient accretion-powered millisecond pulsar IGR J00291+5934 during quiescence. IGR J00291+5934 is the first source among accretion powered millisecond pulsars to show signs of a thermal component in its quiescent spectrum. Fitting this component with a neutron star atmosphere or a black body model we obtain soft temperatures ( eV and eV, respectively). As in other sources of this class a hard spectral component is also present, comprising more than of the unabsorbed 0.5–10 keV flux. Interpreting the soft component as cooling emission from the neutron star, we can conclude that the compact object can be spun up to milliscond periods by accreting only .
1 Introduction
IGR J00291+5934 (IGR J0029 in the following) is one out of eight low mass neutron star transient showing coherent pulsations during outbursts (see Wijnands 2005 for a review). Distinctive properties of these faint transients are weaker outburst peak luminosities () with respect to classical neutron star transients (see Campana et al. 1998 for a review), very low mass companions (mass functions ), short orbital periods ( hr), very faint quiescent X–ray luminosities () and absence of a soft X–ray spectral component in quiescence (quiescent spectrum consistent only of a hard power law component).
IGR J0029 was discovered while in outburst on December 2nd 2004 during a routine monitoring of the Galactic plane with the INTEGRAL satellite (Eckert et al. 2004). Follow-up RXTE observations revealed 598.88 Hz (1.67 ms) coherent pulsations (Markwardt, Swank & Strohmayer 2004), making it the fastest confirmed accretion-powered millisecond pulsar and a 2.46 hr orbital modulation (Markwardt et al. 2004). In quiescence IGR J0029 was detected by Chandra at the beginning of 2005 (and historically by ROSAT; Jonker et al. 2005). The source quiescent 0.5–10 keV unabsorbed flux was erg cm-2 s-1 with a variability among different observations by a factor of 2 (Jonker et al. 2005). Chandra detected IGR J0029 also in November 2005 at a level of erg cm-2 s-1 (Torres et al. 2008). Finally a short observation was carried out with Chandra in September 2006 with the source at a level of erg cm-2 s-1 (Jonker, Torres & Steeghs 2008). All these Chandra observations collected a relatively low number of photons and a detailed spectral analysis could not carried out, being all spectra consistent with a single power-law (photon index , confidence level).
The non-detection of X–ray bursts makes the estimate of the distance to IGR J0029 difficult. Shaw et al. (2005) gave an upper limit of 3.3 kpc considering the source position with respect to the Galactic Center. Torres et al. (2008) estimated a distance of kpc based on the critical X—ray luminosity needed to ionize the accretion disc and produce the observed X–ray light curve during outburst. We will assume in the following a fiducial distance of 3 kpc.
In this letter we report on the first study of IGR J0029 in quiescence with XMM-Newton. The larger throughput of the XMM-Newton instruments allowed us to study in detail the quiescent spectrum. In Sect. 2 we discuss the XMM-Newton data analysis. Sect. 3 contains our discussion and conclusions.
2 Data analysis
The XMM-Newton Observatory (Jansen et al. 2001) includes three 1500 cm2 X–ray telescopes each with a European Photon Imaging Camera (EPIC, 0.1–15 keV) at the focus. Two of the EPIC imaging spectrometers use MOS CCDs (Turner et al. 2001) and one uses pn CCDs (Strüder et al. 2001).
| Instrument | Exp. time | Filt. exp. time | Counts | Backg. Sub. Counts |
|---|---|---|---|---|
| (s) | (s) | (cts) | (cts) | |
| pn | 26970 | 17305 | 466 | 269 |
| MOS1 | 28535 | 23920 | 142 | 102 |
| MOS2 | 28535 | 23877 | 146 | 107 |
XMM-Newton observed IGR J0029 on July 24 2007 for 27 ks with the thin filter on all the EPIC instruments. Data were processed using SAS v.6.6.0. At the end of the observation a strong soft proton flares occurred limiting the usable observing time to 17 and 24 for the pn and the MOS detectors, respectively (filtering out background flares for total 0.2–15 keV rates less than 5 and 20 c s-1 for the MOS and pn cameras, respectively). We extracted the pn source spectrum from a circular region with radius and the background spectrum from a larger region close to the source with radius within the same CCD. For the MOS cameras we used the same source extraction region and a background region. We obtained 466, 142 and 146 counts for pn, MOS1 and MOS2 cameras in the 0.2–10 keV range. The background contribution is at a level of and for the pn and MOS cameras, respectively.
We considered for timing analysis only the pn light curve in consideration of the higher signal to noise ratio. We subtracted the background light curve and we did not find any evidence for variability down to the 500 s, i.e. the shortest timescale that could be investigated (the fit with a constant provides a reduced with 43 degrees of freedom, dof). This is at variance with what observed in the optical band, where strong flares ( mag) were reported on timescale of s (Jonker et al. 2008).
The spectral analysis was carried out by using the data from the three EPIC cameras together. Spectra were binned to, at least, 20 counts per spectral bin resulting in 37 bins. A single power law fit provides a good description of the data (reduced , 34 dof) but the inferred column density (using TBABS model in XSPEC12.4.0ai) is ( confidence level), which is much smaller than the column density observed in outburst of obtained fitting together Chandra HETG and RXTE/PCA data (Paizis et al. 2005). This value is also consistent with the Galactic value of . Here we adopt this value (see Table 2).
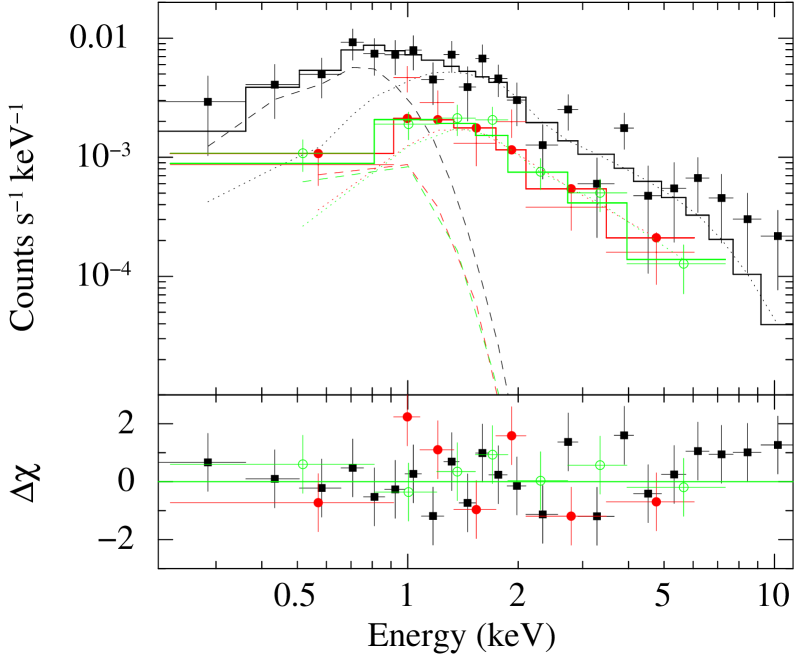
Fitting the data with the column density fixed at the above value provides relatively poor fits (reduced in the case of a power law). Therefore we tried double component models. Usually spectra of neutron star transients in quiescence are fit with a two components model: a neutron star atmosphere emission model (or a black body) plus a hard power law component. These models provide a better description of the data. An F-test gives a probability for the significance in the fit improvement due to the extra model component (either black body or neutron star atmosphere, see Table 2). This indicates that, if is held fixed at the value measured in outburst, the addition of a soft spectral component is significant. Estimates of the column density during quiescence of transient accreting millisecond X–ray pulsars are available only for SAX J1808.4–3658. For this source the quiescent value of the column density is consistent with the one observed in outburst (Heinke et al. 2007; Campana, Stella & Kennea 2008).
| Model | Ph.Index | Temperature | Fluxb | ||
| () | (keV/log T) | (dof) [nhpa] | (Luminosity) | ||
| Power law | – | 0.89 (34) [66] | 7.2 (7.7) | ||
| Black body | – | 1.55 (34) [2] | 3.4 (3.6) | ||
| Power law | 4.6 | – | 1.35 (35) [8] | 8.5 (9.2) | |
| Black body | 4.6 | – | 2.86 (35) [0] | 4.4 (4.7) | |
| NSAc | 4.6 | – | 3.46 (35) [0] | 7.1 (7.7) | |
| PL+BBd | 4.6 | 0.93 (33) [59] | 12.4 (13.3) | ||
| PL+NSAe | 4.6 | 0.98 (34) [49] | 11.6 (12.4) |
All quoted errors are at confidence level ().
3 Discussion and conclusions
In recent years the quiescent properties of a handful neutron star transients have been studied in some detail thanks to dedicated observations mainly carried out with XMM-Newton and Chandra. ‘Classical’ (i.e. not showing pulsations during outbursts) neutron star transients have quiescent (0.5–10 keV) luminosities within a narrow range of and their spectra display a soft component consistent with (cooling) emission from the entire neutron star and in some cases a hard (power-law) component contributing of the flux (e.g. Campana et al. 1998). An increasing number of candidate neutron star systems has also been discovered in globular clusters (e.g. Pooley et al. 2003; Heinke et al. 2003). These are characterized by a soft spectrum consistent with emission from the entire neutron star surface, but do not display any evidence for a power law component (upper limits on the flux of such a component are very tight in some cases). No outbursts have yet been detected from these sources. At the other extreme, there exist systems like PSR J0024–7204W in the globular cluster 47 Tuc, showing emission consisting of a dominant power law component, which is eclipsed for a portion of the orbit, and a soft thermal component, which appears to be persistent (Bogdanov, Grindlay & van den Berg 2005).
Transient accreting millisecond X–ray pulsars have low quiescent (0.5–10 keV) luminosities, below (and in some cases well below) . In these systems the quiescent spectrum is made just by a power law component with no signs of a soft component. The best known system, SAX J1808.4–3658, shows a pure power law spectrum, with an upper limit on the luminosity of the soft component of (Heinke et al. 2007).
Our XMM-Newton data on IGR J0029 in quiescence provides for the first time evidence for the presence of a soft component in the quiescent spectrum of a transient accreting millisecond X–ray pulsar. The temperature of this component ( eV, when modelled with a neutron star atmosphere) is soft, but in line with other classical neutron star transients (e.g. Heinke et al. 2007). The bolometric neutron star atmosphere luminosity is . This luminosity is usually ascribed to the heat generated deep in the crust during outburst episodes (i.e. accretion onto the neutron star surface) which is then radiated away through the atmosphere while in quiescence producing the quiescent X–ray emission (Brown et al. 1998; Haensel & Zdunik 1990). The efficiency of the re-radiation process depends on which fraction of heat escapes the neutron star as neutrinos rather than photons and in turn on the physical conditions (i.e., composition, density, and pressure) of the neutron star interior.
The accretion history of IGR J0029 is relatively well known. IGR J0029 was discovered during an outburst in Dec. 2004. The bolometric fluence of this outburst has been estimated in erg cm-2 using RXTE data (Galloway et al. 2005) or erg cm-2 using INTEGRAL data (Falanga et al. 2005). Thanks to the RXTE-ASM two previous instances of activity, on 1998 November 26-–28 and 2001 September 11–-21 have been revealed (Remillard 2004). These results indicate that the transient appears regularly, roughly every 3 yr. Indeed a new outburst started on Aug 13 2008 (Chakrabarty et al. 2008), providing further evidence that the outbursts recur fairly regularly. Assuming that all the outbursts have comparable fluence (as testified by similar outbursts peak in the RXTE-ASM), one can estimate a long-term . Based on deep crustal heating theory, the quiescent flux is related to the long term time-averaged flux (Brown et al. 1998). This is in line with what observed. The goodness of this match lends support to the idea that the soft spectral component derives from cooling of the neutron star surface and not from accretion (since the spectrum at these low luminosities is expected to be soft, e.g. Zampieri et al. 1995).
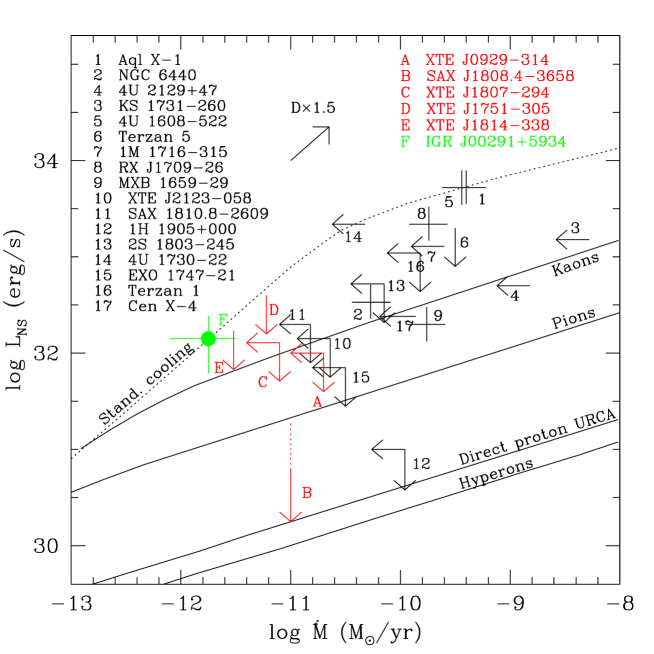
Having estimated the quiescent cooling luminosity and the time-averaged flux (or mass inflow rate) we can put constraints on models for the neutron star interior (Yakovlev & Pethick 2004; Levenfish & Haensel 2007). As can be seen from Fig. 2, IGR J0029 lies on the standard cooling curve for a low mass neutron star. This is at variance with, e.g. SAX J1808.4–3658 and Cen X-4, for which low cooling luminosities have been inferred, hinting for enhanced neutrino emission produced in the high-density core of a relatively high mass neutron star (, e.g. Colpi et al. 2001).
Our observation indicates that neutron stars showing coherent pulsation during their outbursts do not necessarily lack a soft component in their quiescent spectra. If the soft spectral component is due to deep crust heating emission and the presence or lack of this component is a proxy of its mass, as massive neutron stars do not show it due to fast cooling. This would imply that light () neutron stars too can show coherent pulsations at the millisecond level, having accreted only (Lavagetto et al. 2004).
References
- (1)
- (2) Bogdanov, S., Grindlay, J. E., van den Berg, M. 2005, ApJ, 630, 1029
- (3)
- (4) Brown, E. F., Bildsten, L., Rutledge, R. E. 1998, ApJ, 504, L95
- (5)
- (6) Campana, S., et al. 1998, A&A Rev., 8, 279
- (7)
- (8) Campana, S., Stella, L., Kennea, J. A. 2008, ApJ, 684, L99
- (9)
- (10) Chakrabarty, D., Swank, J. H., Markwardt, C. B., Smith, E. 2008, Atel 1660
- (11)
- (12) Colpi, M., Geppert, U., Page, D., Possenti, A. 2001, ApJ, 548, L175
- (13)
- (14) Eckert, D., et al. 2004, ATel 352
- (15)
- (16) Falanga, M., et al. 2005, A&A, 444, 15
- (17)
- (18) Galloway, D. K., et al. 2005, 2005, ApJ, 622, L45
- (19)
- (20) Haensel, P., Zdunik, J. L. 1990, A&A, 229, 117
- (21)
- (22) Heinke C. O., et al. 2003, ApJ, 598, 501
- (23)
- (24) Heinke, C. O., Jonker, P. G., Wijnands, R., Taam, R. E. 2007, ApJ, 660, 1424
- (25)
- (26) Heinke C. O., et al. 2008, ApJ submitted
- (27)
- (28) Jansen, F., et al. 2001, A&A 365 L1
- (29)
- (30) Jonker, P. G., et al. 2005, MNRAS, 361, 511
- (31)
- (32) Jonker, P. G., Torres, M. A. P., Steeghs, D. 2008, ApJ, 680, 615
- (33)
- (34) Lavagetto, G. et al. 2004, MNRAS, 348, 73
- (35)
- (36) Levenfish, K. P., Haensel, P. 2007, Ap&SS, 308, 457
- (37)
- (38) Markwardt, C. B., Swank, J. H., Strohmayer, T. E. 2004, ATel 353
- (39)
- (40) Markwardt, C. B., et al. 2004, ATel 360
- (41)
- (42) Paizis, A., et al. 2005, A&A, 444, 357
- (43)
- (44) Pooley, D., et al. 2003, ApJ, 591, L131
- (45)
- (46) Remillard, R. 2004, Atel 357
- (47)
- (48) Shaw, S. E., et al. 2005, A&A, 432, L13
- (49)
- (50) Strüder, L., et al. 2001, A&A, 365, L18
- (51)
- (52) Torres, M. A. P., et al. 2008, ApJ, 672, 1079
- (53)
- (54) Turner, M. et al., 2001, A&A, 365, L27
- (55)
- (56) Yakovlev, D. G., Pethick, C. J. 2004, ARA&A, 42, 169
- (57)
- (58) Wijnands, R. 2005, astro-ph/0501264
- (59)
- (60) Zampieri, L., Turolla, R., Zane, S., Treves, A. 1995, ApJ, 439, 849
- (61)