Globular Cluster Populations in Four Early-Type Poststarburst Galaxies 11affiliation: Based on observations with the NASA/ESA Hubble Space Telescope, obtained at the Space Telescope Science Institute, which is operated by the Association of Universities for Research in Astronomy, Inc., under NASA contract NAS5-26555
Abstract
We present a study of the globular cluster systems of four early-type poststarburst galaxies using deep g- and I-band images from the ACS camera aboard the Hubble Space Telescope (HST). All the galaxies feature shells distributed around their main bodies and are thus likely merger remnants. The color distribution of the globular clusters in all four galaxies shows a broad peak centered on , while PGC 6240 and PGC 42871 show a significant number of globular clusters with . The latter globular clusters are interpreted as being of age 500 Myr and likely having been formed in the merger. The color of the redder peak is consistent with that expected for an old metal-poor population that is very commonly found around normal galaxies. However, all galaxies except PGC 10922 contain several globular clusters that are significantly brighter than the maximum luminosity expected of a single old metal-poor population. To test for multiple-age populations of overlapping color, we model the luminosity functions of the globular clusters as composites of an old metal-poor subpopulation with a range of plausible specific frequencies and an intermediate-age subpopulation of solar metallicity. We find that three of the four sample galaxies show evidence for the presence of an intermediate-age ( 1 Gyr) globular cluster population, in addition to the old metal-poor GC population seen in normal early-type galaxies. None of the galaxies show a significant population of clusters consistent with an old, metal-rich red cluster population that is typically seen in early-type galaxies.
The presence of a substantial number of intermediate-age clusters and the absence of old, metal-rich clusters indicate that the progenitor galaxies which formed the resulting shell galaxy were gas rich and did not host significant bulges. Late-type spirals seem to be the most plausible progenitors. These results lend credence to the “merger scenario” in which the red, metal-rich GCs observed in normal ellipticals are formed during a dissipative merger event that also forms the elliptical itself.
1 Introduction
Mergers seem to have played a major role in determining the shapes and dynamics of elliptical galaxies. A few galactic mergers still occur and offer valuable clues to past evolutionary processes. Young globular clusters formed during mergers hold strong promise for age-dating such events, besides helping shed light on the cluster-formation process itself. Globular clusters are very useful probes of the dynamical and chemical assembly history of galaxies. Many globular cluster (GC) systems in normal giant elliptical galaxies show a bimodal color distribution, indicating the occurrence of a second event/mechanism of cluster formation. The “merger” model suggests that metal-rich (“red”) clusters are formed during major mergers of gas-rich galaxies (Schweizer, 1987; Ashman & Zepf, 1992). Globular cluster systems in young merger remnants such as NGC 7252 (e.g., Miller et al., 1997) reveal a bimodal color distribution featuring not only the well-known “universal” halo population of old metal-poor GCs, but also hundreds of second-generation GCs that are young, metal-rich, and have most probably formed from the metal-enriched gas associated with the progenitor spirals. The many structural properties that merger remnants such as NGC 1275, NGC 3921, and NGC 7252 share with normal ellipticals suggest not only that these merger remnants are proto-ellipticals (e.g., Schweizer, 1998) but also that many normal ellipticals with bimodal color distributions may have formed their metal-rich GCs in a similar manner. If this is indeed the case, it should be possible to find ellipticals with second-generation GC systems of intermediate age ( 1–4 Gyr). Evidence for the existence of intermediate-age GCs in ellipticals has been recently found for a few galaxies like NGC 1316 (Goudfrooij et al., 2001a, b, 2004), NGC 3610 (Whitmore et al., 1997, 2002; Goudfrooij et al., 2007), NGC 1700 (Whitmore et al., 1997; Brown et al., 2000), NGC 4365 (Puzia et al., 2002; Larsen et al., 2003; Kundu et al., 2005), and NGC 5128 (Minniti et al., 1996; Peng et al., 2004).
This paper aims at searching for intermediate-age clusters in a sample of early-type galaxies which show evidence for having experienced a merger and a starburst in the recent past (during which GCs may well have formed). To select the sample, we used the Malin & Carter (1983) catalog. This catalog consists of southern elliptical galaxies that feature shells and/or ripples around their main body and in their outer envelopes. Shells are a common result of galaxy mergers (Quinn, 1984; Dupraz & Combes, 1986; Hernquist & Quinn, 1988, 1989) or interactions (Thomson & Wright, 1990; Thomson, 1991) and are expected to have a lifetime of only years. Approximately 10% of these early-type shell galaxies have colors, absolute magnitudes, and spectra characteristic of “poststarburst” galaxies (featuring strong Balmer lines Carter et al., 1988).
A poststarburst spectrum is characterized by the presence of strong Balmer absorption lines (indicative of A-type stars), but without strong [O ii] or H emission lines (Dressler & Gunn, 1983). The existence of strong Balmer absorption lines indicates that these galaxies have experienced star formation in the past 0.1 – 1 Gyr while the absence of emission lines indicates they are no longer forming stars. Most such galaxies are classified as poststarburst based on the nature of the spectrum only in their central region. Often no information is available on the extent of the poststarburst event or the amount of global star formation. It is interesting to investigate the global properties of the poststarburst class of galaxies and explore the connection (if any) between properties of the host galaxy and its star formation history. We will address these issues through a study of the GC systems of these galaxies since they provide a good handle on the impact of major star formation episodes in a galaxy. If numerous intermediate-age GCs with ages consistent with those of the poststarburst population in the nucleus were to be found, we could be fairly confident that the A stars were formed in a relatively vigorous star formation event, likely associated with a recent dissipative galaxy merger. Conversely, an absence of such GCs would indicate that no strong star formation was associated with the event that caused star formation to end 0.1 to 1 Gyr ago. The latter would be consistent with a scenario where gas is removed from the galaxy, e.g. by weak ram pressure stripping.
The nearest four galaxies from Carter et al. (1988) which showed a poststarburst spectrum were selected for this study. The basic properties of these galaxies are given in Table 1. A detailed study of one of the galaxies, namely PGC 6240 (AM 0139655) has been presented in an earlier paper (Maybhate et al., 2007, hereafter Paper I). The current paper presents a study of the properties of the GC systems as well as the diffuse light of all four early-type poststarburst galaxies. It discusses the implications of these properties in the context of the star formation history of these galaxies, and of the assembly history of early-type galaxies in general.
2 Observations and Data Reduction
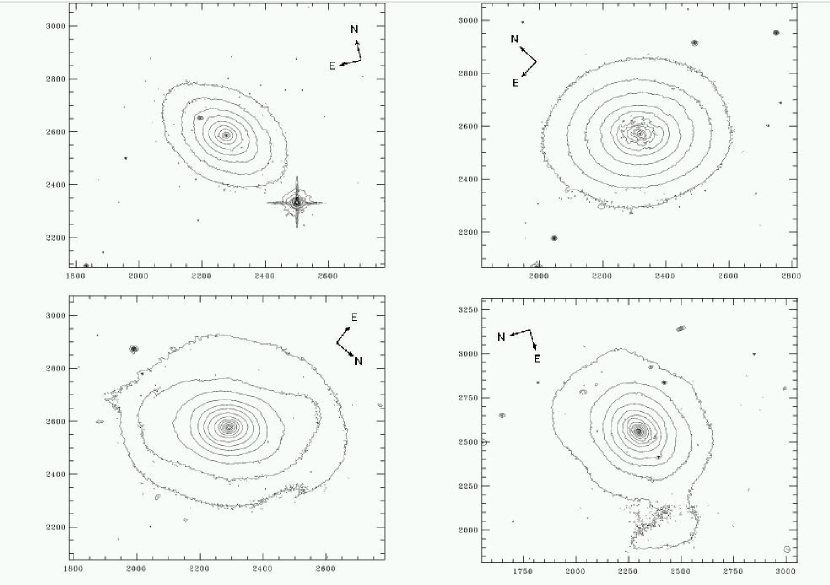
The four galaxies were observed as part of HST General Observer program 10227 (PI: Goudfrooij), using the Wide Field Channel (WFC) of ACS with the filters F475W and F814W. The observations consisted of several long exposures plus a few short ones to guarantee getting an unsaturated galaxy center. The total exposure times were 7874s, 9350s, 8369s, and 21440s in F475W and 2712s, 3970s, 5908s, and 7300s in F814W for PGC 6510, PGC 10922, PGC 42871, and PGC 6240, respectively. The data were processed with the ACS on-the-fly pipeline, which included dark and bias subtraction and flat fielding. Individual flat-fielded images were carefully checked for satellite trails and saturated pixels in the central region of each galaxy. These pixels were flagged and masked out. The individual images of a galaxy in each band were co-added using the PyRAF111PyRAF is a product of the Space Telescope Science Institute, which is operated by AURA for NASA task MULTIDRIZZLE (Koekemoer et al., 2002). This resulted in images cleaned of cosmic rays and corrected for geometric distortion. A combination of the short and long-exposure images enabled us to get good resultant multidrizzled images with unsaturated centers. The isophotal contours of the four galaxies are shown in Fig. 1. It is obvious from the figure that the sample galaxies show significant differences in global morphology, even though they all share the properties of a poststarburst spectrum and shell structure. PGC 6510 appears to be a disky elliptical, PGC 10922 shows rounder isophotes but has a distorted center (due to dust absorption), while the isophotes of both PGC 6240 and PGC 42871 appear irregular in the outer regions.
3 Cluster Candidate Selection
To select cluster candidates, the F475W and F814W images obtained from MULTIDRIZZLE were first added together to get a high signal-to-noise g+I image for each galaxy. Elliptical isophotes were then fit to this coadded image using the task ELLIPSE within STSDAS222STSDAS is a product of the Space Telescope Science Institute, which is operated by AURA for NASA, and allowing the center, ellipticity, and position angle of the isophotes to vary. This yielded a smooth model of each galaxy’s count distribution. The search for sources was performed on an image created by dividing the g+I image by the square root of the model image. This ensures uniform shot noise characteristics over the whole image. The detection threshold for selecting sources was set at 4 above the background. Typical half-light radii of globular clusters fall into the range 1 – 20 pc (Kundu & Whitmore, 2001; van den Bergh & Mackey, 2004; Jordán et al., 2005). At the distance of our sample galaxies, the spatial scale is 14 – 25 pc per ACSWFC pixel. Thus, we expect the globular clusters to appear as nearly unresolved point sources. There are two advantages in using the g+I images, rather than the individual - or -band images, for cluster-candidate selection. Firstly, the coadded images reach a greater depth than the individual images, and secondly, the photometric zero-point of a g+I image is significantly less color dependent than that of the individual images. A detailed illustration and discussion of these advantages can be found in Goudfrooij et al. (2007).
To perform cluster photometry, a smooth elliptical model was constructed for each galaxy in each filter in a manner similar to the one described above. This model was subtracted from the corresponding drizzled image to get a residual image. The cluster candidates are clearly visible once the underlying galaxy light has been subtracted. Aperture photometry was then performed through an aperture of 3 pixel radius for all the detected sources. The photometry lists thus obtained for both filters were then matched for further analysis. Aperture corrections from 3 pixel to 10 pixel radius were determined using a few bright point sources in each band. The corrections from 10 pixel radius to infinity were taken from Sirianni et al. (2005). Finally, the F475W and F814W magnitudes were converted from the instrumental system (STMAG) to SDSS g and Cousins I magnitudes in the VEGA system via the SYNPHOT package in STSDAS; for details, see Paper I. The g and I magnitudes and the color were corrected for Milky Way foreground reddening using given in Table 1 and the relations and .
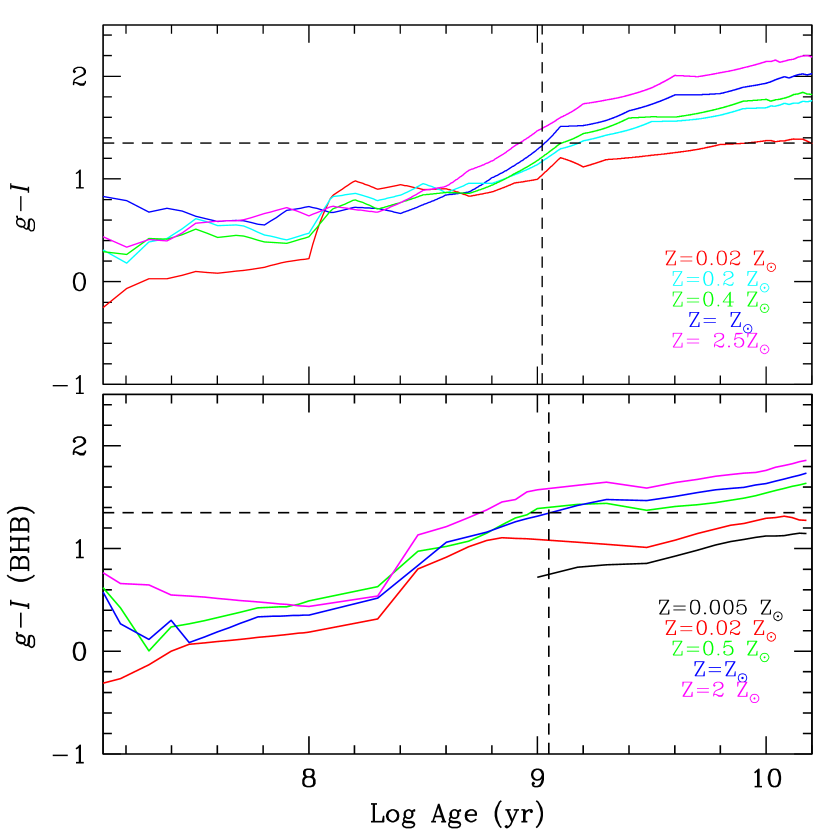
After discarding clusters with photometric errors 0.4 mag in each band, the first selection criterion we applied considered the target’s color index . Using the population-synthesis models GALEV of Anders & Fritze-v. Alvensleben (2003), we determined that the range includes all model clusters with ages from to years and metallicities from 0.0004 to 0.05 (where corresponds to solar metallicity), as shown in Fig. 2. The GALEV models are calibrated to the ACS filters and were hence chosen to avoid introducing systematic errors while converting to a standard system. However, the differences between model predictions of GALEV and (e.g.) Bruzual & Charlot (2003) in the age range 0.5 – 14 Gyr stay within 0.05 mag in . We also verified that the results obtained using the Maraston (2005) models are consistent with those from GALEV as shown in Fig. 2. An extensive comparison between the various Simple Stellar Population (SSP) models can be found in Pessev et al. (2008). Sources with colors outside the range were judged unlikely to be real star clusters and were discarded. The resultant source list contains cluster candidates, stars, and background galaxies. To further constrain the selection and discard extended background galaxies, we determined the FWHM of all objects in the color-selected lists from the coadded image, using the IRAF task IMEXAM, and retained objects with FWHM pixels. An additional compactness criterion was applied to only retain sources that had a difference in magnitudes between apertures of 2 and 5 pixel radius of 0.2 to 0.6 mag. Our final list of GC candidates contains the sources that satisfy all the above criteria.
Completeness tests were done for each galaxy on the image used to detect cluster candidates (i.e., the g+I image). Artificial clusters were added to the image in batches of 100 for five different background levels and in 0.25 mag intervals. Using the background levels in the parts of the image farthest away from, and nearest to, the galaxy center where clusters are still detected as the two extremes, the five background levels were determined by dividing this interval into five logarithmically equal intervals. The radial-intensity profile of the artificial clusters was determined by fitting PSFs to the real clusters in the g+I image. A smooth elliptical model of each host galaxy was obtained, and the g+I image was divided by the square root of this model image. Source detection was then performed on this image in the same manner as done previously for the actual sources. Other criteria (permissible error in photometric magnitude, FWHM, and compactness) were also applied in exactly the same manner as before. A typical sample of completeness curves, obtained for PGC 6510 is shown in Fig. 3.
3.1 Selecting “Genuine” versus “Background” sources
To determine the radial extent of the cluster candidates that are physically associated with the target galaxy versus compact background galaxies that have similar colors and apparent magnitudes, we examined the surface number density of the GC candidates as a function of galactocentric radius. This was achieved by dividing each galaxy image into annular rings centered on the galaxy center and computing the number of sources per unit area in each ring. The bright background due to the presence of the galaxy would prevent the detection of faint sources in the inner regions, while sources of the same magnitude would be easily detected in the outer regions of low background. To account for this effect, we applied a magnitude cut-off to the sources that were considered for the surface density measurements. This cut-off was chosen to be at the magnitude associated with a completeness value of 80% at a galactocentric radius of 6″. Only sources outside that radius were taken into account. Figure 4 shows the results. We find that the surface-density profile flattens off beyond a certain radius for each galaxy. This radius was taken to be the limiting radius for the sources associated with that galaxy and was found to be 60″, 94″, 104″, and 78″ for PGC 6510, PGC 10922, PGC 42871, and PGC 6240, respectively. All sources detected beyond this radius were considered background sources.
The radial GC surface-number-density profiles are in most cases similar to the surface brightness profile of the parent galaxies, which is consistent with the situation for the metal-rich subpopulation of GCs in normal early-type galaxies (Harris & Racine, 1979; Harris, 1986; Ashman & Zepf, 1998; Goudfrooij et al., 2007). However, the GCs in PGC 10922 seem to have a more extended distribution, similar to that seen for metal-poor GCs in normal early-type galaxies. Quantitatively, simple power-law fits to the outer data points yield exponents ranging from to , whereas surface-number-density profiles for GCs in normal elliptical galaxies show power-law exponents in the range between and (Ashman & Zepf, 1998; Puzia et al., 2004). It is also seen that in all cases, the innermost GC bin has a lower surface number density than that represented by the power-law fits. This could be due to the faster destruction of GCs in the inner regions of these galaxies due to effects such as bulge shocking (e.g., Gnedin & Ostriker, 1998; Puzia et al., 2004). Table 2 gives the limiting magnitude, power-law exponent, and radial range considered for the fit in each case. A list of the thirty brightest clusters in the -band in PGC 6510, PGC 10922, and PGC 42871 (with their positions, -band magnitudes and distance from the galaxy center) is given in Table 3. Paper I already contains a list of the brightest clusters in PGC 6240 and it is not repeated here.
4 Globular Cluster Color Distributions
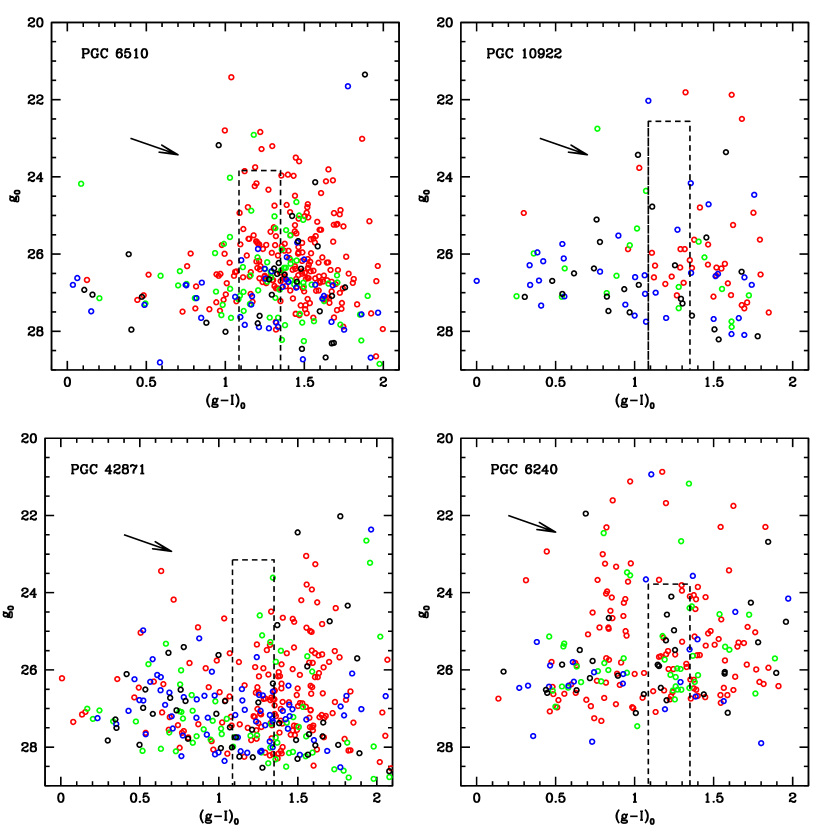
Color–magnitude diagrams for the clusters associated with each galaxy within the limiting galactocentric radius as found in the previous section are shown for equal areas of increasing galactocentric distance in Fig. 5. Note that the magnitudes and colors have been corrected for foreground reddening as described in Sect. 3. For comparison, we indicate the area which would be populated by old metal-poor GCs similar to those in the halo of our Galaxy, scaled to the distance of each galaxy. Typically a large number of GCs with to 1.5 is seen in each galaxy. This color index is similar to, though slightly larger than, the mean index expected for a population of old metal-poor GCs like those in the halo of our Galaxy (e.g., a mean age of 14 Gyr and a mean [Fe/H] of 1.5). Note, however, that this color is also consistent with solar-metallicity clusters of age 1 Gyr as indicated by SSP synthesis models (cf. Fig. 2), the presence of which might be expected in a poststarburst galaxy. Intermediate-age GCs in established merger remnants feature a radial surface number density distribution that is significantly more centrally concentrated than that of old metal-poor GCs (e.g., Whitmore et al., 1997; Goudfrooij et al., 2007). In an attempt to discriminate between the two plausible interpretations of the nature of the GCs with , we therefore divide up the clusters into four equal-area bins of increasing galactocentric radii (see different symbols in Fig. 5). All color distributions appear broader than the halo GC distributions in our Galaxy as outlined by the rectangles. The innermost GCs in most of the galaxies have mean colors that are somewhat redder () than those of old metal-poor GCs. While this could in principle be a result of reddening by dust in the inner regions that shifts the clusters to fainter magnitudes and redder colors, there are very few clusters found in the inner dusty regions. Alternatively, it could indicate the presence of a second-generation population of clusters with ages slightly larger than 1.0 Gyr. A comparison of the dimming vector for a 1.0 Gyr old population aging to 1.6 Gyr (shown in Fig. 5) with the distribution of the inner clusters in the CMD does suggest the possibility of these clusters being slightly older than 1.0 Gyr. Apart from that, there is also a population of (inner) clusters with colors significantly bluer than old metal-poor GCs in PGC 6240. Thus, it appears likely that the GC systems of these poststarburst galaxies are made up of more than a single-age population. The question of how to disentangle the different populations in a quantitative way will be discussed further in the next Section.
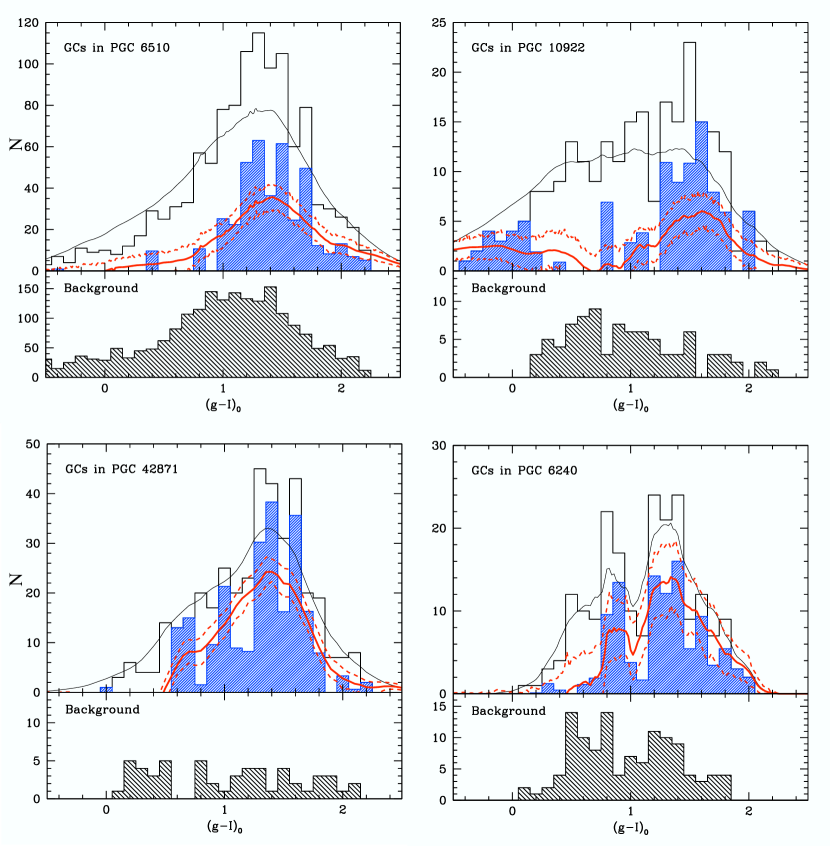
The color distribution of the GCs was analyzed by first computing the non-parametric Epanechnikov-kernel probability-density function (Silverman, 1986) of all objects within the limiting radius. The probability-density function of all objects outside this radius was then computed similarly to provide an estimate of the contamination by compact background galaxies. Finally, the background density estimate was scaled to that of the cluster candidates by area, and the true color distribution of the GCs was derived by statistical subtraction. Figure 6 shows the color distributions of the sources within the limiting radius, the background sources, and the inner sources after statistical background subtraction. The final color distribution appears mostly unimodal in PGC 6510, while that of PGC 42871 shows the possible presence of a second, bluer population similar to that found earlier for PGC 6240 (Maybhate et al., 2007). According to the SSP models of Anders & Fritze-v. Alvensleben (2003) shown in Fig. 2, these can be explained by a metal-rich population with ages of a few hundred Myr. In case of PGC 10922, the color distribution shows some indications of clusters with colors 1.0 and 0.0. However, as they are very few in number, it is difficult to draw any conclusions about them. It is also interesting to note that we do not detect any significant population of old, metal-rich () GCs in any of the sample galaxies (they should show up at ), whereas such a population is generally present in normal early-type galaxies (e.g., Peng et al., 2006). This is discussed further in Section 6.
5 Luminosity Functions
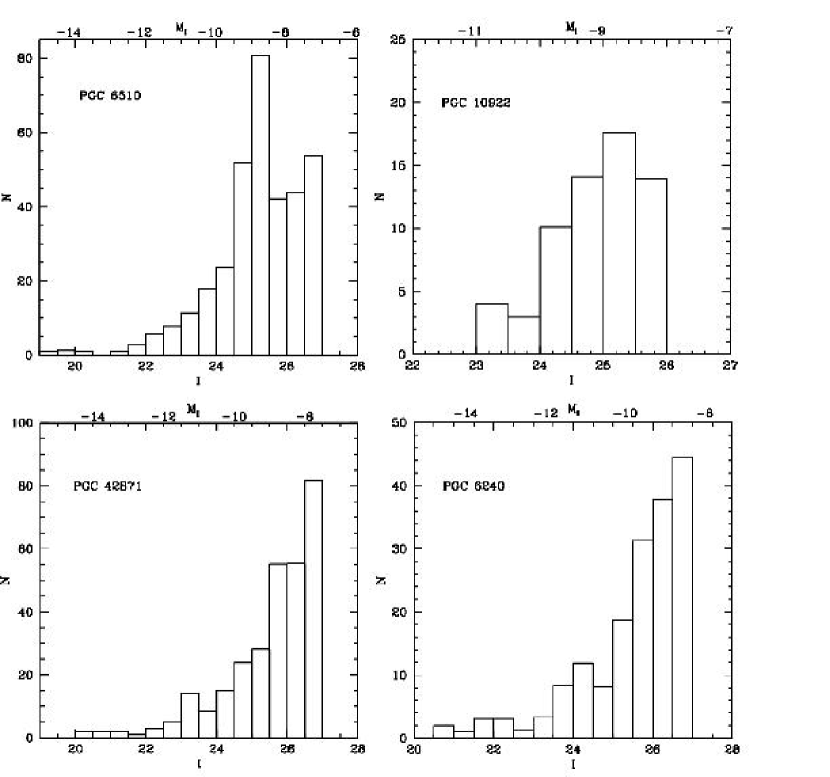
To derive cluster luminosity functions (LFs), we used the completeness curves described in Sect. 3 to assign a completeness value to each cluster. This value was computed via bilinear interpolation in cluster magnitude and background value. Clusters with completeness values less than were excluded from being counted. The remaining clusters were divided into two groups based on their distance from the center of the galaxy. Clusters within the limiting radius (determined in Sect. 3) were designated as actual GC candidates and those outside this radius as likely background contaminants. The LFs of the GC candidates were then corrected for background contamination using the scaled LFs of the background. The final corrected LFs are shown in Fig. 7.
If the LFs were made up entirely of clusters belonging to an old metal-poor population similar to that found in our Galaxy, and hence had a gaussian form with a turn-over at and (Harris, 1996; Barmby, Huchra, & Brodie, 2001), we would not expect to see any clusters brighter than . However, except for PGC 10922, the galaxies in our sample show clusters significantly brighter than this value. While the GC color distribution alone may show no obvious indication of the presence of more than one subpopulation, the fact that overluminous GCs are seen in the LF which are unlikely to belong to an old population suggests that the observed LF is due to the superposition of an old population and a younger population with mean colors that are similar to one another.
For example, the LF of PGC 42871 shows an excess of luminous clusters at magnitudes brighter than . Inspection of the CMD (Fig. 5) shows that these luminous clusters predominantly have colors redder than 1.5 mag and, hence, are not associated with the bluer peak seen in Fig. 6. SSP models show that between the ages of 1 and 2 Gyr, the colors of metal-rich clusters of solar metallicity are indistinguishable from those of typical old metal-poor clusters. However, these intermediate-age clusters are brighter than the old clusters by 1.5 mag for a given mass (Whitmore et al., 1997; Goudfrooij et al., 2001b). Using the SSP models of Anders & Fritze-v. Alvensleben (2003) shown in Fig. 2, we find that the colors of these luminous clusters are consistent with them being intermediate-age clusters (1 – 1.5 Gyr) of solar metallicity.
Our assumption of solar metallicity for these second-generation GCs is based on (a) the expectation of finding high metallicity GCs formed from gas in evolved spirals which are the likely precursor galaxies, and (b) the finding that intermediate-age GCs in other merger remnants have metallicities consistent with solar (e.g., Schweizer & Seitzer, 1998; Goudfrooij et al., 2001a; Schweizer et al., 2004).
5.1 Modeling the Composite LF
As the above example shows, the color distribution of clusters in poststarburst galaxies of age 0.5 – 2 Gyr is not expected to show the signature of two subpopulations prominently because the younger, metal-rich population will have a mean color similar to that of the old metal-poor population. In that case, one way to test for the presence of multiple populations and estimate their properties is to study the LF. In Paper I, we attempted to model the cluster LF of PGC 6240 as a combination of an old metal-poor population and an intermediate-age population. The old population was estimated by fitting template gaussian LF components. These were then subtracted from the observed LF, and the residual LF was used to estimate the contribution of the intermediate-age population by means of least-squares fits. Here we use the same method to investigate the LFs of clusters in PGC 6510, PGC 10922, and PGC 42871 and to explore the possibility of multiple cluster populations of different ages but similar color. For PGC 10922 and PGC 42871, we consider only clusters with to avoid contamination by clusters associated with the bluer peak seen in the color distribution.
We estimate the contributions of the old metal-poor GCs and the intermediate-age GCs in the following manner. First, we compute the total and magnitudes and of the galaxies using the ellipse fitting task and elapert within STSDAS. PGC 42871 and PGC 6240 do not show evidence for their integrated colors being significantly reddened by dust. However, PGC 6510 has redder colors and the color-index map (Fig. 12) also shows strong evidence for patchy dust distributed asymmetrically around the central region. Since the dust distribution is asymmetric about the central region, we use the unreddened regions to compute the reddening in the dusty regions and correct the total magnitudes and color of PGC 6510. The corrected values are given in Table 4. To estimate the gaussian LFs associated with the old metal-poor GC population, we need to apply luminosity fading to the galaxies’ light. Treating the diffuse light of the galaxies as SSPs, we estimate the luminosity-weighted age for a solar-metallicity population from the total integrated color index of each galaxy and look up the expected fading in the and bands when the galaxy ages to 14 Gyr using the GALEV SSP models (see Table 4). A comparison with the Maraston models is also shown in the table. The following calculations are done using values from the GALEV models.
Using the galaxy’s faded value in the equation for the specific frequency:
| (1) |
(i.e., the number of star clusters per galaxy luminosity normalized to an absolute V magnitude of 15 (Harris & van den Bergh, 1981)), we calculate the number of old GCs expected for four typical values of = 3.0, 1.0, 0.5, 0.25. The specific frequency is known to increase systematically along the Hubble sequence, from 0.5 0.2 for Sc spirals to 2.6 0.5 for ellipticals outside of clusters (Harris, 1991). The estimated gaussians for the old metal-poor population were calculated using and (Harris, 1996; Barmby, Huchra, & Brodie, 2001) for each value of . The contributions of the gaussians for each specific frequency are plotted in the left panel of Fig. 8 for each galaxy. The residuals obtained by subtracting these estimated gaussians from the observed LF are shown in the right panel. We find in each case that the residuals are fit well by power laws with exponents between and . These exponents are consistent with values found for young and intermediate-age cluster systems (e.g., Whitmore et al., 1999, 2002; Goudfrooij et al., 2001b, 2004, 2007).
Figure 8 illustrates that the observed luminosity functions can be well modeled as composites of an old metal-poor population, as is normally seen in early-type galaxies, and an intermediate-age population that is more metal-rich. However, note that the relative contributions of these two populations to the total LF vary significantly from galaxy to galaxy: The clusters in PGC 6510 seem to be predominantly intermediate-age metal-rich ones, whereas almost all clusters in PGC 10922 can be attributed to an old metal-poor population. This result is best seen for values of 1.0 and 2.0 [cases (b) and (c) in the top right panel of PGC 10922].
6 The Cluster System – Host Galaxy Connection
In this section we discuss the properties of the cluster systems in the four early-type poststarburst galaxies of our sample in terms of implications related to the assembly of their host galaxies.
6.1 The Nature of the Merger Progenitor Galaxies
The GC color distribution of most normal early-type galaxies is bimodal, including a “blue” peak with a mean color that is similar to that of sentence the end of Section 6.1. metal-poor GCs in the halo of our Galaxy and a “red” peak with a mean color similar to that of the underlying diffuse galaxy light. The mean color of the red peak has been shown to strongly correlate with the luminosity of the parent galaxy (e.g., Larsen et al., 2001; Peng et al., 2006). According to the GALEV models, this peak should be seen at 1.74, 1.83 and 2.02 for 0.2 , 0.4 , and 1.0 respectively. However, we see no clear indication of the presence of this “red peak” in any of the galaxies in our sample. This indicates that the progenitor galaxies lacked any significant number of old, metal-rich GCs typically seen in normal early-type galaxies. This in turn seems to point to late-type spirals as being the progenitors of these poststarburst early-type shell galaxies since old, metal-rich clusters are typically associated with spheroidal components of galaxies (see also Forbes et al., 2001; Goudfrooij et al., 2003). Thus, it seems unlikely that the progenitors of these poststarburst galaxies were ellipticals as also indicated by the presence of shells and other sharp features indicative of former disks.
However, it is interesting to ask whether the sample galaxies will eventually evolve into elliptical galaxies similar to present-day normal ellipticals. A comparison of the GCs of present-day ellipticals with those of our sample galaxies can shed light on this. For any such comparison, we need to take into account the changes in the GC systems of our sample galaxies as they evolve to older ages. One important such change is due to cluster disruption. Star clusters are vulnerable to disruption by a variety of processes operating on different time scales. Since the intermediate-age clusters in our sample are 1 Gyr old, processes such as two-body relaxation, tidal disruption, and dynamical friction all play important roles in removing stars from the cluster (e.g., Fall & Zhang, 2001; Vesperini et al., 2003).
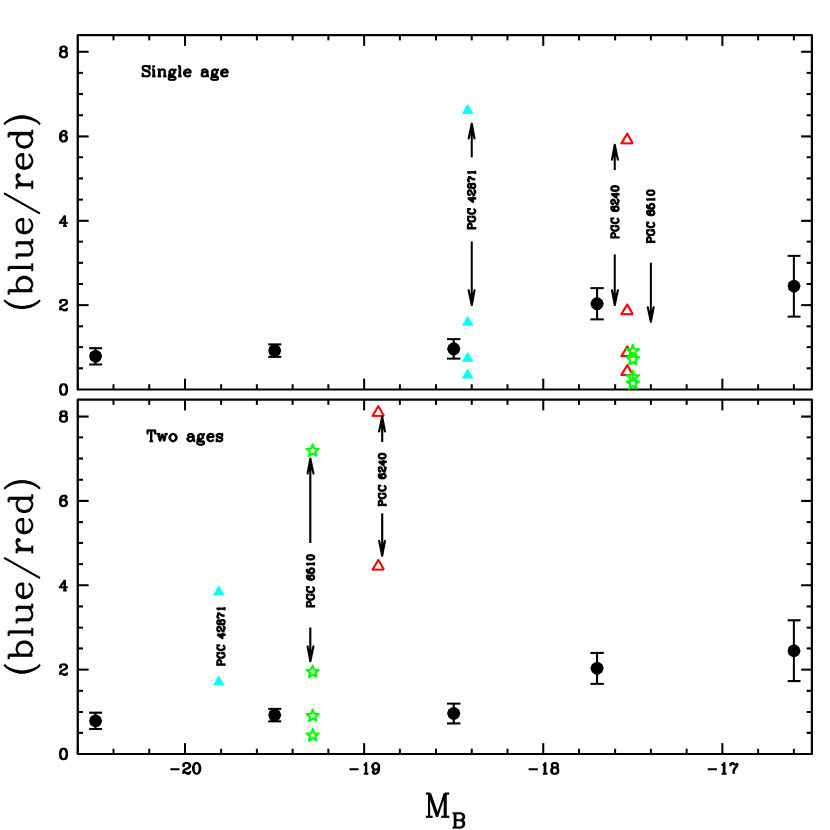
In light of this, we estimate the number of intermediate-age clusters that are expected to survive as the galaxy ages. The mass function of “old” GCs is known to have a turnover at . The number of intermediate-age clusters with masses greater than this value is not expected to be affected by disruption to within 10% (Fall & Zhang, 2001; Goudfrooij et al., 2007). These relatively massive clusters are thus assumed to survive and become “old” metal-rich red GCs as the galaxy ages. This allows us to calculate the number of old metal-poor GCs and the number of expected metal-rich GCs using the results from Fig. 8 for each of the four values of . We derive the expected number of metal-rich GCs in each galaxy by calculating the number of intermediate-age clusters with masses given by the power-law fit, and by applying passive evolution of the galaxies’ -band luminosity to an age of 14 Gyr using the GALEV SSP models. The resulting ratio of metal-poor to metal-rich (i.e., blue to red) clusters thus obtained is compared with that in early-type galaxies of the Virgo cluster (Peng et al., 2006) in the top panel of Fig. 9. We do this for all galaxies except PGC 10922, which does not show evidence for the presence of any significant intermediate-age GC population (see Sect. 5.1 and the Appendix). As the figure shows, the values for PGC 6240 and PGC 42871 are consistent with those for early-type Virgo cluster galaxies if . Under the assumption that these early-type poststarburst galaxies will indeed evolve to become “normal” early-type galaxies at old age, this finding not only suggests that the most likely progenitors of these poststarburst galaxies were spiral galaxies with Hubble types Sb or later (Harris, 1991; Ashman & Zepf, 1998; Goudfrooij et al., 2003; Chandar, Whitmore, & Lee, 2004), but also provides new evidence based on GC system properties to support the view that mergers of such spiral galaxies can indeed produce “normal” early-type galaxies at old age. The presence of strong tidal features in the sample galaxies (and many poststarburst galaxies in general) also suggests disk-dominated progenitors (e.g., Zabludoff et al., 1996; Mihos & Hernquist, 1996).
Note that the above analysis was performed by taking into account the luminosity-weighted age of the galaxies. Table 4 shows that the integrated colors of PGC 6240 and PGC 42871 are indeed consistent with those of their intermediate-age GC populations. Hence, this assumption seems fair for those two galaxies. However, for PGC 6510, the integrated color of the galaxy is somewhat redder than that of the intermediate-age GC population. To evaluate whether this difference may account for its low values of the ratio of the number of metal-poor to metal-rich clusters seen in the top panel of Fig. 9, we consider the alternative scenario where the diffuse light of the galaxies is produced by a combination of an old and a young population (i.e., that the galaxy in question is an “E+A” galaxy333 Many papers now use the more general term k+a, where the k stands for the spectral type of an old stellar population (e.g., Franx, 1993).). In this context, we assign the young population to have an age as indicated by the Balmer line equivalent widths in the central spectra of Carter et al. (1988, see Appendix A), and to have solar metallicity. For the old population, we estimate a metallicity by evaluating the galaxies’ absolute -band magnitudes relative to that of NGC 4472, the brightest elliptical galaxy in the Virgo cluster, and then utilizing the [Fe/H] versus galaxy relation of Peng et al. (2006, transformed to using galaxy magnitudes from 2MASS). Using the GALEV SSP models and the Maraston models, we then model the integrated color of the galaxies (listed in Table 4) as a linear combination of an old component (with an age of 14 Gyr) plus a young component (with an age determined as mentioned above). Finally, the luminosity fading of this composite galaxy to an effective age of 14 Gyr is derived by fading only the young component. Table 5 lists all relevant fading values for the sample galaxies.
Using the faded magnitudes thus obtained, we repeat the procedure in Section 5.1 and model the GC luminosity function as a superposition of an old metal-poor and an intermediate-age metal-rich population, and re-derive the predicted ratio of the number of blue to red GCs at an age of 14 Gyr. For PGC 6240 and PGC 42871, this exercise results in a predicted number of old metal-poor GCs that far exceeds the number of GCs observed, even at the brightest GC magnitudes. This indicates that the use of luminosity-weighted ages to model the contributions of the metal-poor and metal-rich GCs gives more realistic results than using a combination of ages for those two galaxies. This is consistent with the fact that the integrated colors of those two galaxies are very similar to the mean color of their intermediate-age GCs. On the other hand, for PGC 6510, we find that the scenario involving a combination of young and old ages yields a prediction for the number ratio of the blue to red GCs that is fully consistent with those of normal early-type galaxies if the progenitor galaxies had (see bottom panel of Fig. 9 and right panel of Fig. 10). The case of PGC 6510 will be discussed in greater detail in Sect. 6.3 below. The above analysis was also done using the Maraston models. However, we do not find significant differences between the results obtained using either model.
6.2 The Spatial Extent of the Poststarburst Population
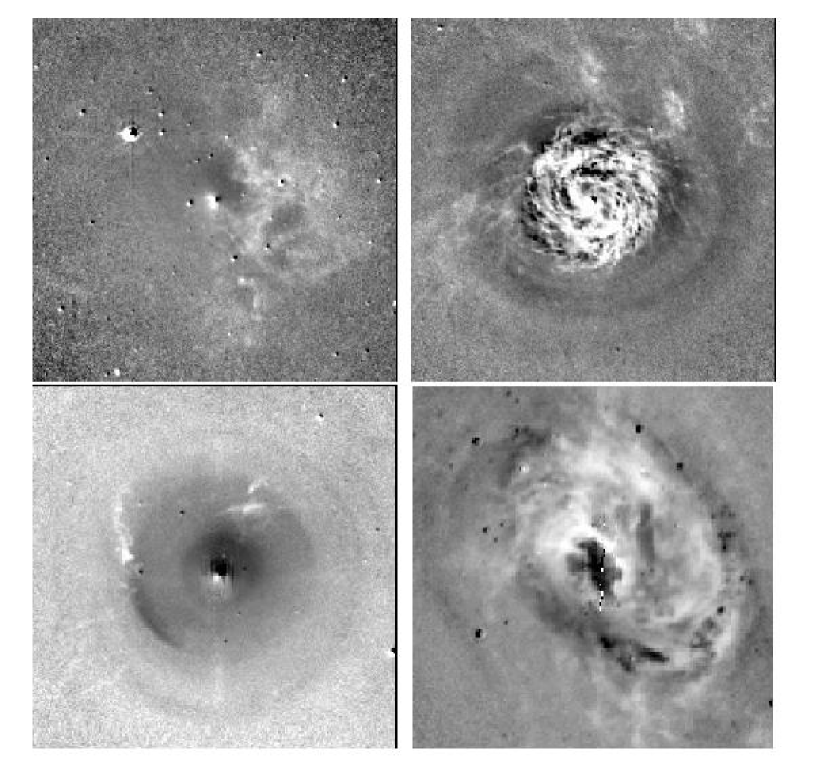
To address the spatial extent of the poststarburst population in the sample galaxies, we use the radial color distribution of the host galaxy as a proxy. Bartholomew et al. (2001) find that poststarburst galaxies in distant clusters tend to have slightly bluer gradients towards the center than “normal” early-type galaxies. Recent numerical simulations by Bekki et al. (2005) suggest that elliptical E+A galaxies formed by major mergers should have positive radial color gradients (i.e., bluer color in the inner regions). Examining the radial color-index profile of the underlying galaxies obtained from the ellipse fits made in the two passbands, we find that PGC 6240 and PGC 42871 get redder outwards, whereas PGC 6510 and PGC 10922 show redder colors in the inner regions (Fig. 11). This behavior is also seen in the two-dimensional color-index maps shown in Fig. 12. It may well be relevant that the two galaxies that show evidence for hosting the youngest GC populations (i.e., PGC 6240 and PGC 42871) also show the bluest color in their central regions. These two galaxies also have the strongest H equivalent widths in their nuclear spectrum among the sample galaxies (Carter et al., 1988, see also Appendix A). The other two galaxies (PGC 6510 and PGC 10922) show dusty central regions (especially PGC 10922), and it seems likely that the central reddening in their radial color distributions can at least partly be attributed to dust (cf. Fig. 12). Note that the inner color profiles of the latter two galaxies show a dip to bluer colors towards their very center (Fig. 11), which may well represent a signature of the poststarburst population in these galaxies. However, Figs. 11 and 12 seem to argue that the spatial extent of the poststarburst population in PGC 10922 and (to a lesser extent) PGC 6510 is smaller than that in PGC 6240 and PGC 42871. We note that this finding is reinforced by the properties of the GC systems of these galaxies. We suggest that deep optical spectra of the target galaxies be obtained to verify the spatial extent of the poststarburst population. This would also provide quantitative information on the issue as to how well the integrated color of the target galaxies can reliably be interpreted as a simple stellar population, which is relevant to analyses related to the evolution of GC specific frequencies in intermediate-age galaxies (cf. Sect. 6.1).
6.3 The remarkable GC system of PGC 6510
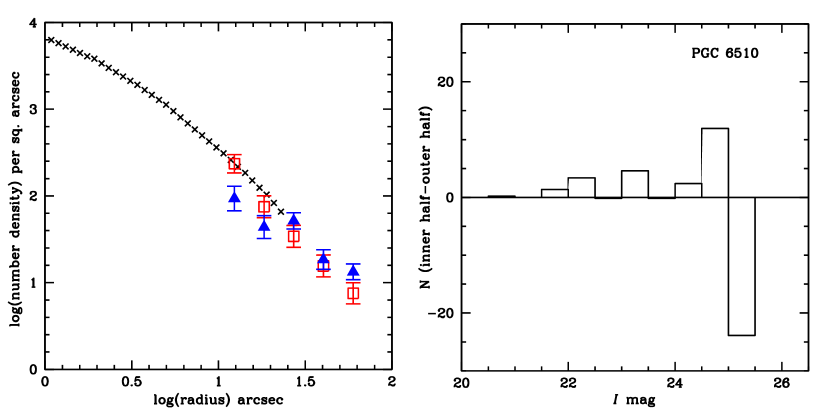
As mentioned briefly in Sect. 5.1, the GC system of PGC 6510 shows some interesting properties. Figures 8 and 9 show that if the current integrated color of PGC 6510 is interpreted in terms of an SSP (i.e., a single age and metallicity), the modeling in Sect. 5 results in the old metal-poor GCs making up an unexpectedly small fraction of the total GC system unless the progenitor galaxies had an unusually high specific frequency of old metal-poor GCs (). This result seems somewhat counterintuitive, since such high values are unknown among gas-rich galaxies, whereas a significant amount of gas was needed to trigger the starburst that led to the poststarburst spectrum and the formation of the significant number of intermediate-age GCs. However, in case of the alternative scenario in which the integrated color of PGC 6510 is due to a superposition of a young and an old component (see Sect. 6.1 above for details), our modeling shows that progenitor galaxies with values of 0.5 – 1 (typical for late-type galaxies) can account for a more significant fraction of GCs in PGC 6510 being of the old metal-poor kind, especially at the faint end of the LF (compare Fig. 10 with the top left panel of Fig. 8). To further constrain the fractions of GCs in this galaxy that are of intermediate age versus old, we utilize the large size of the GC population to compare the radial surface number density profiles of the bright vs. the faint GCs in this galaxy. To avoid introducing a bias due to the high background in the innermost regions of the galaxy, we first determine the background level at which a GC of magnitude = 25.5 is detected at completeness and discard all GCs at higher background levels for this exercise. We then calculate the completeness-corrected surface-number densities of the brightest and the faintest of the GCs selected this way. We find that the surface-number-density profile of the bright GCs follows the surface brightness profile of the galaxy very closely (see Fig. 13, left panel), whereas the faint GCs show a more extended radial distribution. This reinforces the idea that the brightest GCs are primarily intermediate-age ones since the radial profile of intermediate-age GCs is expected to follow the surface brightness profile of the parent galaxy (e.g., Schweizer et al., 1996; Whitmore et al., 1997; Goudfrooij et al., 2007). We also plot the completeness- and background-corrected LFs of the inner half and the outer half of the GC system (within the outer radius beyond which objects were assigned to the background) and find that the inner half of the GC system hosts relatively more bright GCs (see Fig. 13, right panel). Both of the above results lend credence to the idea that PGC 6510 hosts a significant number of intermediate-age GCs and that old GCs populate the LF mainly at fainter magnitudes, as predicted by our modeling in Sect. 6 for the case of a composite age structure for the diffuse light of PGC 6510.
7 Summary and Conclusions
We have analyzed HST/ACS images of four early-type shell galaxies, for which spectroscopy of the central region revealed a poststarburst spectrum, in order to study the properties of their globular cluster systems. Our results are summarized as follows.
-
•
The color distributions of the globular clusters in all four galaxies show a broad peak centered on , while PGC 6240 and PGC 42871 also have a significant number of GCs with . The mean color of the former peak is consistent with SSP model predictions for both an old ( 14 Gyr), metal-poor ([Z/H] ) population and an intermediate-age (1 – 2 Gyr) population of roughly solar metallicity. The GCs with are interpreted as being of age 500 Myr and likely having formed in the merger. Except for PGC 10922, the galaxies host several GCs in the redder peak that are brighter than the maximum luminosity expected of a single old, metal-poor “halo” GC of the kind commonly found around normal galaxies. To test for multiple populations of overlapping color around , we fit the observed GCLFs as composites of a Gaussian (as seen in “old” GC systems) and a power law (seen in young and intermediate-age GC systems). By scaling the Gaussian component using plausible values of the specific frequencies ( values) of old metal-poor GCs seen in present-day normal galaxies, we find the following:
-
1.
We deduce the presence of a substantial population of intermediate-age GCs in three out of four galaxies in our sample. These GCs have ages between 1 – 1.5 Gyr which is comparable to typical lifetimes of the shells, providing evidence that these GCs likely formed during the same merger event that formed the shells.
-
2.
The integrated colors of PGC 6240 and PGC 42871 are consistent with those of the intermediate-age GCs, suggesting that the bulk of the field stars were formed in the same star formation event that formed the intermediate-age GCs. Interpreting the integrated light of PGC 6240 and PGC 42871 as a single-age stellar population of solar metallicity, the ratio of the numbers of metal-poor to metal-rich GCs are consistent with those of present-day (giant) early-type galaxies if the values of the merger progenitor galaxies were in the range . This range of values is consistent with that of late-type spiral galaxies. Under the assumption that these early-type poststarburst galaxies will indeed evolve to become “normal” early-type galaxies at old age, this finding not only suggests that the most likely progenitors of the poststarburst galaxies in our sample were late-type spiral galaxies, but also provides new evidence (based on GC system properties) to support the view that mergers of such spiral galaxies can indeed produce “normal” early-type galaxies at old age.
-
3.
The integrated color of PGC 6510 is redder than that of its bright GCs that are very likely of intermediate age, suggesting that a significant fraction of the field stars are older than those GCs. Interpreting the integrated light of PGC 6510 as a superposition of a young population (with solar metallicity) and a 14-Gyr old population (with a metallicity estimated from the galaxy’s -band luminosity), the ratio of the numbers of metal-poor to metal-rich GCs is consistent with those of present-day (giant) early-type galaxies if the values of the merger progenitor galaxies were in the range , just like the situation for PGC 6240 and PGC 42871. GCs at the bright end of the GCLF in PGC 6510 follow the surface brightness profile of the parent galaxy closely, supporting the notion that they are indeed intermediate-age clusters. In contrast, GCs at the faint end of the LF (but still at 80% completeness) show a flatter surface number density profile, consistent with the presence of a significant fraction of old GCs among the fainter GCs.
-
4.
We find no evidence for the presence of intermediate-age GCs in PGC 10922, the galaxy with the smallest H equivalent width in its nuclear spectrum among our sample. This may partly be due to the presence of a very dusty inner region (of 3 kpc diameter), which prevents the detection of any GCs there. This would imply that the star formation activity that was responsible for the poststarburst spectrum of the galaxy was confined to that inner dusty region. The properties of the population of old metal-poor GCs in this galaxy are similar to those in PGC 6240 and PGC 42871.
-
1.
-
•
The color distributions of GCs in all four galaxies appear devoid of any old metal-rich clusters, which are generally associated with the spheroidal component of (early-type) galaxies. This indicates that the progenitor galaxies must have lacked any substantial bulge and were most likely of late Hubble type.
In closing, we note that our analysis is based on – and –band imaging and, hence, on magnitudes and one color index only. Given the age-metallicity degeneracy among optical colors (e.g., Fig. 2), additional spectra and/or near-infrared icolors will clearly be needed to check the ages and metallicities deduced for the second-generation GCs.
Early-type poststarburst galaxies are thought to represent an intermediate phase in the formation of (at least) some elliptical galaxies from mergers. Our results, based on properties of GC systems of such galaxies, generally support the idea that mergers of spiral galaxies are accompanied by the formation of clusters which evolve and form the old, metal-rich peak of the GC color distribution as the merger remnant evolves into an elliptical galaxy.
Appendix A Notes on individual galaxies
PGC 6510: The equivalent width (EW) of H in the central spectrum for this galaxy is Å (Carter et al., 1988). This indicates an age of 1 Gyr from a comparison with the Bruzual & Charlot (2003) models of solar metallicity. Using the integrated colors and the Anders & Fritze-v. Alvensleben (2003) models as described in Section 5.1, the luminosity-weighted age for this galaxy is found to be 1.8 Gyr. The GC color distribution appears unimodal. However, the LF shows an excess of bright clusters. This LF is modeled as a composite of an old metal-poor GC population and an intermediate-age cluster population having the same color. This modeling shows that most of the clusters detected in this galaxy are of intermediate age. The color-index map of PGC 6510 shows an asymmetrical dust distribution (Fig. 12). The properties of the GC system of this galaxy are somewhat peculiar and do not seem to be consistent with those of the other galaxies in the sample or with normal present-day ellipticals, unless significant disruption of the newly formed clusters will take place over the next 10 Gyr. However, modeling the diffuse light of the galaxy as a combination of an old and a young population gives plausible results for the properties of the GC systems.
PGC 10922: The H EW for this galaxy is Å, which implies an age of 1.5 Gyr from Bruzual & Charlot (2003). The luminosity-weighted age is found to be 2.2 Gyr. The nuclear spectrum of this galaxy resembles a poststarburst spectrum but we do not see evidence for large-scale star formation. This galaxy has the reddest color in the central region among the sample galaxies. This is also seen in the map, where the central region appears surrounded by a circular dust ring with spurs. It seems plausible that the poststarburst population is localized near the center and the dusty structure in this region prevents us from detecting any clusters there.
PGC 42871: The H EW is Å, implying an age of 0.3 Gyr. The luminosity-weighted age of the galaxy is about 1 Gyr. The color distribution of the GCs suggests an excess of objects at , which is interpreted as representing a population of younger-age ( 80 – 200 Myr) clusters based on a comparison with SSP models of solar metallicity. The redder peak at = 1.35 is likely made up of a composite population of old metal-poor clusters and intermediate-age solar-metallicity clusters, as discussed in Section 5. Thus, we find evidence for the presence of three separate subpopulations of GCs in this galaxy.
PGC 6240: The H EW for this galaxy is Å, which corresponds to an age of 0.3 Gyr. The luminosity-weighted age is found to be about 1 Gyr. This galaxy clearly shows bimodality in its color distribution with the bluer peak at = 0.85 consistent with a 0.4 Gyr old cluster population of solar metallicity. The brightest shell associated with the galaxy harbors some of the youngest clusters (Maybhate et al., 2007). The red clusters are modeled as a composite of an old metal-poor population and an intermediate-age population. Hence, we find evidence for the presence of three subpopulations of GCs in this galaxy as well.
References
- Anders & Fritze-v. Alvensleben (2003) Anders, P., & Fritze-v. Alvensleben, U. 2003, A&A, 401, 1063
- Ashman & Zepf (1998) Ashman, K.M., & Zepf, S.E. 1998, Globular Cluster Systems (Cambridge Univ. Press)
- Ashman & Zepf (1992) Ashman, K.M., & Zepf, S.E. 1992, ApJ, 384, 50
- Barmby, Huchra, & Brodie (2001) Barmby, P., Huchra, J.P., & Brodie, J, P. 2001, AJ, 121, 1482
- Bartholomew et al. (2001) Bartholomew, L.J., Rose, J.A., & Gaba, A.E. 2001, AJ, 122, 2913
- Bekki et al. (2005) Bekki, K., Couch, W.J., Shioya, Y., & Vazdekis, A. 2005, MNRAS, 359, 949
- Brown et al. (2000) Brown, R.J.N., Forbes, D.A., Kissler-Patig, M., & Brodie, J.P. 2000, MNRAS, 317, 406
- Bruzual & Charlot (2003) Bruzual, G.A., & Charlot, S. 2003, MNRAS, 344, 1000
- Burstein & Heiles (1982) Burstein, D., & Heiles, C. 1982, AJ, 87, 1165
- Buyle et al. (2006) Buyle, P., Michielsen, D., De Rijcke, S., Pisano, D.J., Dejonghe, H., & Freeman, K. 2006, ApJ, 649, 163
- Carter et al. (1988) Carter, D., Prieur, J.L., Wilkinson, A., Sparks, W.B., & Malin, D.F. 1988, MNRAS, 235, 813
- Chandar, Whitmore, & Lee (2004) Chandar, R., Whitmore, B. C., & Lee, M. G. 2004, ApJ, 611, 220
- di Matteo et al. (2007) di Matteo, P., Combes, F., Melchior, A.-L., & Semelin, B. 2007, A&A, 468, 61
- Dressler & Gunn (1983) Dressler, A., & Gunn, J.E. 1983, ApJ, 270, 7
- Dupraz & Combes (1986) Dupraz, C., & Combes, F. 1986, A&A, 166, 53
- Fall & Zhang (2001) Fall, S.M., & Zhang, Q. 2001, ApJ, 561, 751
- Forbes et al. (2001) Forbes, D.A., Beasley, M.A., Brodie, J.P., & Kissler-Patig, M. 2001, ApJ, 563, L143
- Franx (1993) Franx, M. 1993, PASP, 105, 1058
- Gnedin & Ostriker (1998) Gnedin, O.Y., & Ostriker, J.P. 1998, ASPC, 136, 56
- Goudfrooij et al. (2001a) Goudfrooij, P., Mack, J., Kissler-Patig, M., Meylan, G., & Minniti, D. 2001a, MNRAS, 322, 643
- Goudfrooij et al. (2001b) Goudfrooij, P., Alonso, M.V., Maraston, C., & Minniti, D. 2001b, MNRAS, 328, 237
- Goudfrooij et al. (2003) Goudfrooij, P., Strader, J., Brenneman, L., Kissler-Patig, M., Minniti, D., & Huizinga, E.J. 2003, MNRAS, 343, 665
- Goudfrooij et al. (2004) Goudfrooij, P., Gilmore, D., Whitmore, B.C., Schweizer, F. 2004, ApJ, 613, L121
- Goudfrooij et al. (2007) Goudfrooij, P., Schweizer, F., Gilmore, D., & Whitmore, B.C. 2007, AJ, 133, 273
- Harris & Racine (1979) Harris, W.E., & Racine, R. 1979, ARA&A, 17, 241
- Harris & van den Bergh (1981) Harris, W.E., & van den Bergh, S. 1981, AJ, 86, 1627
- Harris (1986) Harris, W.E. 1986, AJ, 91, 822
- Harris (1991) Harris, W.E. 1991, ARA&A, 29, 543
- Harris (1996) Harris, W.E. 1996, AJ, 112, 1487
- Hau et al. (1999) Hau, G.K.T., Carter, D., & Balcells, M. 1999, MNRAS, 306, 437
- Hernquist & Quinn (1988) Hernquist, L., & Quinn, P. 1988, ApJ, 331, 682
- Hernquist & Quinn (1989) Hernquist, L., & Quinn, P. 1989, ApJ, 342, 1
- Jordán et al. (2005) Jordán, A., Côte, P., Blakeslee, J. P., et al. 2005, ApJ, 634, 1002
- Kaviraj et al. (2007) Kaviraj, S., Kirkby, L.A., Silk, J., & Sarzi, M. 2007, astro-ph/0707.3570
- Koekemoer et al. (2002) Koekemoer, A.M., Fruchter, A.S., Hook, R.N., & Hack, W. 2002, in The 2002 HST Calibration Workshop: Hubble after the Installation of the ACS and the NICMOS Cooling System, ed. S. Arribas, A. Koekemoer, & B. Whitmore (Baltimore: Space Telescope Science Institute), 337
- Kundu et al. (2005) Kundu, A., et al. 2005, ApJ, 634L, 41
- Kundu & Whitmore (2001) Kundu, A., & Whitmore, B. C. 2001, AJ, 121, 2950
- Larsen et al. (2001) Larsen, S. S., Brodie, J. P., Huchra, J. P., Forbes, D. A., & Grillmair, C. J., 2001, AJ, 121, 2974
- Larsen et al. (2003) Larsen, S.S., Brodie, J.P., Beasley, M.A., Forbes, D.A., Kissler-Patig, M., Kuntschner, H., & Puzia, T.H. 2003, ApJ, 585, 767
- Malin & Carter (1983) Malin, D.F., & Carter, D. 1983, ApJ, 274, 534
- Maraston (2005) Maraston, C. 2005, MNRAS, 362, 799
- Maybhate et al. (2007) Maybhate, A., Goudfrooij, P., Schweizer, F., Puzia, T., & Carter, D. 2007, AJ, 134, 1729 (Paper I)
- Mihos & Hernquist (1996) Mihos, J. C., & Hernquist, L. 1996, ApJ, 464, 641
- Miller et al. (1997) Miller, B.W., Whitmore, B.C., Schweizer, F., & Fall, S.M. 1997, AJ, 114, 2381
- Minniti et al. (1996) Minniti, D., Alonso, M.V., Goudfrooij, P., Jablonka, P., & Meylan, G. 1996, ApJ, 467, 221
- Peng et al. (2004) Peng, E.W., Ford, H.C., & Freeman, K.C. 2004, ApJ, 602, 705
- Peng et al. (2006) Peng, E., et al. 2006, ApJ, 639, 95
- Pessev et al. (2008) Pessev, P.M., Goudfrooij, P., Puzia, T.H., & Chandar, R. 2008, arXiv:0801.2375
- Puzia et al. (2002) Puzia, T.H., Zepf, S.E., Kissler-Patig, M., Hilker, M., Minniti, D., & Goudfrooij, P. 2002, A&A, 391, 453
- Puzia et al. (2004) Puzia, T.H., et al. 2004, A&A, 123, 143
- Quinn (1984) Quinn, P.J. 1984, ApJ, 279, 596
- Salpeter (1955) Salpeter, E.E. 1955, ApJ, 121, 161
- Schweizer (1987) Schweizer, F. 1987, in Nearly Normal Galaxies, ed. S.M. Faber (New York: Springer), 18
- Schweizer et al. (1996) Schweizer, F., Miller, B.W., Whitmore, B.C., & Fall, S.M. 1996, AJ, 112, 1839
- Schweizer (1998) Schweizer, F. 1998, in Galaxies: Interactions and Induced Star Formation, ed. D. Friedli, L. Martinet, & D. Pfenniger (New York: Springer), 105
- Schweizer & Seitzer (1998) Schweizer, F., & Seitzer, P. 1998, AJ, 116, 2206
- Schweizer et al. (2004) Schweizer, F., Seitzer, P., & Brodie, J, P. 2004, AJ, 128, 202
- Silverman (1986) Silverman, B.W. 1986, in Density Estimation for Statistics and Data Analysis, Chap and Hall/CRC Press, Inc.
- Sirianni et al. (2005) Sirianni, M., et al. 2005, PASP, 117,1409
- Skrutskie et al. (2006) Skrutskie, M.F., et al. 2006, AJ, 131, 1163
- Thomson (1991) Thomson, R.C. 1991, MNRAS, 253, 256
- Thomson & Wright (1990) Thomson, R.C., & Wright, A.E. 1990, MNRAS, 247, 122
- van den Bergh & Mackey (2004) van den Bergh, S., & Mackey, A. D. 2004, MNRAS, 354, 713
- Vesperini & Zepf (2003) Vesperini, E., & Zepf, S. E., ApJ, 587, L97
- Vesperini et al. (2003) Vesperini, E., Zepf, S. E., Kundu, A., & Ashman, K. M. 2003, ApJ, 593, 760
- Whitmore et al. (1997) Whitmore, B.C., Miller, B.W., Schweizer, F., & Fall, S.M. 1997, AJ, 114, 1797
- Whitmore et al. (1999) Whitmore, B. C., Zhang, Q., Leitherer, C., Fall, S. M., Schweizer, F., & Miller, B. W. 1999, AJ, 118, 155
- Whitmore et al. (2002) Whitmore, B. C., Schweizer, F., Kundu, A., & Miller, B. W. 2002, AJ, 124, 147
- Zabludoff et al. (1996) Zabludoff, A.I., Zaritsky, D., Lin, H., Tucker, D., Hashimoto, Y., Schectman, S.A., Oemler, A., & Kirshner, R.P. 1996, ApJ, 466, 104
| Parameter | PGC 6510 | PGC 10922 | PGC 42871 | PGC 6240 |
|---|---|---|---|---|
| Malin & Carter (1983) | MC 0148836 | MC 0247833 | MC 1241339 | MC 0140658 |
| Alternative name | – | ESO 003 G 013 | AM 1241335 | AM 0139655 |
| RA∗(J2000) | 1h 46m 21.9s | 2h 53m 35.9s | 12h 44m 05.2s | 1h 41m 30.98s |
| Dec∗(J2000) | 23 59 | 08 32 | 12 07 | 36 55.4 |
| Type | E-S0 | S0 | S0-a | S0 |
| (km s -1) | 4652 15 | 4819 15 | 6074 15 | 8216 15 |
| (km s -1) | 4365 | 4529 | 5944 | 7936 |
| Velocity disp. (km s -1) | 181.9 68.7 | 189.9 59.1 | 178.7 48.8 | 249.1 46.5 |
| Distance (Mpc)∗∗ | 58.2 | 60.4 | 79.2 | 105.8 |
| 33.82 | 33.90 | 34.49 | 35.12 | |
| 20.08 | 20.47 | 21.46 | 20.57 | |
| 23.00 | 24.19 | 24.65 | 24.50 | |
| 0.45 | 0.44 | 0.30 | 0.0 |
Note. — All other parameters are taken from LEDA (http://leda.univ-lyon1.fr/ or computed using values from LEDA and = 75 km s )
| Galaxy | -band cut-off | Radial range(″) | Power-law exponent |
|---|---|---|---|
| PGC 6510 | 26.0 | 14 – 137 | |
| PGC 10922 | 25.8 | 17 – 178 | |
| PGC 42871 | 25.0 | 7 – 115 | |
| PGC 6240 | 26.6 | 6 – 108 |
| RA (2000) | Dec (2000) | (mag) | (mag) | |
|---|---|---|---|---|
| PGC 6510 | ||||
| 1 46 22.42 | 83 23 58.74 | 20.38 0.01 | 1.04 0.01 | 1.30 |
| 1 46 19.78 | 83 23 58.71 | 21.15 0.01 | 1.87 0.02 | 3.22 |
| 1 46 26.14 | 83 24 13.69 | 21.62 0.01 | 1.22 0.02 | 16.48 |
| 1 46 06.90 | 83 24 30.83 | 21.73 0.01 | 1.18 0.02 | 40.34 |
| 1 46 21.52 | 83 24 01.83 | 21.80 0.01 | 1.00 0.03 | 2.91 |
| 1 46 20.21 | 83 23 48.45 | 21.91 0.01 | 1.30 0.02 | 10.62 |
| 1 46 26.85 | 83 23 56.99 | 22.05 0.01 | 1.23 0.02 | 9.02 |
| 1 46 20.55 | 83 24 01.64 | 22.05 0.02 | 1.45 0.05 | 3.31 |
| 1 46 22.77 | 83 23 55.09 | 22.13 0.02 | 1.47 0.03 | 4.21 |
| 1 46 13.62 | 83 23 47.14 | 22.15 0.01 | 1.65 0.02 | 17.97 |
| 1 46 53.05 | 83 24 22.08 | 22.22 0.01 | 0.96 0.02 | 58.13 |
| 1 46 15.32 | 83 23 52.50 | 22.41 0.01 | 1.68 0.03 | 12.52 |
| 1 46 13.79 | 83 23 53.05 | 22.48 0.01 | 1.64 0.03 | 14.61 |
| 1 46 08.92 | 83 24 16.34 | 22.54 0.01 | 1.43 0.03 | 27.72 |
| 1 46 22.67 | 83 23 54.19 | 22.55 0.02 | 1.40 0.04 | 4.95 |
| 1 46 34.19 | 83 24 02.90 | 22.56 0.01 | 1.19 0.02 | 21.69 |
| 1 46 20.87 | 83 23 02.92 | 22.57 0.01 | 1.57 0.03 | 55.33 |
| 1 46 17.91 | 83 23 56.47 | 22.61 0.01 | 1.35 0.03 | 6.83 |
| 1 46 21.59 | 83 23 56.69 | 22.73 0.03 | 1.12 0.06 | 2.18 |
| 1 46 23.09 | 83 24 08.91 | 22.81 0.02 | 1.61 0.03 | 10.19 |
| 1 46 27.70 | 83 23 46.24 | 22.97 0.02 | 1.20 0.03 | 16.19 |
| 1 46 22.08 | 83 23 18.06 | 22.99 0.02 | 1.03 0.03 | 40.35 |
| 1 46 26.61 | 83 24 02.48 | 23.05 0.02 | 1.44 0.04 | 9.13 |
| 1 46 17.28 | 83 24 05.53 | 23.05 0.02 | 1.19 0.03 | 9.94 |
| 1 46 24.86 | 83 23 53.34 | 23.06 0.02 | 1.27 0.04 | 7.72 |
| 1 46 20.92 | 83 23 58.87 | 23.13 0.06 | 1.73 0.20 | 1.27 |
| 1 46 17.04 | 83 23 59.59 | 23.18 0.02 | 1.52 0.04 | 7.92 |
| 1 46 07.54 | 83 23 37.82 | 23.20 0.02 | 1.45 0.04 | 31.83 |
| 1 46 20.99 | 83 23 55.94 | 23.24 0.03 | 1.91 0.11 | 3.14 |
| 1 46 22.86 | 83 23 53.04 | 23.25 0.02 | 1.72 0.05 | 6.13 |
| PGC 10922 | ||||
| 2 53 27.25 | 83 08 46.14 | 20.26 0.01 | 1.61 0.01 | 20.10 |
| 2 52 51.47 | 83 09 30.32 | 20.34 0.01 | 1.11 0.01 | 97.72 |
| 2 53 40.62 | 83 09 01.99 | 20.49 0.01 | 1.32 0.01 | 30.66 |
| 2 53 14.73 | 83 08 19.50 | 20.82 0.01 | 1.68 0.01 | 39.62 |
| 2 53 48.11 | 83 09 27.39 | 20.84 0.01 | 2.04 0.01 | 59.12 |
| 2 54 11.37 | 83 08 11.53 | 20.94 0.01 | 1.09 0.01 | 67.51 |
| 2 52 31.78 | 83 08 46.46 | 21.63 0.01 | 0.91 0.01 | 115.08 |
| 2 54 28.47 | 83 08 24.44 | 21.74 0.01 | 0.74 0.01 | 95.09 |
| 2 53 31.85 | 83 07 07.20 | 21.78 0.01 | 1.58 0.01 | 85.75 |
| 2 53 42.42 | 83 10 15.81 | 21.80 0.01 | 1.48 0.01 | 103.85 |
| 2 54 35.12 | 83 09 04.06 | 21.87 0.01 | 1.22 0.01 | 111.08 |
| 2 53 46.48 | 83 07 37.37 | 21.99 0.01 | 0.76 0.01 | 58.67 |
| 2 53 44.58 | 83 06 52.96 | 22.24 0.01 | 1.02 0.01 | 101.03 |
| 2 52 46.70 | 83 08 00.83 | 22.41 0.01 | 1.02 0.01 | 93.21 |
| 2 52 28.29 | 83 08 47.67 | 22.58 0.01 | 1.42 0.01 | 121.42 |
| 2 53 21.37 | 83 07 18.51 | 22.71 0.01 | 1.76 0.02 | 78.43 |
| 2 53 50.39 | 83 08 33.09 | 22.74 0.01 | 1.03 0.01 | 26.52 |
| 2 52 40.81 | 83 09 12.94 | 22.80 0.01 | 1.82 0.02 | 105.97 |
| 2 54 11.23 | 83 09 14.10 | 22.81 0.01 | 1.35 0.02 | 76.05 |
| 2 53 35.25 | 83 08 58.09 | 23.18 0.01 | 1.75 0.02 | 25.41 |
| 2 53 19.84 | 83 07 16.66 | 23.24 0.01 | 1.47 0.02 | 81.10 |
| 2 53 07.95 | 83 07 51.23 | 23.29 0.01 | 1.07 0.02 | 64.59 |
| 2 53 49.22 | 83 08 31.17 | 23.38 0.01 | 1.41 0.02 | 24.47 |
| 2 53 35.03 | 83 08 21.60 | 23.62 0.02 | 1.62 0.03 | 11.13 |
| 2 54 11.87 | 83 07 35.29 | 23.66 0.02 | 1.11 0.02 | 86.75 |
| 2 53 34.44 | 83 08 04.21 | 23.83 0.02 | 1.79 0.04 | 28.55 |
| 2 53 57.73 | 83 09 36.50 | 24.10 0.02 | 1.27 0.03 | 75.11 |
| 2 53 22.87 | 83 07 11.32 | 24.12 0.02 | 1.45 0.04 | 84.51 |
| 2 54 01.96 | 83 07 23.31 | 24.20 0.02 | 2.12 0.06 | 83.97 |
| 2 53 52.48 | 83 08 44.55 | 24.24 0.02 | 2.04 0.06 | 32.50 |
| PGC 42871 | ||||
| 12 44 03.53 | 34 10 29.57 | 20.25 0.01 | 1.77 0.01 | 101.29 |
| 12 43 58.46 | 34 12 16.48 | 20.40 0.01 | 1.96 0.01 | 84.57 |
| 12 44 10.70 | 34 11 47.39 | 20.72 0.01 | 1.93 0.01 | 70.86 |
| 12 44 06.82 | 34 10 31.77 | 20.94 0.01 | 1.50 0.01 | 98.77 |
| 12 44 02.58 | 34 13 11.03 | 21.27 0.01 | 1.96 0.01 | 70.68 |
| 12 44 05.39 | 34 12 02.16 | 21.50 0.01 | 1.55 0.01 | 6.67 |
| 12 44 05.29 | 34 12 35.41 | 21.65 0.01 | 1.61 0.01 | 26.82 |
| 12 44 04.93 | 34 12 23.02 | 22.23 0.01 | 1.56 0.01 | 14.96 |
| 12 44 06.46 | 34 13 16.33 | 22.27 0.01 | 1.34 0.01 | 69.37 |
| 12 44 05.38 | 34 11 53.42 | 22.33 0.01 | 1.59 0.01 | 15.26 |
| 12 44 12.35 | 34 12 30.94 | 22.52 0.01 | 1.82 0.02 | 90.88 |
| 12 44 05.78 | 34 12 09.38 | 22.63 0.01 | 1.62 0.02 | 6.68 |
| 12 44 05.39 | 34 12 53.29 | 22.66 0.01 | 1.74 0.02 | 44.72 |
| 12 44 04.56 | 34 12 04.23 | 22.67 0.01 | 1.52 0.02 | 9.56 |
| 12 44 05.32 | 34 12 10.99 | 22.80 0.07 | 0.64 0.05 | 2.55 |
| 12 44 12.15 | 34 11 17.92 | 23.04 0.01 | 1.70 0.02 | 99.50 |
| 12 44 03.60 | 34 11 01.01 | 23.14 0.01 | 2.11 0.03 | 70.62 |
| 12 44 05.27 | 34 12 12.38 | 23.16 0.05 | 1.33 0.10 | 3.80 |
| 12 44 07.06 | 34 11 41.88 | 23.16 0.02 | 1.65 0.02 | 34.96 |
| 12 44 05.73 | 34 12 24.86 | 23.21 0.01 | 1.47 0.02 | 17.31 |
| 12 44 05.46 | 34 12 23.44 | 23.24 0.01 | 1.41 0.02 | 15.07 |
| 12 44 03.07 | 34 12 25.57 | 23.28 0.02 | 1.48 0.07 | 31.97 |
| 12 44 05.86 | 34 12 22.47 | 23.35 0.02 | 1.55 0.02 | 15.80 |
| 12 44 06.13 | 34 11 54.34 | 23.41 0.02 | 1.58 0.02 | 17.96 |
| 12 44 04.87 | 34 12 15.98 | 23.43 0.02 | 1.59 0.03 | 8.76 |
| 12 44 05.76 | 34 12 16.41 | 23.47 0.02 | 0.71 0.02 | 10.02 |
| 12 44 06.17 | 34 10 32.79 | 23.47 0.01 | 1.37 0.02 | 96.50 |
| 12 44 05.65 | 34 11 52.03 | 23.67 0.02 | 2.07 0.05 | 17.30 |
| 12 44 04.19 | 34 12 20.27 | 23.78 0.02 | 1.73 0.03 | 17.59 |
| 12 44 07.02 | 34 10 36.40 | 23.82 0.02 | 1.88 0.04 | 94.80 |
| Galaxy | SSP Age | Fading in | ||||
| (mag) | (mag) | (Gyr) | (mag) | (mag) | (mag) | |
| (1) | (2) | (3) | (4) | (5) | (6) | (7) |
| Anders & FvA | ||||||
| PGC6510 | 14.17 | 1.49 | 1.4 | 13.68 | 2.27 | -17.86 |
| PGC 42871 | 13.04 | 1.30 | 1.0 | 12.61 | 2.54 | |
| PGC 6240 | 13.64 | 1.30 | 1.0 | 13.21 | 2.54 | |
| Maraston | ||||||
| PGC 6510 | 14.17 | 1.49 | 3.0 | 13.74 | 1.65 | -18.46 |
| PGC 42871 | 13.04 | 1.30 | 0.9 | 12.73 | 2.62 | |
| PGC 6240 | 13.64 | 1.30 | 0.9 | 13.33 | 2.62 |
| Galaxy | Young age | Fading (mag) | |||
|---|---|---|---|---|---|
| (Gyr) | |||||
| (1) | (2) | (3) | (4) | (5) | (6) |
| Anders & FvA | |||||
| PGC 6510 | 1.0 | 0.61 | 0.53 | 0.93 | 0.72 |
| PGC 42871 | 0.3 | 0.58 | 0.41 | 0.92 | 0.55 |
| PGC 6240 | 0.3 | 0.58 | 0.41 | 0.92 | 0.55 |
| Maraston | |||||
| PGC 6510 | 1.0 | 0.46 | 0.40 | 0.61 | 0.50 |
| PGC 42871 | 0.3 | 0.47 | 0.34 | 0.69 | 0.43 |
| PGC 6240 | 0.3 | 0.47 | 0.34 | 0.69 | 0.43 |