Evidence for the pair-breaking process in 116,117Sn
Abstract
The nuclear level densities of 116,117Sn below the neutron separation energy have been determined experimentally from the (3He,) and (3He,3He) reactions, respectively. The level densities show a characteristic exponential increase and a difference in magnitude due to the odd-even effect of the nuclear systems. In addition, the level densities display pronounced step-like structures that are interpreted as signatures of subsequent breaking of nucleon pairs.
pacs:
21.10.Ma, 24.10.Pa, 25.55.-e, 27.60.+jI Introduction
Nuclear level densities are important for many aspects of fundamental and applied nuclear physics, including calculations of nuclear reaction cross sections. The level density of excited nuclei is an average quantity that is defined as the number of levels per unit energy. The majority of data for nuclear level densities are obtained from two energy regions. At low excitation energy, the level density is obtained directly from counting of low-lying levels Fir96 . As the excitation energy increases, the level density becomes large and individual levels are often not resolved in experiments. Therefore, the direct counting method becomes impossible. Nuclear resonances at or above the nucleon binding energy provide another source of level density data Mughabghab . Between these two excitation energy regions, the level density is often interpolated using phenomenological formulas Gil65 ; Egi88 ; Egidy . It is in this energy region the present measurements focus.
Recently, an extension of the sequential extraction method, now referred to as the Oslo method, was developed by the Oslo Cyclotron Group. The Oslo method permits a simultaneous determination of the level density and the radiative strength function Hen95 ; Sch00a . For both of these quantities, the experimental results cover an energy region where there is little information available and data are difficult to obtain. However, the limitation of this method is that the results must be normalized to existing data – from the discrete levels and neutron resonance spacings for the level density and to the total radiative width for the radiative strength function. Thus, the new and main achievement of the Oslo method is to establish the functional form of the level density and the radiative strength function in the above specified energy region.
In this work we present results for the level density in 116,117Sn for the excitation energy MeV. The radiative strength functions of 116,117Sn have been published elsewhere Sn_PRL . The experimental set-up is briefly described in Section II, followed by a discussion of the analysis and normalization procedure. The experimental results for the level density are given in Section III, and the determination of various thermodynamic quantities are presented in Section IV. Conclusions are drawn in Section V.
II Experimental procedure and data analysis
The experiment was carried out at the Oslo Cyclotron Laboratory (OCL) using a 38-MeV 3He beam. The self-supporting 117Sn target had a thickness of 1.9 mg/cm2. The reaction channels 117Sn(3He,)116Sn and 117Sn(3He,3He)117Sn were studied.
The experiment ran for about 11 days with an average beam current of 1.5 nA. Particle- coincidence events were detected using the CACTUS multidetector array. The charged particles were measured with eight Si particle telescopes placed at 45∘ with respect to the beam direction. Each telescope consists of a front Si detector with thickness 140 m and a back Si(Li) detector with thickness 3000 m. An array of 28 collimated NaI -ray detectors with a solid-angle coverage of 15% of 4 was used. In addition, one Ge detector was used in order to estimate the spin distribution and determine the selectivity of the reaction. The typical spin range is .
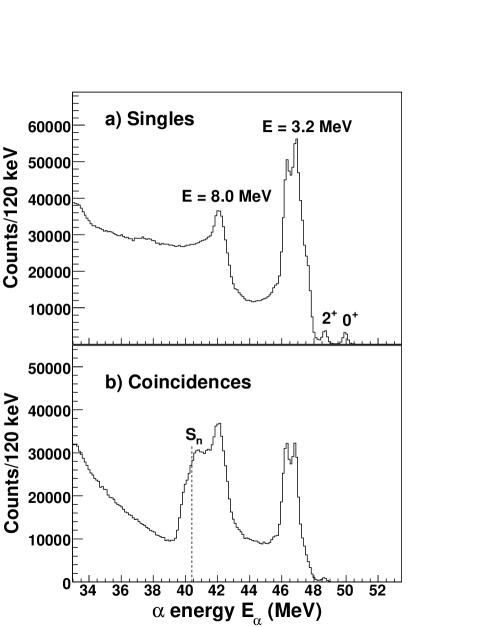
Figure 1 shows the singles -particle spectrum (upper panel) and the - coincidence spectrum (lower panel) for 116Sn. The two peaks denoted by and are the transfer peaks to the ground state and the first excited state, respectively. The strong transfer peak at MeV is composed of many states found to be the result of pick-up of high- neutrons from the g7/2 and h11/2 orbitals Sch67 ; Yag68 . Another strong transfer peak centered around MeV is new and may indicate the neutron pick-up from the g9/2 orbital. The counts in the coincidence spectrum decrease for excitation energies higher than due to lower -ray multiplicity when the neighboring isotope is populated at low excitation energy.
The particle–-ray coincidence spectra were unfolded using the response functions for the CACTUS detector array Gut96 . The first-generation matrix (the primary--ray matrix) contains only the first -rays emitted from a given excitation energy bin; this matrix is obtained by a subtraction procedure described in Ref. Gut87 . This procedure is justified if the decay from any excitation energy bin is independent of the method of formation – either directly by the nuclear reaction or indirectly by decay from higher lying states following the initial reaction. This assumption is clearly valid if the same states are populated via the two processes, since -decay branching ratios are properties of levels. When different states are populated, the assumption may not hold. However, much evidence suggests Hen95 that statistical decay is governed only by the -ray energy and the density of states at the final energy.
In the data analysis, the particle--ray coincidence matrix is prepared and the particle energy is transformed into excitation energy using the reaction kinematics. The rows of the coincidence matrix correspond to the excitation energy in the residual nucleus, while the columns correspond to the -ray energy. All the -ray spectra for various initial excitation energies are unfolded using the known response functions of the CACTUS array Gut96 . The first-generation -ray spectra, which consist of primary -ray transitions, are then obtained for each excitation energy bin Gut87 .
The first-generation -ray spectra for all excitation energies form a matrix , hereafter referred to as the first-generation matrix. The entries of the first-generation matrix are the probabilities that a -ray of energy is emitted from an excitation energy . This matrix is the basis for the simultaneous extraction of the radiative strength function and the level density. According to the Brink-Axel hypothesis Bri55 ; Axe62 , a giant electric dipole resonance can be built on every excited state with the same properties as the one built on the ground state, that is, the radiative strength function is independent of excitation energy and thus of temperature. Many theoretical models do include a temperature dependence of the radiative strength function Kad83 ; Ger98 . However, the temperature dependence is weak and the temperature change in the energy region under consideration here is rather small. Therefore, the temperature dependence is neglected in the Oslo method.
The first-generation matrix is factorized into the radiative transmission coefficient, which is dependent only on , and on the level density, which is a function of the excitation energy of the final states :
| (1) |
The functions and are obtained iteratively by a globalized fitting procedure Sch00a . The goal of the iteration is to determine these two functions at energy values each; the product of the two functions is known at data points contained in the first-generation matrix. The globalized fitting to the data points determines the functional form for and . The results must be normalized because the entries of the matrix are invariant under the transformation Sch00a
| (2) | |||||
| (3) |
In the final step, the transformation parameters , , and which correspond to the most physical solution must be determined. Details of the normalization procedure are described in several papers reporting the results of the Oslo method, see for example Sch00b ; Agv04 . In the following, we will focus on the level density and thermodynamic properties.
III Level densities
The coefficients and relevant for the nuclear level density are determined from normalizing the level density to the low-lying discrete levels and the neutron resonance spacings just above the neutron separation energy . For 117Sn, we used s- and p-wave resonance level spacings (, ) taken from Mughabghab to calculate the total level density at (see Ref. Sch00a for more details on the calculation). Since there is no experimental information about or for 116Sn, we estimated for this nucleus based on systematics for the other tin isotopes Mughabghab ; Egi88 , and assuming an uncertainty of 50%. The level spacings and the final values for are given in Table 1.
| Nucleus | () | ||||||||
|---|---|---|---|---|---|---|---|---|---|
| (MeV) | (MeV) | (MeV-1) | (eV) | (eV) | (MeV) | ( MeV-1) | |||
| 116Sn | 2.25 | 13.13 | 4.96 | 9.563 | 4.12(206) | 0.46 | |||
| 117Sn | 0.99 | 13.23 | 507(60) | 155(6) | 4.44 | 6.944 | 0.86(25) | 0.40 |
The experimental level density is determined from the nuclear ground state up to MeV. Therefore, an interpolation is required between the present experimental data and evaluated at . The back-shifted Fermi gas level density with the global parameterization of von Egidy et al. Egi88 ,
| (4) |
is employed for the interpolation222We chose to apply the old parameterization of Egi88 instead of the more recent one in Egidy because new (,n) data Hiro showed that the slope of the radiative strength function in 117Sn Sn_PRL became too steep using the values of Egidy .. The intrinsic excitation energy is given by , where MeV is the back-shift parameter and is the mass number. The pairing energy is based on pairing gap parameters and evaluated from even-odd mass differences Wapstra according to Dob01 . The level-density parameter and the spin-cutoff parameter are given by and , respectively. The nuclear temperature is described by MeV. The constant is a parameter applied to ensure that the Fermi gas level density coincides with the neutron resonance data. All parameters employed for the Fermi gas level density are listed in Table 1.
Figure 2 shows the normalized level densities of 116Sn and 117Sn. The full squares represent the results from the present work. The data points between the arrows are used for normalizing to the level density obtained from counting discrete levels (solid line) and the level density calculated from the neutron resonance spacing (open square).
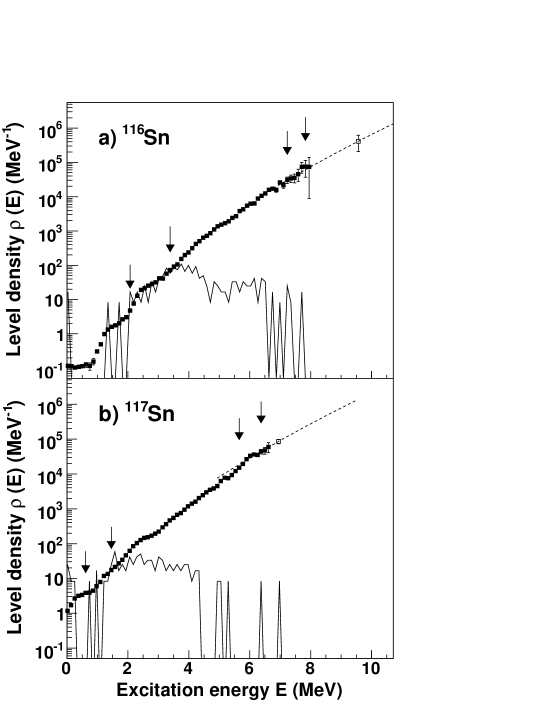
The discrete level scheme is seen to be complete up to excitation energy 3.5 MeV in 116Sn beyond which the level density obtained from discrete levels starts to drop. For 117Sn the discrete level density is complete only up to 1.5 MeV. The new data of this work thus fill the gap between the discrete region and the calculated level density at .
From Fig. 2, we observe that pronounced step-like structures are present in the level densities of both 116,117Sn. In the following section, nuclear thermodynamic properties are extracted using the present level density results, and these structures are investigated in detail.
IV Thermodynamic properties
The entropy is a measure of the number of ways to arrange a quantum system at a given excitation energy . Therefore, the entropy of a nuclear system can give information on the underlying nuclear structure. The microcanonical entropy is given by
| (5) |
where is the multiplicity of accessible states and is Boltzmann’s constant, which we will set to unity to give a dimensionless entropy.
The experimental level density is directly proportional to the multiplicity , which can be expressed as
| (6) |
Here, is the average spin at excitation energy and the factor thus gives the degeneracy of magnetic substates. As the average spin is not well known at all excitation energies, we choose to omit this factor and define the multiplicity as
| (7) |
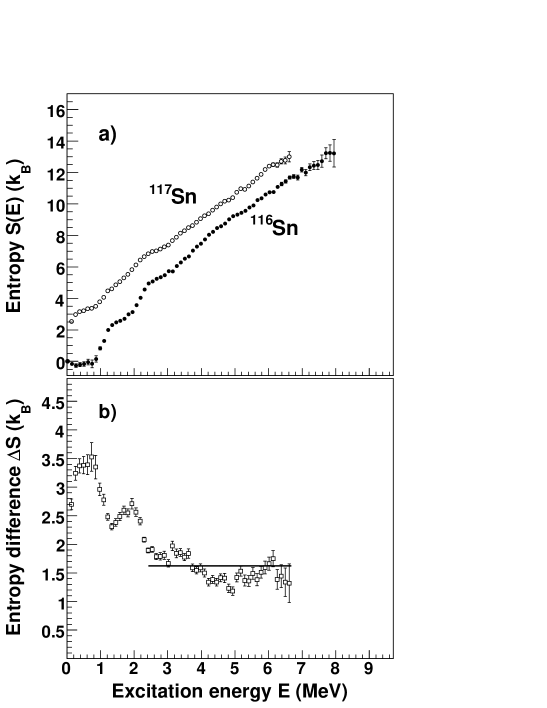
where the denominator is determined from the fact that the ground state of even-even nuclei is a well-ordered system with zero entropy. The value of MeV-1 is obtained such that for the ground state region of 116Sn. The same is also applied for 117Sn. In Fig. 3 the resulting entropies of 116,117Sn are shown.
The entropy carried by the valence neutron can be estimated by assuming that the entropy is an extensive (additive) quantity gutt4 . With this assumption, the experimental single neutron entropy is given by
| (8) |
From Fig. 3, we observe that becomes more constant as the excitation energy increases, and above MeV we estimate the single neutron quasiparticle to carry about in units of Boltzmann’s constant. This agrees with previous findings from the rare-earth region gutt4 .
Both entropy curves display step-like structures superimposed on the general smooth increasing entropy as a function of excitation energy. At these structures, the entropy increases abruptly in a small energy interval before it becomes a more slowly increasing function.
The first low-energy bump of 116Sn is connected to the first excited 2+ state at MeV and the second excited 0+ state at MeV. Similarly, the first bump in the entropy of 117Sn is connected to the first excited states in this nucleus. The next structures are probable candidates for the pair-breaking process. Microscopic calculations based on the seniority model indicate that step structures in the level density can be explained by the consecutive breaking of nucleon Cooper pairs Fe+Mo_lev .
The bumps present in the Sn level densities are much more outstanding than previously measured for other mass regions by the Oslo group. One explanation of the clear fingerprints could be that since the shell is closed, the breaking of proton pairs are strongly hindered and thus do not smooth out the entropy signatures for the neutron pair breaking. Therefore, it is very likely that the structures are due to pure neutron-pair break up.
We have investigated the structures further by introducing the microcanonical temperature given by
| (9) |
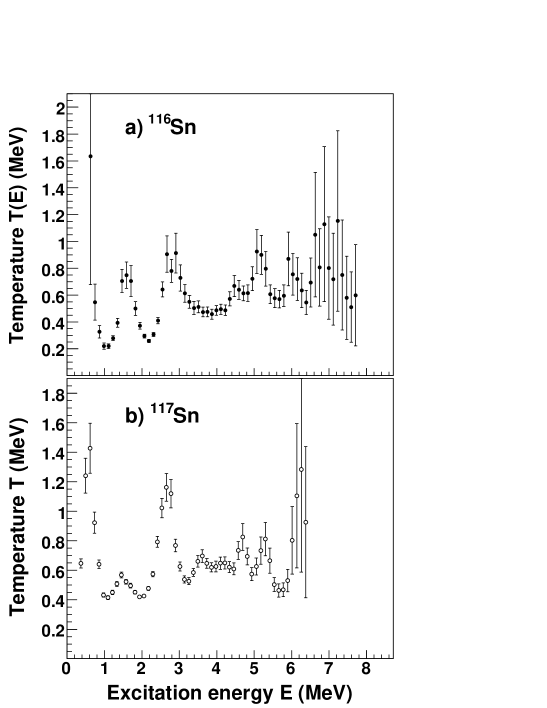
By taking the derivative, small changes in the slope of the entropy are enhanced. This is easily seen in Fig. 4, where the microcanonical temperatures of 116,117Sn are displayed. The striking oscillations of the temperature is a thermodynamic signature for such small systems as the nucleus. Only a few quasiparticles participate in the excitation of the nucleus. Since the system is not in contact with a heat bath with a constant temperature, the system is far from the thermodynamic limit.
In Fig. 4, the bumps below MeV are connected to the low-lying excited states in 116,117Sn. However, the peak-like structure centered around MeV in 116Sn and around MeV in 117Sn could be a signature of the first break-up of a neutron pair. Above and MeV in 116,117Sn, respectively, the temperature appears to be constant on the average, indicating a more continuous breaking of further pairs.
Recently gutt5 , the criticality of low-temperature transitions was investigated for rare-earth nuclei. We apply the same method here and investigate the probability of the system at fixed temperature to have excitation energy , i.e.,
| (10) |
where the canonical partition function is given by
| (11) |
Lee and Kosterlitz showed LK90 ; LK91 that the function , for a fixed temperature in the vicinity of a critical temperature of a structural transition, will exhibit a characteristic double-minimum structure at energies and . For the critical temperature , one finds . It can be easily shown that is closely connected to the Helmholtz free energy, and that this condition is equivalent to
| (12) |
which can be evaluated directly from our experimental data. It should be emphasized that is a linearized approximation to the Helmholtz free energy at the critical temperature according to
| (13) |
Linearized free energies for certain temperatures are displayed in Fig. 5. In the upper panels, 116,117Sn data are shown where the condition is fulfilled. Each nucleus shows a double-minimum structure, which we interpret as the critical temperatures for breaking one neutron pair. The values found are and MeV for 116,117Sn, respectively. Furthermore, we observe a potential barrier of about MeV between the two minima and . The potential barrier indicates the free energy needed to go from one phase (no pairs broken) to another (one broken pair) at the constant, critical temperature .
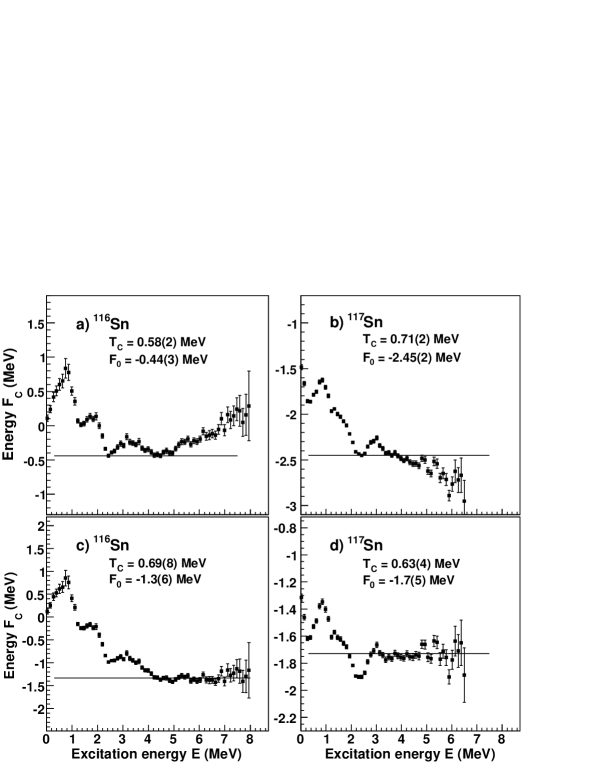
In the process of breaking additional pairs, the structures are expected to be less pronounced. Indeed, in the lowest panels of Fig. 5, the free energy is rather constant for excitation energies above and MeV for 116,117Sn, respectively. Instead of a double-minimum structure, a continuous minimum of appears for several MeV of excitation energies. This demonstrates clearly that the depairing process in tin cannot be interpreted as an abrupt structural change typical of a first order phase transition. For this process we evaluate the critical temperature by a least fit of to the experimental data. The excitation energies ( and ) and temperatures for the phase transitions are summarized in Table 2.
| 116Sn | 117Sn | |||
| Breaking of | ||||
| (MeV) | (MeV) | (MeV) | (MeV) | |
| one pair | 0.58(2) | 0.71(2) | ||
| two or more pairs | 0.69(8) | 0.63(4) | ||
According to the linearized free-energy calculations, the first neutron pair is broken for excitation energies between MeV in 116Sn. Comparing with the upper panel of Fig. 4, we see that this coincides with the excitation-energy region where a peak structure is found. This bump is thought to represent the first neutron pair break-up as discussed previously in the text. The average temperature of the bump is MeV, in excellent agreement with the deduced critical temperature . Similarly, for 117Sn in the lower panel of Fig. 4, we find that a peak-like structure with an average temperature of MeV is present between MeV. Compared to the critical temperature MeV, the values agree satisfactory.
For the continuous break-up process characterized by a zero potential barrier ( MeV), we estimate for 116Sn an average microcanonical temperature of MeV in the excitation-energy region MeV, in reasonable agreement with calculated from the linearized Helmholtz free energy. In the case of 117Sn, the average microcanonical temperature for excitation energies between MeV is found to be MeV, which agrees very well with MeV. This gives further confidence in our interpretation of the data as two independent methods give very similar results.
V Conclusions
The nuclear level densities for 116,117Sn are extracted from particle- coincidence measurements. New experimental results are reported for the level density in 116,117Sn for excitation energies above 1.5 MeV and 3.5 MeV up to MeV. The level densities for both nuclei display prominent step-like structures. The structures have been further investigated by means of thermodynamic considerations: microcanonical entropy and temperature, and through calculations of the linearized Helmholtz free energy. Both methods give consistent results, in strong favor of the pair-breaking process as an explanation of the structures.
Acknowledgements.
This research was sponsored by the National Nuclear Security Administration under the Stewardship Science Academic Alliances program through DOE Research Grant No. DE-FG52-06NA26194. U. A. and G. E. M. also acknowledge support from U.S. Department of Energy Grant No. DE-FG02-97-ER41042. Financial support from the Norwegian Research Council (NFR) is gratefully acknowledged.References
- (1) R. Firestone and V. S. Shirley, Vol. II, Table of Isotopes, 8th edition (Wiley, New York, 1996).
- (2) S. F. Mughabghab, Atlas of Neutron Resonances, Fifth Edition, Elsevier Science (2006).
- (3) A. Gilbert and A. G. W. Cameron, Can. J. Phys. 43, 1446 (1965).
- (4) T. von Egidy, H. H. Schmidt, and A. N. Behkami, Nucl. Phys. A481, 189 (1988).
- (5) T. von Egidy and D. Bucurescu, Phys. Rev.C 72, 044311 (2005); 73, 049901(E) (2006).
- (6) A. Schiller, L. Bergholt, M. Guttormsen, E. Melby, J. Rekstad, and S. Siem, Nucl. Instrum. Methods Phys. Res. A 447, 498 (2000).
- (7) L. Henden, L. Bergholt, M. Guttormsen, J. Rekstad, and T. S. Tveter, Nucl. Phys. A589, 249 (1995).
-
(8)
U. Agvaanluvsan, A. C. Larsen, R. Chankova, M. Guttormsen, G. E. Mitchell, A. Schiller, S. Siem, and A. Voinov, Los Alamos preprint server:
http://xxx.lanl.gov/abs/0808.3648, submitted to Phys. Rev. Lett. - (9) E. J. Schneid, A. Prakash, and B. L. Cohen, Phys. Rev. 156, 1316 (1967).
- (10) K. Yagi, Y. Sagi, T. Ishimatsu, Y. Ishizaki, M. Matoba, Y. Nakajima, and C. Y. Huang, Nucl. Phys. A111, 129 (1968).
- (11) M. Guttormsen, T. S. Tveter, L. Bergholt, F. Ingebretsen, and J. Rekstad, Nucl. Instrum. Methods Phys. Res. A 374, 371 (1996).
- (12) M. Guttormsen, T. Ramsøy, and J. Rekstad, Nucl. Instrum. Methods Phys. Res. A 255, 518 (1987).
- (13) D. M. Brink, Ph.D. thesis, Oxford University, 1955.
- (14) P. Axel, Phys. Rev. 126, 671 (1962)
- (15) S. G. Kadmenskiĭ, V. P. Markushev, and V. I. Furman, Yad. Fiz. 37, 277 (1983), [Sov. J. Nucl. Phys. 37, 165 (1983)].
- (16) G. Gervais, M. Thoennessen, and W. E. Ormand, Phys. Rev. C 58, R1377 (1998).
- (17) A. Schiller, M. Guttormsen, E. Melby, J. Rekstad, and S. Siem, Phys. Rev. C 61, 044324 (2000).
- (18) U. Agvaanluvsan, A. Schiller, J. A. Becker, L. A. Bernstein, P. E. Garrett, M. Guttormsen, G. E. Mitchell, J. Rekstad, S. Siem, A. Voinov, and W. Younes, Phys. Rev. C 70, 054611 (2004).
- (19) G. Audi and A. H. Wapstra, Nucl. Phys. A595, 409 (1995).
- (20) J. Dobaczewski, P. Magierski, W. Nazarewicz, W. Satuła, and Z. Szymański, Phys. Rev. C 63, 024308 (2001).
- (21) H. Utsunomiya, private communication.
- (22) M. Guttormsen, M. Hjorth-Jensen, E. Melby, J. Rekstad, A. Schiller, and S. Siem, Phys. Rev. C 63, 044301 (2001).
- (23) A. Schiller, E. Algin, L. A. Bernstein, P. E. Garrett, M. Guttormsen, M. Hjort-Jensen, C. W. Johnson, G. E. Mitchell, J. Rekstad, S. Siem, A. Voinov, and W. Younes, Phys. Rev. C 68, 054326 (2003).
- (24) M. Guttormsen, M. Hjorth-Jensen, J. Rekstad, S. Siem, A. Schiller, and D. Dean, Phys. Rev. C 68, 034311 (2003).
- (25) Jooyoung Lee and J. M. Kosterlitz, Phys. Rev. Lett. 65, 137 (1990).
- (26) Jooyoung Lee and J. M. Kosterlitz, Phys. Rev. B 43, 3265 (1991).