Welcome back, Polaris the Cepheid††thanks: Presented as a poster by A. J. Penny at the Cool Stars 15 meeting at St Andrews.
Abstract
For about 100 years the amplitude of the 4 d pulsation in Polaris has decreased. We present new results showing a significant increase in the amplitude based on years of continuous monitoring from the ground and with two satellite missions.
Keywords:
Stars: individual: Polaris ( UMi), Stars: variable: Cepheids, Stellar evolution:
95.75.Wx, 97.10.Cv, 97.10.Sj, 97.20.Pm, 97.30.Gj1 Introduction
Polaris is the brightest Cepheid in the sky with a single known pulsation mode with a period close to 4 days. The star was found to be variable around 150 years ago Schmidt (1857) and the period was first identified about 100 years ago (Hertzsprung, 1911). For the past century the pulsation amplitude has decreased from to 20 mmag in (peak-to-peak) and the period has increased by 4.5 s yr-1 (Turner et al., 2005; Arellano Ferro, 1983).
If the decrease in amplitude had continued, a possible explanation offered for the decrease in amplitude is that Polaris has completed its evolution through the instability strip and is therefore becoming stable Dinshaw et al. (1989); Kamper and Fernie (1998). The high rate of period change is typical of overtone pulsators Evans et al. (2002) like Polaris, though other explanations have been suggested Turner et al. (2006); Spreckley and Stevens (2008).
About fifteen years ago a paper with the title Goodbye Polaris the Cepheid Fernie et al. (1993) predicted that the 4 d mode would disappear around 1994. However, a fundamental error was found in that paper (Kamper and Fernie, 1998), and new measurements at the end of millennium indicated that the decrease in amplitude had ceased (Kamper and Fernie, 1998; Hatzes and Cochran, 2000). Coincidentally, in 2008 three independent groups have reported unambiguous evidence for a significant increase in the amplitude (Spreckley and Stevens, 2008; Bruntt et al., 2008; Lee et al., 2008), and we can now say, Welcome back, Polaris!
Details of our work are given in Bruntt et al. (2008); here we shall summarize our most important conclusions and make comparisons with the results from the two other groups. In addition we shall discuss a possible explanation for the surprising increase in the amplitude of Polaris, based on new results for Cepheids in the Large Magellanic Cloud Moskalik and Kolaczkowski (2008).
2 Observations from ground and space
We have collected extensive data for Polaris from both ground and space. We used the 2-m Tennessee State University Automatic Spectroscopic Telescope (AST Eaton and Williamson (2007)) to collect over 500 spectra over a period of 3.8 years from 2003–7. We used the 52 mm star tracker on the WIRE satellite (Bruntt, 2007) to collect 62 days of high-precision photometry during three runs, each lasting from 2 to 4 weeks, in 2004–5. Finally, we obtained photometry from the SMEI instrument on the Coriolis satellite spanning 3.7 years from 2003–6.
3 A significant increase in the amplitude
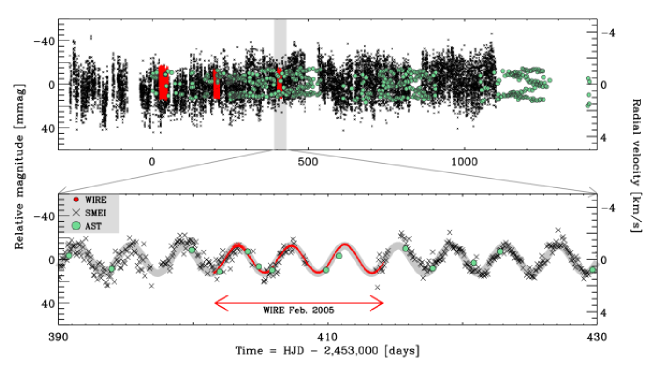
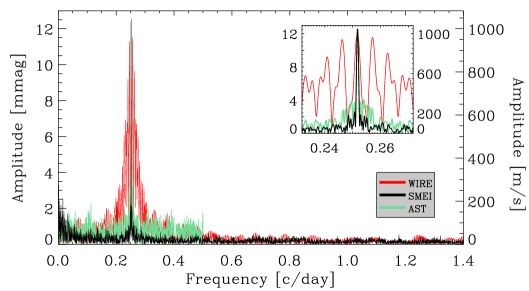
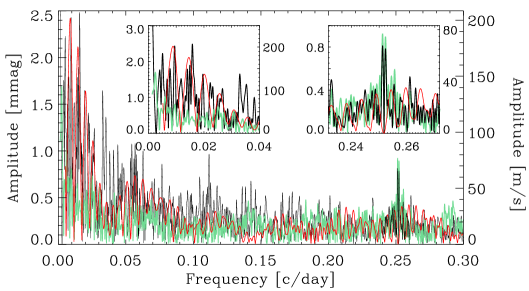
In Fig. 1 we show the light curves from SMEI and WIRE and the radial velocity curve from AST. The baseline of the combined data set is 4.5 years. To analyse the data we compute the Fourier amplitude spectrum of each data set as shown in Fig. 2. The left panel shows the dominant peak due to the 4 d pulsation mode. The right panel shows the details at lower frequencies after having subtracted the primary mode. The insets show details around the main features in the amplitude spectra. Notice that in the right panel there is a significant residual signal around the main peak at c/day. This is due to an increase in amplitude during the time span of the observations Bruntt et al. (2008).
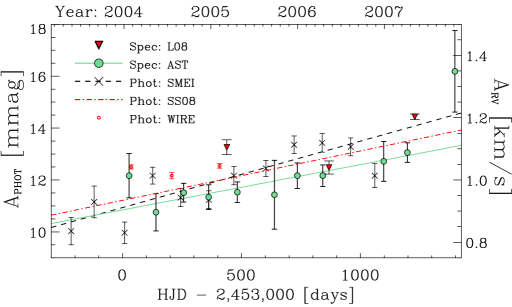
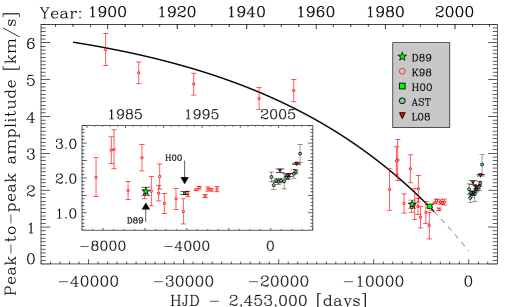
To quantify the increase in amplitude, we split the data sets in groups of 30 pulsation cycles (4 months) and measured the amplitude in each. The result is given in the left panel in Fig. 3 showing a % increase in both photometric and radial-velocity amplitude. In the right panel we show the change in radial-velocity amplitude over a century and note that the precision of the data collected since the 1990s have improved greatly with the advent of very stable spectrographs. We can see that the amplitude of the 4 d mode in Polaris stopped its decrease around 1995 and has increased since then.
Our measurement of the increase in amplitude is in very good agreement with the results from Spreckley and Stevens (2008) and Lee et al. (2008) which are also shown in Fig. 3 (marked as SS08 and L08, respectively). SS08 used an independent reduction pipeline to reduce the SMEI data and obtained a significantly better point-to-point precision. L08 used 264 spectra collected over 2.6 years and partly overlapping with our dataset.
4 Long-period variation in Polaris
In addition to the dominant 4 d mode, long-period variation has been reported in some of the extensive campaigns done on Polaris since the 1980s. These include variation at d ( km/s) Kamper et al. (1984), d ( m/s) Dinshaw et al. (1989), d and d ( m/s) Hatzes and Cochran (2000), and most recently at 119.1 d ( m/s) Lee et al. (2008), with semi-amplitudes given in the parentheses. Based on simulations Bruntt et al. (2008) we argue that these modes are probably not intrinsic to Polaris, but due to a combination of instrumental drift, too sparse sampling of the pulsation, and difficulties imposed by the period being so close to an integer number of days. Our spectroscopic data from AST has the lowest noise at low frequencies among the published data sets. In the range 3–50 d days we set an upper limit for the variation at 100 m s-1, which is four times the average noise level in the amplitude spectrum.
5 Why has the amplitude increased?
The increase in the amplitude of Polaris makes it unlikely that it is evolving out of the instability strip and ceasing to pulsate. Rather, the amplitude change seems to be a cyclic phenomenon, related to pulsation. Based on comparison with pulsation models Spreckley and Stevens (2008) suggested that Polaris is on the red edge of the instability strip for overtone pulsators, and that it could be evolving (depending on its mass) from a first-overtone pulsator to become a fundamental or double-mode Cepheid (also suggested by Kamper and Fernie (1998)).
Another potential explanation is beating of the primary mode with an additional unresolved pulsation mode, as suggested by Bruntt et al. (2008) and Spreckley and Stevens (2008). If this be the case, the two modes would have nearly the same frequency, since the beat-period is at least 200 years. Recently, non-radial pulsation was detected in 42 out of 462 first-overtone Cepheids in the Large Magellanic Cloud Moskalik and Kolaczkowski (2008). Interestingly, the non-radial frequencies are most often located close to the primary radial overtone mode. These secondary peaks were not found in any of the 718 fundamental mode Cepheids Moskalik and Kolaczkowski (2008). Since Polaris is a first overtone pulsator Feast and Catchpole (1997), beating of the first overtone with a non-radial mode could explain the observed increase in amplitude. However, this requires that the amplitudes of the two modes be comparable due to the low amplitude of the variation around the millennium. This is not the case for any of the LMC overtone Cepheids; the non-radial modes typically have amplitudes around 5% of the main mode, with one Cepheid having a secondary peak with 20% of the amplitude of the main mode.
6 Outlook
Fernie, Kamper & Seager were apparently too pessimistic when they said goodbye to Polaris 10 years ago Fernie et al. (1993). Polaris has now evidently come back and is presenting us with a new puzzle: why is the amplitude increasing? In the coming years we will continue to monitor Polaris with AST, and we will collect additional spectra at different longitudes to improve the spectral window of the observations.
References
- Schmidt (1857) J. F. J. Schmidt, Astronomische Nachrichten 46, 293 (1857).
- Hertzsprung (1911) E. Hertzsprung, Astronomische Nachrichten 189, 89 (1911).
- Turner et al. (2005) D. G. Turner et al., PASP 117, 207–220 (2005).
- Arellano Ferro (1983) A. Arellano Ferro, ApJ 274, 755–762 (1983).
- Dinshaw et al. (1989) N. Dinshaw, J. M. Matthews, G. A. H. Walker, and G. M. Hill, AJ 98, 2249–2263 (1989).
- Kamper and Fernie (1998) K. W. Kamper, and J. D. Fernie, AJ 116, 936–940 (1998).
- Evans et al. (2002) N. R. Evans, D. D. Sasselov, and C. I. Short, ApJ 567, 1121–1130 (2002).
- Turner et al. (2006) D. G. Turner, M. Abdel-Sabour Abdel-Latif, and L. N. Berdnikov, PASP 118, 410–418 (2006).
- Spreckley and Stevens (2008) S. A. Spreckley, and I. R. Stevens, MNRAS 388, 1239–1244 (2008).
- Fernie et al. (1993) J. D. Fernie, K. W. Kamper, and S. Seager, ApJ 416, 820 (1993).
- Hatzes and Cochran (2000) A. P. Hatzes, and W. D. Cochran, AJ 120, 979–989 (2000).
- Bruntt et al. (2008) H. Bruntt et al., ApJ 683, 433–440 (2008).
- Lee et al. (2008) B.-C. Lee, D. E. Mkrtichian, I. Han, M.-G. Park, and K.-M. Kim, AJ 135, 2240–2244 (2008).
- Moskalik and Kolaczkowski (2008) P. Moskalik, and Z. Kolaczkowski, ArXiv e-prints 809 (2008), 0809.0864.
- Eaton and Williamson (2007) J. A. Eaton, and M. H. Williamson, PASP 119, 886–897 (2007).
- Bruntt (2007) H. Bruntt, Communications in Asteroseismology 150, 326 (2007).
- Kamper et al. (1984) K. W. Kamper, N. R. Evans, and R. W. Lyons, JRASC 78, 173–177 (1984).
- Feast and Catchpole (1997) M. W. Feast, and R. M. Catchpole, MNRAS 286, L1–L5 (1997).