Search for a light pseudoscalar particle in the decay
Y. C. Tung
Department of Physics, National Taiwan University, Taipei, Taiwan 10617 Republic of China
Y. B. Hsiung
Department of Physics, National Taiwan University, Taipei, Taiwan 10617 Republic of China
M. L. Wu
Department of Physics, National Taiwan University, Taipei, Taiwan 10617 Republic of China
K. F. Chen
Department of Physics, National Taiwan University, Taipei, Taiwan 10617 Republic of China
J. K. Ahn
Department of Physics, Pusan National University, Busan, 609-735 Republic of Korea
Y. Akune
Department of Physics, Saga University, Saga, 840-8502 Japan
V. Baranov
Laboratory of Nuclear Problems, Joint Institute for Nuclear Research,
Dubna, Moscow Region, 141980 Russia
J. Comfort
Department of Physics and Astronomy, Arizona State University, Tempe, Arizona, USA
M. Doroshenko
Present address: Laboratory of Nuclear Problems, Joint Institute for Nuclear Research,
Dubna, Moscow Region, 141980 Russia
Department of Particle and Nuclear Research,
The Graduate University for Advanced Science (SOKENDAI), Tsukuba, Ibaraki, 305-0801 Japan
Y. Fujioka
Department of Physics, Saga University, Saga, 840-8502 Japan
T. Inagaki
Department of Particle and Nuclear Research,
The Graduate University for Advanced Science (SOKENDAI), Tsukuba, Ibaraki, 305-0801 Japan
Institute of Particle and Nuclear Studies,
High Energy Accelerator Research Organization (KEK), Tsukuba, Ibaraki, 305-0801 Japan
S. Ishibashi
Department of Physics, Saga University, Saga, 840-8502 Japan
N. Ishihara
Institute of Particle and Nuclear Studies,
High Energy Accelerator Research Organization (KEK), Tsukuba, Ibaraki, 305-0801 Japan
H. Ishii
Department of Physics, Osaka University, Toyonaka, Osaka, 560-0043 Japan
E. Iwai
Department of Physics, Osaka University, Toyonaka, Osaka, 560-0043 Japan
T. Iwata
Department of Physics, Yamagata University, Yamagata, 990-8560 Japan
I. Kato
Department of Physics, Yamagata University, Yamagata, 990-8560 Japan
S. Kobayashi
Department of Physics, Saga University, Saga, 840-8502 Japan
T. K. Komatsubara
Institute of Particle and Nuclear Studies,
High Energy Accelerator Research Organization (KEK), Tsukuba, Ibaraki, 305-0801 Japan
A. S. Kurilin
Laboratory of Nuclear Problems, Joint Institute for Nuclear Research,
Dubna, Moscow Region, 141980 Russia
E. Kuzmin
Laboratory of Nuclear Problems, Joint Institute for Nuclear Research,
Dubna, Moscow Region, 141980 Russia
A. Lednev
Institute for High Energy Physics, Protvino, Moscow region, 142281 Russia
Enrico Fermi Institute, University of Chicago, Chicago, Illinois 60637, USA
H. S. Lee
Department of Physics, Pusan National University, Busan, 609-735 Republic of Korea
S. Y. Lee
Department of Physics, Pusan National University, Busan, 609-735 Republic of Korea
G. Y. Lim
Institute of Particle and Nuclear Studies,
High Energy Accelerator Research Organization (KEK), Tsukuba, Ibaraki, 305-0801 Japan
J. Ma
Enrico Fermi Institute, University of Chicago, Chicago, Illinois 60637, USA
T. Matsumura
Department of Applied Physics, National Defense Academy, Yokosuka, Kanagawa, 239-8686 Japan
A. Moisseenko
Laboratory of Nuclear Problems, Joint Institute for Nuclear Research,
Dubna, Moscow Region, 141980 Russia
H. Morii
Department of Physics, Kyoto University, Kyoto, 606-8502 Japan
T. Morimoto
Institute of Particle and Nuclear Studies,
High Energy Accelerator Research Organization (KEK), Tsukuba, Ibaraki, 305-0801 Japan
T. Nakano
Research Center of Nuclear Physics, Osaka University, Ibaraki, Osaka, 567-0047 Japan
H. Nanjo
Department of Physics, Kyoto University, Kyoto, 606-8502 Japan
J. Nix
Enrico Fermi Institute, University of Chicago, Chicago, Illinois 60637, USA
T. Nomura
Present address: Institute of Particle and Nuclear Studies,
High Energy Accelerator Research Organization (KEK), Tsukuba, Ibaraki, 305-0801 Japan
Department of Physics, Kyoto University, Kyoto, 606-8502 Japan
M. Nomachi
Department of Physics, Osaka University, Toyonaka, Osaka, 560-0043 Japan
R. Ogata
Department of Physics, Saga University, Saga, 840-8502 Japan
H. Okuno
Institute of Particle and Nuclear Studies,
High Energy Accelerator Research Organization (KEK), Tsukuba, Ibaraki, 305-0801 Japan
K. Omata
Institute of Particle and Nuclear Studies,
High Energy Accelerator Research Organization (KEK), Tsukuba, Ibaraki, 305-0801 Japan
G. N. Perdue
Present address: University of Rochester, Rochester, NY 14627
Enrico Fermi Institute, University of Chicago, Chicago, Illinois 60637, USA
S. Podolsky
Present address: Scarina Gomel’ State University, Gomel’, BY-246699, Belarus
Laboratory of Nuclear Problems, Joint Institute for Nuclear Research,
Dubna, Moscow Region, 141980 Russia
K. Sakashita
Present address: Institute of Particle and Nuclear Studies,
High Energy Accelerator Research Organization (KEK), Tsukuba, Ibaraki, 305-0801 Japan
Department of Physics, Osaka University, Toyonaka, Osaka, 560-0043 Japan
T. Sasaki
Department of Physics, Yamagata University, Yamagata, 990-8560 Japan
N. Sasao
Department of Physics, Kyoto University, Kyoto, 606-8502 Japan
H. Sato
Department of Physics, Yamagata University, Yamagata, 990-8560 Japan
T. Sato
Institute of Particle and Nuclear Studies,
High Energy Accelerator Research Organization (KEK), Tsukuba, Ibaraki, 305-0801 Japan
M. Sekimoto
Institute of Particle and Nuclear Studies,
High Energy Accelerator Research Organization (KEK), Tsukuba, Ibaraki, 305-0801 Japan
T. Shinkawa
Department of Applied Physics, National Defense Academy, Yokosuka, Kanagawa, 239-8686 Japan
Y. Sugaya
Department of Physics, Osaka University, Toyonaka, Osaka, 560-0043 Japan
A. Sugiyama
Department of Physics, Saga University, Saga, 840-8502 Japan
T. Sumida
Present address: CERN, CH-1211 Genève 23, Switzerland
Department of Physics, Kyoto University, Kyoto, 606-8502 Japan
S. Suzuki
Department of Physics, Saga University, Saga, 840-8502 Japan
Y. Tajima
Department of Physics, Yamagata University, Yamagata, 990-8560 Japan
S. Takita
Department of Physics, Yamagata University, Yamagata, 990-8560 Japan
Z. Tsamalaidze
Laboratory of Nuclear Problems, Joint Institute for Nuclear Research,
Dubna, Moscow Region, 141980 Russia
T. Tsukamoto
Deceased.
Department of Physics, Saga University, Saga, 840-8502 Japan
Y. Wah
Enrico Fermi Institute, University of Chicago, Chicago, Illinois 60637, USA
H. Watanabe
Present address: Institute of Particle and Nuclear Studies,
High Energy Accelerator Research Organization (KEK), Tsukuba, Ibaraki, 305-0801 Japan
Enrico Fermi Institute, University of Chicago, Chicago, Illinois 60637, USA
M. Yamaga
Present address: RIKEN SPring-8 Center, Sayo, Hyogo, 679-5148 Japan
Institute of Particle and Nuclear Studies,
High Energy Accelerator Research Organization (KEK), Tsukuba, Ibaraki, 305-0801 Japan
T. Yamanaka
Department of Physics, Osaka University, Toyonaka, Osaka, 560-0043 Japan
H. Y. Yoshida
Department of Physics, Yamagata University, Yamagata, 990-8560 Japan
Y. Yoshimura
Institute of Particle and Nuclear Studies,
High Energy Accelerator Research Organization (KEK), Tsukuba, Ibaraki, 305-0801 Japan
Y. Zheng
Enrico Fermi Institute, University of Chicago, Chicago, Illinois 60637, USA
(24 October 2008)
Abstract
We performed a search for a light pseudoscalar particle
in the decay , with the E391a detector at KEK.
Such a particle with a mass of 214.3 MeV/ was suggested by the HyperCP experiment.
We found no evidence for and
set an upper limit on the product branching ratio for , of
at the confidence level.
Upper limits on the branching ratios in the mass
region of from to MeV/ are also presented.
pacs:
13.25.Es, 12.60.Jv, 14.80.Cp
We report the results of a search for the decay , ,
where is a pseudoscalar particle of mass in the region MeV/.
No experimental study for has been published in this mass range.
This study was motivated by the three events of the decay with the dimuon
invariant mass around 214.3 MeV/ reported by the HyperCP collaboration in 2005 hypercp .
A sgoldstino interpretation ds1 ; ds2 for the HyperCP observation
showed an upper estimate of the branching ratio,
but this calculation strongly depends on a complex coupling constant
and only the absolute value can be extracted from HyperCP data.
The model also showed that the particle’s branching ratio (BR)
should be saturated by the channels
and ,
with BR/BR .
Another model he suggested a light pseudoscalar Higgs boson interpretation of ,
but there was no prediction for decay BR.
We searched for the , decay at the KEK E391a experiment e391run2 .
Neutral kaons were produced by 12 GeV protons
incident on a 0.8-cm-diameter and 6-cm-long platinum target.
The proton intensity was typically
per spill coming every 4 sec.
The neutral beam beamline ,
with a solid angle of 12.6 str,
was defined by a series of six sets of collimators and a pair of sweeping magnets
aligned at a production angle of 4 degrees.
A 7-cm-thick lead block and a 30-cm-thick beryllium block were placed
between the first and second collimators
to reduce beam photons and neutrons.
The beam size at m downstream of the target,
measured with the E391a detector,
was cm (FWHM) including the effects of detector resolution.
The beam line was kept in vacuum
at 1 Pa after 5 m downstream of the target
and Pa inside the fiducial decay region.
The momentum peaked around 2 GeV/ at the entrance of the detector,
11.8 m downstream of the target.
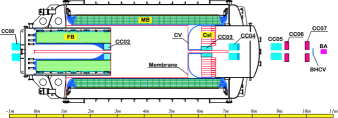
Figure 1 shows a cross-sectional view of the E391a detector
and defines the origin of our coordinate system.
Figure 1: (color online)
Schematic cross-sectional view of the E391a detector.
“0m” in the scale corresponds to
the entrance of the front barrel (FB) detector.
’s entered from the left side.
The detector components were cylindrically assembled
along the beam axis. Most were installed inside the vacuum tank
to minimize interactions of the particles before detection.
The electromagnetic calorimeter, labeled “CsI”,
measured the energy and position of the photons from and decays.
It consisted
of 496 blocks of
undoped CsI crystal and 80 specially shaped CsI blocks
used in the peripheral region,
covering a circular area with a 95 cm radius.
To allow beam particles to pass through,
the calorimeter had a cm2
beam hole at the center.
The main barrel (MB) and
front barrel (FB) counters consisted of
alternating layers of lead and scintillator sheets with
total thicknesses of 13.5 and 17.5 , respectively,
and surrounded the neutral beam.
Both upstream and downstream ends of MB and the upsteam end of FB
had Hamamatsu R329-EGP photomultiplier tubes pmt for scintillation light detection.
To identify charged particles entering the calorimeter,
a scintillation counter (CV) hermetically covered the front of the calorimeter.
It consisted of a plastic scintillator hodoscope placed 50 cm upstream of the calorimeter
with a cm2 beam hole at the center,
and four 6 mm thick scintillator plates
that connected the beam holes in the hodoscope and the calorimeter.
Multiple collar-shaped photon counters
(CC00, CC02–07) were placed
along the beam axis
to detect particles escaping
in the beam direction.
The CC02 was a shashlik type lead-scintillator sandwich counter
with optical fibers running perpendicularly
to the lead and scintillator plates
through aligned holes,
and was located at the upstream end of the decay region.
The CC03 filled the volume between the beam hole
and the innermost layers of the CsI blocks in the calorimeter.
The vacuum region was separated by a thin multi-layer film (“membrane”)
between the beam and detector regions.
This kept the decay region at Pa despite some outgassing from the detector.
Further descriptions of the E391a detector are given in e391run2 ; detector .
In this analysis,
we used data taken in the run period from February to April 2005, or Run-II.
Data were taken with a hardware trigger requiring two or
more shower clusters in the calorimeter with cluster energy MeV.
We also required no activity in the CV and in some other photon counters.
Because both the decays , and have a signature of six photons in the final state,
separation of these decays was crucial in this study.
In the analysis,
the and decays were simulated using GEANT3 Monte Carlo (MC)
simulations geant
and were overlaid with accidental events
taken from the target-monitor accidental trigger.
In the decay, was assumed to decay immediately to two photons.
To reconstruct ,
we selected events with six photon-like clusters on the CsI calorimeter
without any in-time hits on the other detectors.
All the clusters were required to be within the fiducial region,
which was outside the 25 cm by 25 cm square around the beamhole
and inside a 88 cm circle from the center of the beamline.
An additional selection criterion on the transverse momentum of ( 0.025 GeV/)
was required to suppress missing photon events.
Afterwards, event reconstruction proceeded by solving for the decay vertex,
assuming the mass and
constraining the vertex to lie along the beam axis.
The fiducial decay Z-vertex () region was defined to be between 250 and 550 cm.
There were 45 possible combinations to select two photon pairs from 6 photons to form two ’s.
The most likely pairing was chosen by a minimum ,
which was calculated based on the difference between reconstructed ’s of the ’s.
In the event,
the mass was the invariant mass of the third photon pair
and was reconstructed from the energy and hit positions of the remaining two photons
and the determined from two ’s.
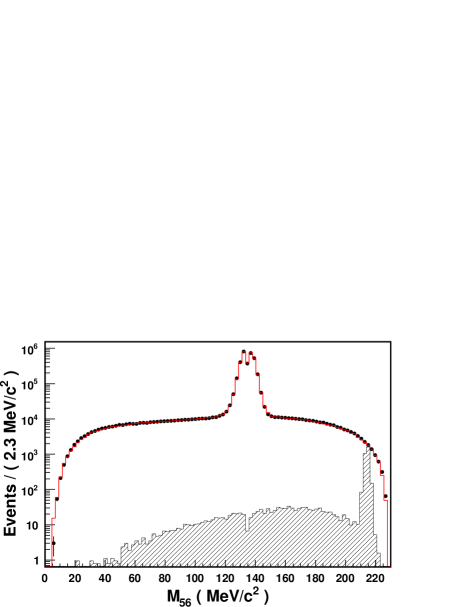
Figure 2:
(color online)
The distribution of the events with six photons in the calorimeter.
The points with error bars show the data,
and the red (open) histogram shows the MC results normalized to
the number of data events.
The shaded histogram represents the MC results ( MeV/) and was normalized assuming
that is .
The event reconstruction was further optimized by a constrained fit fit
requiring:
(a) six photons to have the mass,
(b) two photon pairs to have the mass, and
(c) the momentum vector from the target to point to the center of energy of
the photons on the calorimeter.
The of the constrained fit () was calculated for all 45 combinations,
and the one with the minimum was chosen to be the correct pairing.
For successful reconstructions,
equals the mass for decays
and the mass () for decays.
Figure 2 shows of data,
the MC results and the MC results with a MeV/ mass.
The signal region is defined to be 211.3 MeV/ 217.3 MeV/.
Since the decay has three ’s in the final state,
could be the invariant mass of any one of the three ’s.
Since only the reconstructed masses of the first and second photon pairs
are constrained,
the pairing with the minimum
left the worst reconstructed mass of in the third photon pair.
This explains
the dip in the peak.
The mode, with the branching ratio PDG ,
was our dominant background source.
Our MC results show
the tail of the mass peak extended into the mass region.
This background was caused by wrong photon pairing combinations,
and was suppressed by requiring
4 and 6.
The background was further suppressed by rejecting events
consistent with decays.
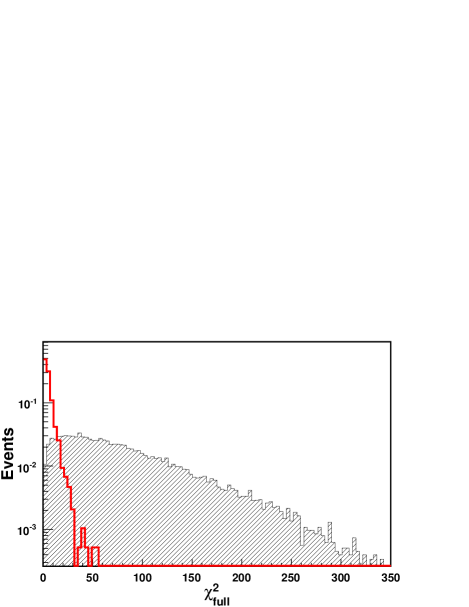
We applied another constrained fit, called the “full constrained fit”,
by requiring the three photon pairs to have ,
and reconstructing each event as .
As shown in Fig. 3, events in the signal region
have smaller () than .
By discarding events with 50,
the wrong pairing background events in the region 165 MeV/
were suppressed by a factor .
The acceptance of ( MeV/ ) decays
by the cut was estimated to be
based on the simulations.
Figure 3: (color online)
The distribution of events
just before the cut, explained in the text,
in the signal region
of MeV/.
The red (open) histogram shows the MC results
and shaded histogram shows the MC results ( MeV/ ).
The cut point was set at 50.
With all the selection cuts applied on the data,
only 2 events survived in
the 6-MeV/ wide mass region centered on 214.3 MeV/
and 250 events in sideband regions
(165 MeV/ 211.3 MeV/ and 217.3 MeV/).
The surviving events
had a distribution consistent with decays.
We adopted an unbinned extended-likelihood method to extract the number of signal events.
Since the mass was close to the kinematical boundary at MeV/,
the background shape was modeled by the events in data sideband with the ARGUS function argus ,
which is defined as:
where is the end point of the ARGUS function, is ,
and determines the curvature of ARGUS function.
For the signal MC results,
the reconstructed mass peak is asymmetric because of the kinematical limit of the mass.
In this case,
a double Gaussian function with different mean values of the two composition Gaussian functions
was chosen as the probability density function (PDF) to model the signal shape from the signal MC results.
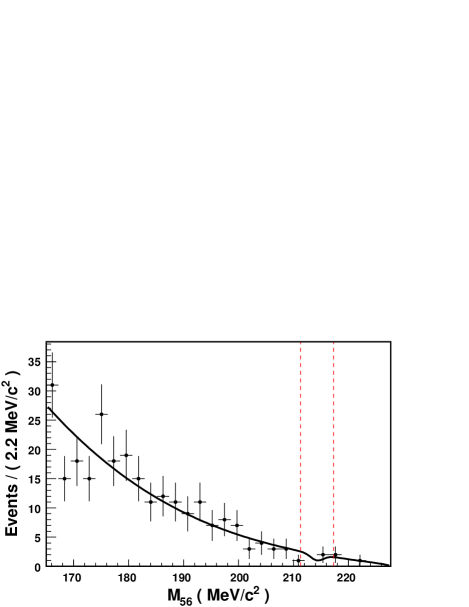
The modeling result of the 214.3 MeV/ mass is shown in Fig. 4.
The number of signal events obtained from the extended-likelihood method,
, was .
A dip around 214.3 MeV/ shows that a negative number of signal events was yielded.
In this paper, we searched for in the mass region 190 MeV/ and no evidence for was found.
We have already published an upper limit
on the branching ratio of decaying into invisible particles,
in the low mass region ( 100 MeV/) jnix .
Figure 4: The modeling result of the 214.3 MeV/ mass.
Error bars show the data, and the solid line
which is the combination of background and signal PDF,
is the modeling result.
The region between two dashed lines is the signal mass region.
Table 1: A summary of the systematic uncertainties.
The uncertainty in the background(bkgd) shape is shown in the uncertainty of
and the others are shown in the percentage uncertainty on the branching ratio.
(MeV/)
()
()
()
()
()
Table 2: A summary of the signal yields (), the acceptances of the signal decay (Accept.), single event sensitivities (S.E.S.),
central value of the branching ratios (B.R.), and the upper limits at the confidence level(U.L.).
(MeV/)
Accept. ()
S.E.S. ()
B.R. ()
U.L. ()
10.7
7.9
5.0
3.5
2.4
2.6
Table 1 summarizes systematic uncertainties due to
the signal shape modeling,
the signal resolution difference between data and the MC results,
the signal efficiency,
the flux estimation, and
the background shape modeling.
The dominant uncertainty was source .
The uncertainty was evaluated by comparing
the value of
while changing the signal PDF width by 1 fitted error in the signal extraction.
The width of the 214.3-MeV/ mass distribution modeled
by a single Gaussian function was 1.2 MeV/.
The uncertainties and were evaluated in similar way by
changing the width of the signal PDF and the curvature of the background PDF.
Since the signal peak was not found in data,
the uncertainty was evaluated indirectly by
assuming that the difference in signal resolution is
the same as the resolution in reconstructed between data and the MC results.
The mass peak, which had a hollow dip in the center of the peak,
was modeled by the double Gaussian function
composed of the two Gaussian functions with opposite norm.
The one with positive norm described the sides of the peak
and the one with negative norm took out the hollow area in the center.
The percentage difference of the resolution between data and the MC results
was estimated to be .
During signal extraction the background PDF was fixed.
The uncertainty was evaluated by comparing the change in
while floating the curvature of the ARGUS function
in the signal extraction.
The uncertainty was simply determined by the statistics of the signal MC results.
The number of accumulated was estimated by the mode
and was cross-checked by the mode PDG .
Acceptance discrepancies in selection cuts
between data and MC results create an uncertainty in the flux estimation.
That uncertainty is listed in row (d).
The flux at 10 m from the target was determined to be
based on the number of decays downstream of that point.
The results of different are summarized in Table 2.
was the number of signal events yielded, and the quoted error was the fitting error.
The signal acceptance was calculated using MC code.
From the acceptance and the flux,
the single event sensitivity for , was defined as:
The error quoted in S.E.S. was evaluated by summing all the systematic uncertainties quadratically.
The negative central value of the branching ratio was due to the negative yield of in the signal extraction.
The upper limit was calculated by
integrating up to of the area under the likelihood function,
for 0.
The systematic uncertainties were incorporated by
convolving the likelihood function with a Gaussian function,
and the statistical uncertainty was incorporated while integrating the likelihood function.
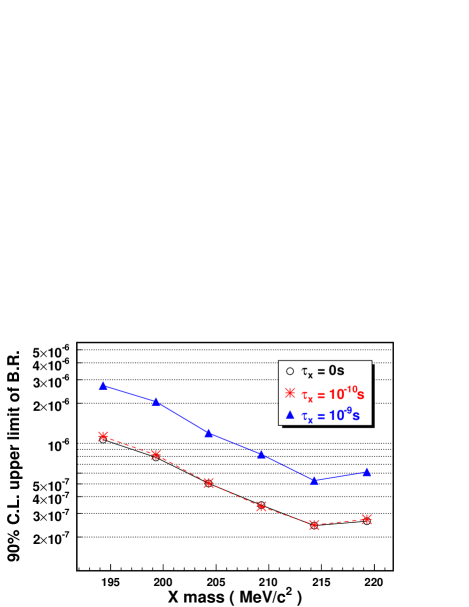
Figure 5: (color online)
The confidence level upper limits of the BR(, )
for different lifetimes as a function of the mass.
The upper limit on the branching ratio for , decay
depends on the lifetime () and the mass of as shown in Fig. 5.
The upper limits were independent of the lifetime if it was shorter than s.
The upper limit on the branching ratio for , ( MeV/) decay
was set to be in the lifetime region of .
The upper limits weaken by a factor of 2–3 if the lifetime was s.
The upper bound of the lifetime was estimated to be s by ds1 .
Acknowledgements.
We are grateful to the operating crew of the KEK 12-GeV proton synchrotron
for their successful beam operation during the experiment.
This work has been partly supported by a Grant-in-Aid from the MEXT and JSPS in Japan,
a grant from National Science Council in Taiwan, from the U.S. Department of Energy
and from Korea Research Foundation.
References
[1]
HyperCP collaboration, H. K. Park et al., Phys. Rev. Lett.94, 021801 (2005).
[2]
D.S. Gorbunov and V.A. Rubakov, Phys. Rev.D73,
035002 (2006).
[3]
D.S. Gorbunov and V.A. Rubakov, Phys. Rev.D64,
054008 (2001).
[4]
X. G. He, J. Tandean, and G. Valencia, Phys. Rev. Lett.98, 081802 (2007).
[5]
J. K. Ahn et al., Phys. Rev. Lett.100, 201802 (2008).
[6]
H. Watanabe et al.,
Nucl. Instr. Meth. Phys. Res., Sect. A 545, 542 (2005).
[7]
M. Itaya et al.,
Nucl. Instr. Meth. Phys. Res., Sect. A 522, 477 (2004).
[8]
M. Doroshenko et al.,
Nucl. Instr. Meth. Phys. Res., Sect. A 545, 278 (2005);
T. Sumida, Ph.D. thesis, Kyoto University, 2008;
G. N. Perdue, Ph.D. thesis, University of Chicago, 2008.
[9]
R. Brun et al., computer code GEANT 3.21, CERN, Geneva,
1994.
[10]
P. Avery, Fitting Theory I-V.
http://www.phys.ufl.edu/avery/fitting.html.
[11]
The branching ratio of each decay mode was taken from
W.-M. Yao et al. (Particle Data Group),
J. Phys. G 33, 1 (2006) ;
http://pdg.lbl.gov/ .
[12]
ARGUS collaboration, H. Albrecht, Phys. Lett B 241, 278 (1990).
[13]
J. Nix et al., Phys. Rev.D76, 011101(R) (2007).