Solar Forcing of the Streamflow of a Continental Scale South American River
Abstract
Solar forcing on climate has been reported in several studies although the evidence so far remains inconclusive. Here, we analyze the streamflow of one of the largest rivers in the world, the Paraná in southeastern South America. For the last century, we find a strong correlation with Sunspot Number, in multi-decadal time scales, with larger solar activity corresponding with larger streamflow. The correlation coefficient is r=0.78, significant to a 99% level. In shorter timescales we find a strong correlation with El Niño. These results are a step toward flood prediction, which might have large social and economic impacts.
pacs:
92.70.Qr,93.30.JgI Introduction
Evidence of a solar influence on climate has been traditionally found on records of Northern Hemisphere temperature (1991Sci…254..698F, ), or sea surface temperature (1997JGR…102.3255W, ), usually related to changes in solar irradiance (2006JGRC..11109020W, ; 2008JGRC..11301002W, ). Also, a link between solar activity and cloud cover through the action of cosmic rays has been proposed (2000PhRvL..85.5004M, ) and widely discussed (2002JGRD..107.4211S, ). Recently, a number of studies took a new approach to the problem, looking into paleoclimatic records of atmospheric moisture. For example, evidences were found of the solar influence on the Asian Monsoon 2001Natur.411..290N ; 2002E&PSL.198..521A ; 2003Natur.421..354G ; 2003Sci…300.1737F ; 2005Sci…308..854W , in the drought conditions in Africa (2000Natur.403..410V, ) and Mexico (2001E&PSL.192..109H, ), and in general in tropical precipitation regimes (2004JASTP..66.1767V, ). The influence of solar activity on regional precipitations was also found in experiments with a global climate model (2003JCli…16..426M, ).
Here, we take a different approach to the problem, looking into a different climatic variable, also related to moisture, in a different time scale: we study the streamflow of the Paraná River during the last 100 years (2005MmSAI..76.1002M, ).
River streamflows are excellent climatic indicators since they integrate precipitations, infiltrations and evapotranspiration over large areas. In particular, those rivers with continental scale basins smooth out local variations, and can be particularly useful to study global forcing mechanisms. Moreover, knowledge and/or prediction of streamflow regimes is fundamental for different social and economic reasons, from the prediction of floods and droughts to planning of agricultural or hydroenergetic conditions.
II Data
The Paraná is one of the largest rivers in the world: with a basin area of over 3,100,000 km2 and a mean streamflow, during the last two decades of the 20 century, of 20,600 m3/s, the Paraná is the fifth river of the world according to drainage area and the fourth according to streamflow. With its origin in the southernmost part of the Amazon forest, it flows south collecting water from the countries of Brazil, Paraguay, Bolivia, Uruguay and Argentina, and forms one of the mightiest deltas of the world before its outlet in the Plata River, a few kilometers north of the City of Buenos Aires. Due to the fact that, unlike other rivers of similar size like the Amazon or the Congo, it flows through heavily populated areas, and that it is navigated by overseas trade ships, it has one of the longest streamflow data series, which covers the last century.
Here we analyze the streamflow data measured at a gauging station located in the city of Corrientes, 900 km north of the outlet of the Paraná. It is measured continuously from 1904, on a daily basis. The Paraná’s hydrological year goes from September to August, with maximum streamflow in the (Southern Hemisphere’s) summer months of January, February and March. We therefore build our yearly series integrating the flow from September to August of the next year. The data are shown in Fig. 1(a), together with the trend obtained with a low-pass Fourier filter with a 50 years cut-off.
It can be seen that the flow of the Paraná is larger in the last three decades, with a mean value almost 20% larger than that of the first seventy years of the 20 century. In particular, the streamflow during the last 30 years has increased in the months in which the flow is minimum, May to December, while the flow remains more or less constant during the months of maximum. This trend has already been noticed, and was attributed to Amazonian deforestation (1991JCli….4..957N, ), which should facilitate water drainage. However, the same trend is also found in other rivers of the region like the Iguazú, whose sub-basin has not undergone significant changes in land use during the 20 Century (Garcia98, ). On the other hand, this trend can be considered as an integral part of the large-scale variations of the climate system (1998JCli…11.2858G, ). It should be noted that southeastern South America is one of the principal regions of the globe where land surface temperature has been increasing since 1900 (1998JCli…11.2570R, ).

As a solar activity indicator we consider the yearly Sunspot Number () sunspot , which is shown in Fig. 1(b) together with its trend, obtained in the same way than that for the streamflow. Alternatively, the irradiance reconstruction by Wang et al. 2005ApJ…625..522W can be used as a solar activity indicator. It differs somehow from the sunspot record since irradiance depends more on bright regions on the solar surface.
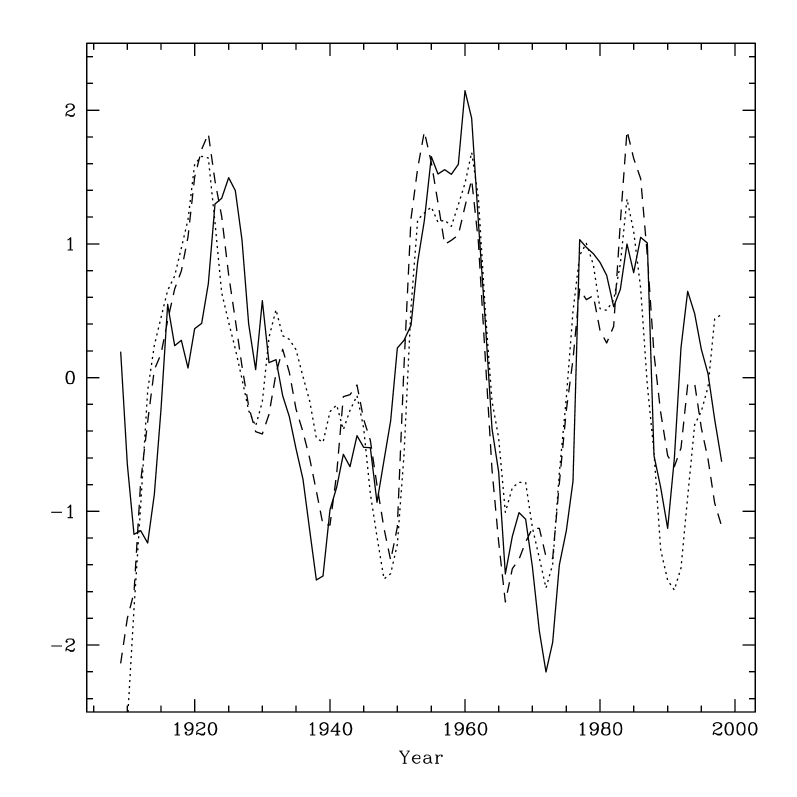
In Fig. 2 we show the detrended time series for streamflow, and the irradiance reconstruction. In all cases we have substracted the trend shown in Fig. 1 from the annual data, and we have performed an 11 year running-mean to smooth out the solar cycle. When plotting together different quantities, two free parameters are usually introduced, namely, the offset and the relative scales. To avoid these two artificial parameters, we have normalized the three quantities by substracting the mean and dividing by the standard deviation of each series.
III Results
Visual agreement between the Paraná’s streamflow, the sunspot number and the irradiance reconstruction shown in Fig. 2 is quite remarkable. The Pearson’s correlation coefficient between streamflow and SN is r=0.78, and between streamflow and irradiance is r=0.69. We performed a t-Student test to check the significance of these correlations, reducing the number of effective points to take into account the autocorrelation of the series and the smoothing, and we obtained a significance level higher than 99.99% in both cases. We also analyzed the significance level of the correlations with a non-parametric random-phase test 1997JCli…10.2147E . For the SN series, we obtained that only a 0.4% of the random series presented a correlation coefficient greater than 0.78. In this way, we obtain a significance level of 99.6% for the correlation between streamflow and SN. For the irradiance reconstruction, the significance obtained with this method is larger than 99.99%.
Recently, a mechanism has been proposed for the influence of solar activity on climate, involving the modulation of galactic cosmic rays (GCR) by the interplanetary magnetic field associated with the solar wind and, therefore, with solar activity. In this picture, GCR would affect cloud formation on earth, through ionization of the terrestrial atmosphere. Therefore, periods of higher solar activity, when the interplanetary magnetic field is larger, and therefore less GCR hit the earth, the cloud cover would be smaller. For this reason, it is particularly interesting to check whether there is a particularly strong correlation between the Paraná’s discharge and GCR.
Therefore, we have also checked the correlation with two other solar-activity indexes. First, we considered the neutron count at Climax, Colorado, available since 1953 (climax, ). Since neutrons are produced when GCR hit the upper atmosphere, neutron count is a direct measure of GCR flux. Furthermore, since GCR flux in different parts of the world depend only on latitude, following the strength of the terrestrial magnetic field, Climax’s values are representative of GCR flux everywhere.
The other index we used was the aa index, which is a measure of the disturbance level of the Earth’s magnetic field based on magnetometer observations of two, nearly antipodal, stations in Australia and England (1998GeoRL..25.1035C, ), and it is available since 1868 geomag . It is worth pointing out that the aa index follows the envelope of solar activity, and while returns to zero at each solar minimum, aa minima reflect the long-term level of solar activity seen in Fig. 1(b). Since the Earth’s magnetic field, which is affected by the solar wind, determines how much of the GCR flux ultimately reaches the Earth, aa can also be used to test the GCR-climate hypothesis.
In both cases, we found a correlation with Paraná’s streamflow, as expected since all indexes of solar activity are correlated between each other. However, the correlations shown in Fig. 2 are the largest, pointing to a more direct correlation with solar irradiance than with GCR.
An important point to be stressed regards the sign of the relationship between solar activity and river discharge reported here, which implies that wetter conditions in this area coincide with periods of higher solar activity. This is in agreement with paleoclimatic studies of the Asian monsoon 2002E&PSL.198..521A ; 2003Natur.421..354G ; vonrad which report an increase in monsoon during periods of increased solar activity. Also, increases in solar activity were found to be correlated with increased moisture over Alaska during the Holocene (2003Sci…301.1890H, ), and similar results were found in simulations of climate during a period of reduced solar activity known as the Maunder Minimum (2001Sci…294.2149S, ).
In contrast, studies in East Africa report severe droughts during phases of high solar activity and increased precipitation during periods of low solar irradiation (2000Natur.403..410V, ). To explain these differences it has been proposed that increased solar irradiation causes more evaporation in equatorial regions, enhancing the net transport of moisture flux to the Indian sub-continent via monsoon winds (2002E&PSL.198..521A, ). A similar mechanism was found in simulations with a climate model, in which enhanced solar forcing produces greater evaporation in relative cloud-free regions in the subtropics, and the resulting moisture then converges into the precipitation convergence zones (2003JCli…16..426M, ).
In the American continent, droughts in the Yucatan Peninsula have been associated with periods of high solar activity and even proposed to explain the Mayan decline (2001E&PSL.192..109H, ), in contrast with the results found here. This is in agreement with an inverse correlation that was found between the southern and northern regions of South America, with dry periods in the South corresponding almost in phase to humid intervals in the North and vice versa (Iri99, ).
The fact that solar influence is different in different parts of the world is of particular importance when assessing the proposed relationship between solar activity and climatic change, since it points out to modifications in circulation patterns or other mechanisms that do not globally affect climatic variables like moisture, but affect their distribution instead.

Finally, in Fig 3 we show the high frequency variations of the Paraná’s streamflow, obtained by subtracting the 11-year-running-mean from the yearly data. Also shown is the Niño1+2 index, averaged from September to August next year, to coincide with the hydrological year of the river. El Niño1+2, which is available since 1950, is a measure of the sea surface temperatures in the Equatorial Pacific Ocean, close to the South American coast (0-10 S, 80-90 W) indices . In this case, a very good accordance between both curves can be seen, with a correlation coefficient r=0.65 and a significance larger than 99.99%. In particular, the large annual discharges of 1982 and 1997 are associated with two exceptional El Niño episodes.
This relation between the Paraná’s streamflow and the ENSO phenomenon and, in particular, the sea surface temperatures in a region of the tropical Pacific, was already used in flood predictions in this basin (Flamenco, ). A similar correlation was also found for the Indian monsoon (1997GeoRL..24..159M, ).
IV Conclusions
Streamflow variability of the Paraná river has three temporal components: on the secular scale, it is probably part of the global climatic change, which at least in this region of the world is related with more humid conditions; on the multi-decadal time scale, we found a strong correlation with solar activity, as expressed by the Sunspot Number, and therefore probably with solar irradiance, with higher activity coincident with larger discharges; on the yearly time-scale, the dominant correlation is with El Niño.
These correlations can be used for flood prediction: a regression between Paraná’s streamflow (), the sunspot number filtered as in Fig. 2 (), and El Niño1+2 (), gives:
between 1949 and 1999, with a Pearson correlation coefficient r=0.66, significant to 99.99%.
Early flood prediction, in fact, has large social and economic impacts: During the last flood, in 1997, 180,000 km2 of land were covered with water, 125,000 people have to be evacuated, and 25 people died. In all, the three largest floods of the Paraná during the 20 century caused economic losses for five thousand million dollars.
References
- (1) E. Friis-Christensen and K. Lassen, Science 254, 698 (1991).
- (2) W. B. White, J. Lean, D. R. Cayan, and M. D. Dettinger, J. Geophys. Res. 102, 3255 (1997).
- (3) W. B. White, Journal of Geophysical Research (Oceans) 111, 9020 (2006).
- (4) W. B. White and Z. Liu, Journal of Geophysical Research (Oceans) 113, 1002 (2008).
- (5) N. D. Marsh and H. Svensmark, Physical Review Letters 85, 5004 (2000).
- (6) B. Sun and R. S. Bradley, Journal of Geophysical Research (Atmospheres) 107, 4211 (2002).
- (7) U. Neff, S. J. Burns, A. Mangini, M. Mudelsee, D. Fleitmann, and A. Matter, Nature (London) 411, 290 (2001).
- (8) R. Agnihotri, K. Dutta, R. Bhushan, and B. L. K. Somayajulu, Earth and Planetary Science Letters 198, 521 (2002).
- (9) A. K. Gupta, D. M. Anderson, and J. T. Overpeck, Nature (London) 421, 354 (2003).
- (10) D. Fleitmann, S. J. Burns, M. Mudelsee, U. Neff, J. Kramers, A. Mangini, and A. Matter, Science 300, 1737 (2003).
- (11) Y. Wang, H. Cheng, R. L. Edwards, Y. He, X. Kong, Z. An, J. Wu, M. J. Kelly, C. A. Dykoski, and X. Li, Science 308, 854 (2005).
- (12) D. Verschuren, K. R. Laird, and B. F. Cumming, Nature (London) 403, 410 (2000).
- (13) D. A. Hodell, C. D. Charles, and F. J. Sierro, Earth and Planetary Science Letters 192, 109 (2001).
- (14) H. van Loon, G. A. Meehl, and J. M. Arblaster, Journal of Atmospheric and Solar-Terrestrial Physics 66, 1767 (2004).
- (15) G. A. Meehl, W. M. Washington, T. M. L. Wigley, J. M. Arblaster, and A. Dai, Journal of Climate 16, 426 (2003).
- (16) P. Mauas and E. Flamenco, Memorie della Societa Astronomica Italiana 76, 1002 (2005).
- (17) C. A. Nobre, P. J. Sellers, and J. Shukla, Journal of Climate 4, 957 (1991).
- (18) W. M. García, N. O.and Vargas, Climatic Change 38, 359 (1998).
- (19) J. L. Genta, G. Perez-Iribarren, and C. R. Mechoso, Journal of Climate 11, 2858 (1998).
- (20) A. W. Robertson and C. R. Mechoso, Journal of Climate 11, 2570 (1998).
- (21) URL ftp://ftp.ngdc.noaa.gov/STP/SOLAR_DATA/SUNSPOT_NUMBERS.
- (22) W. Ebisuzaki, Journal of Climate 10, 2147 (1997).
- (23) Y.-M. Wang, J. L. Lean, and N. R. Sheeley, Jr., Astrophys. J. 625, 522 (2005).
- (24) URL http://www.env.sci.ibaraki.ac.jp/ftp/pub/WDCCR/STATIONS/climax.
- (25) E. W. Cliver, V. Boriakoff, and J. Feynman, GeoRL 25, 1035 (1998).
- (26) URL ftp://ftp.ngdc.noaa.gov/STP/GEOMAGNETIC_DATA/AASTAR.
- (27) U. von Rad, M. Schaaf, K. H. Michels, H. Schulz, W. H. Berger, and F. Sirocko, Quat. Res. 51, 39 (1999).
- (28) F. S. Hu, D. Kaufman, S. Yoneji, D. Nelson, A. Shemesh, Y. Huang, J. Tian, G. Bond, B. Clegg, and T. Brown, Science 301, 1890 (2003).
- (29) D. T. Shindell, G. A. Schmidt, M. E. Mann, D. Rind, and A. Waple, Science 294, 2149 (2001).
- (30) M. Iriondo, Quat. Int. 57-58, 112 (1999).
- (31) URL http://www.cpc.ncep.noaa.gov/data/indices/sstoi.indices.
- (32) E. Flamenco, Bull. Inst. francais d’études Andins pp. 807–818 (1998).
- (33) V. M. Mehta and K.-M. Lau, GeoRL 24, 159 (1997).