Density effect on multiwavelength luminosities on star-formation regions in NGC 3184 and NGC 3938
Abstract
Aims. We analyzed the regions of star formation in the spiral galaxies NGC 3184 and NGC 3938 from archive images for a wide range of wavelengths (NUV from GALEX, H from JKT and KPNO, 8 and 24 m from Spitzer, and CO from BIMA).
Methods. We used the Clump Find Algorithm to extract the properties of the star-forming tracers, identifiable as emission regions at each wavelength.
Results. We obtained a power-law relation between the luminosity and the emission region volume that scales as expected, , for the H and NUV emission, but the luminosity varies far more rapidly with the volume for the dust (8 and 24 m) and molecular gas emitting regions in CO. This is interpreted as a change in the emissivity with the size of the cloud, either by an augmentation of the overall density or due to the presence of high density clumps, with high local emissivity coefficients. Although the clumpy nature of molecular gas may be unsurprising, the clumpy nature of mid-infrared emission regions, which could be explained by newly formed high to intermediate mass stars embedded in the dust providing the heating, is clearly revealed in both galaxies.
Key Words.:
Galaxies: ISM – Galaxies: fundamental parameters (luminosities) – Galaxies: Individual: NGC 3184 and NGC 39381 Introduction
Surveys completed with both the Spitzer Space Telescope (Werner et al. 2004) and the Galaxy Evolution Explorer (GALEX; Martin et al. 2005) provided morphologically detailed IR and UV images of galaxies. Likewise, surveys such as the Berkeley Illinois Maryland Association (BIMA) Survey of Nearby Galaxies (SONG; Helfer et al. 2003) provided us with aperture synthesis CO mapping surveys of galaxies. These surveys are enabling multiwavelength studies of star-formation activity with adequate resolution and sensitivity (e.g. Calzetti et al. 2005, 2007; Kennicutt et al. 2007; Thilker et al. 2007), and the cross calibration of star-formation rate (SFR) indicators at different wavelengths (see Calzetti et al. 2007).
Since the work by Kennicutt (1988), studies of H II regions in spiral galaxies by means of their H emission have demonstrated that the logarithm of the diameter of the H II region and the logarithm of the H luminosity scale roughly with a value of one third, i.e. linearly with the volume, which is the slope expected for constant density radiation-bounded nebulae. This trend is found in studies of H II regions of several spiral galaxies, such as NGC 7331 (Marcelin et al. 1994), NGC 3992 (Cepa & Beckman 1989), and NGC 4321 (Cepa & Beckman 1990), as well as in irregular galaxies such as NGC 6822 (Hodge et al. 1989), and IC 10 (Hodge & Lee 1990).
We present a study of star-formation regions in the spiral face-on galaxies NGC 3184 and NGC 3938 using images at various wavelengths (NUV from GALEX, H from JKT and KPNO, 8 and 24 m from Spitzer, and CO from BIMA). Our aim is to explore the possible slope values of the relation for the collection of individual gaseous or dusty star-forming regions of volume and luminosity detected at each frequency bandwidth .
This work is a phenomenological study to provide clues in understanding the different processes affecting the observed beta slope.
2 Multiwavelength Images of NGC 3184 and NGC 3938
The galaxy images were taken from archive data. We used the Spitzer Infrared Nearby Galaxy Survey (SINGS; Kennicutt et al. 2003) database to select candidate spiral galaxies oriented nearly face–on, which are the most suitable for our study because optical and UV data are less affected by extinction. From a short list of candidates, we selected NGC 3184 and NGC 3938 , both with available 8 m Infrared Array Camera (IRAC; Fazio et al. 2004) images and 24 m Multiband Imaging Photometer (MIPS; Rieke et al. 2004) images from Spitzer with a resolution of 0.75 ″ pixel-1. For both galaxies, CO maps at 2.6 mm (J:10) are also available with a resolution of 0.997 ″ pixel-1 1.009 ″ pixel-1 from BIMA SONG (Helfer et al. 2003). The H image of NGC 3184 with a resolution of 0.234 ″ pixel-1 is from the archive of the Jakobus Kapteyn Telescope of the Isaac Newton telescopes (Knapen et al. 2004), and that of NGC 3938 was obtained from the NASA/IPAC Extragalactic Database (NED) taken at the 2.1m telescope at Kitt Peak National Observatory (KPNO) of NOAO (National Optical Astronomy Observatory) with a resolution of 0.303 ″ pixel0.302 ″ pixel-1. The 2271 Å (NUV) image was obtained by GALEX (Martin et al. 2005), and has a resolution of 1.513 ″ pixel1.514 ″ pixel-1, and covers a bandwidth of 1750-2800 Å.
3 Clump Finding Analysis
To be able to study the clumpy structure of the galaxies at each wavelength, we used the Clump Finding algorithm developed by Williams et al. (1994) to study structure in molecular clouds. We have used a 2D version of the routine, Clumpfind2D, originally in Fortran and then adapted to IDL. This algorithm defines different clumps using the “friends-to-friends” routine, which groups pixels with some sort of connectivity among them, and inside a specific range of intensity. The final result of the Clumpfind2D routine is a list of the different clumps, their position, and their area in pixels.
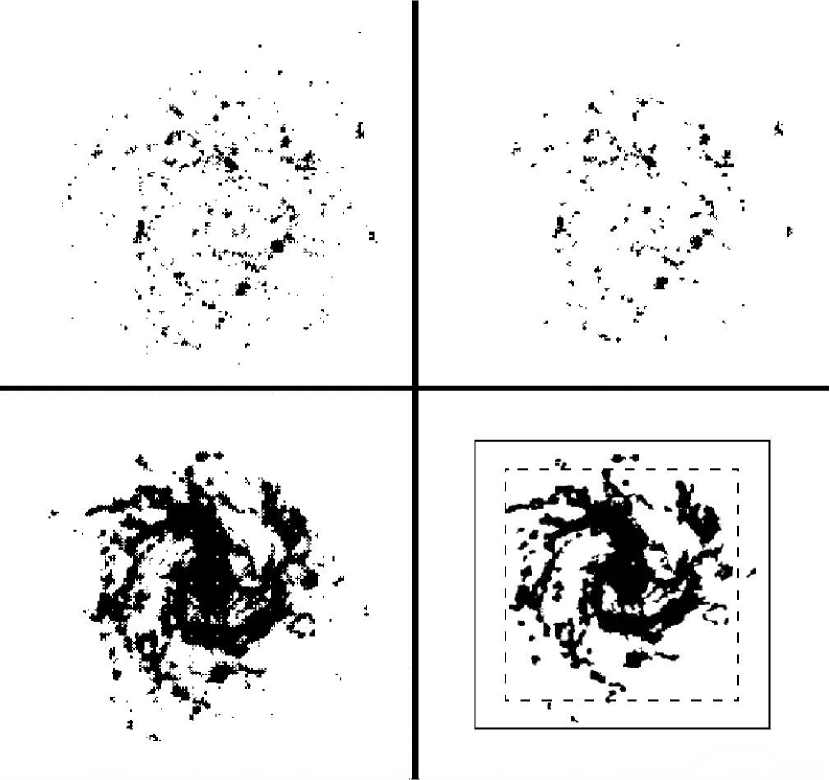
Galaxy images were preprocessed. Foreground stars were removed from the original galaxy images using standard IRAF routines. The areas explored for clumps in each galaxy correspond to the minimum area in which the galaxy is observed at all wavelengths. For NGC 3184 , the areas studied are H 88 ′, 8 m 88 ′, 24 m 4.54.5 ′, and CO 5.75.6 ′(c.f. bottom right panel in Fig. 1). For NGC 3938 , a similar area of 5.75.6 ′ was studied at all wavelengths, NUV, H, 8 and 24 m, and CO.
As an example of how the morphology is well reproduced, in Fig. 1 we show the original image of NGC 3184 at H (top) and 8 m (bottom) with the corresponding images obtained by Clumpfind2D (right panel).
4
The flux-calibrated original image and the clump or emission-region parameters obtained with ClumpFind2D allow us to calculate the luminosity of each region emitted at a particular wavelength. To calculate emission-region luminosities, we assumed a distance of 11.52.0 Mpc for NGC 3184 and of 11.60.8 Mpc for NGC 3938 , taken from NED. Different corrections were applied to the calibrated fluxes depending on the wavelength, for NUV, a Milky Way (Cardelli et al. 1989) and internal extinction (Buat et al. 2005) corrections; for H, a Milky Way extinction (Cardelli et al. 1989) and contribution of N [ii] (Calzetti et al. 2007) corrections; and for 8 m, a Milky Way extinction correction (Indebetouw et al. 2005). No corrections were made for CO and 24 m fluxes. Luminosities were calculated at the corresponding frequencies of H, 8 and 24 m, CO 2.6 mm, and NUV (2271 Å) if available. We therefore calculate luminosities of regions of emitting gas (ionized or molecular) or dust at 8 and 24 m, which have been identified as characteristic tracers of star-forming regions.
We noticed a relation between the areas of the emission regions and their luminosities for a given wavelength. Assuming a spherical geometry, the volume was found based on the equivalent radius obtained from the original emission-region area. The relations between the multiwavelength luminosities of the clumps and their corresponding volumes (defined to be , where is the mean radius of the emission region) obtained for NGC 3184 and NGC 3938 are of the form .
To visualize the difference between all of star-formation tracers, we present them in different panels on Fig. 2 and plotted together on Fig. 3. In both galaxies, the dispersion in H is comparable to previous results (e.g. Kennicutt 1988). For CO and NUV, the dispersion is comparable with that in H, while for both 8 and 24 m the dispersion is smaller.
For NGC 3938 , the slope values () for both H and NUV are close to 1, while for the other tracers the slopes are much steeper (see the right panel of Fig. 2). On the other hand, for NGC 3184 the slope for H does not become close to 1, but the other luminosities follow the same trend with volume as that found in NGC 3938 . For both galaxies, the dust tracers render the most similar values, being identical for 24 m. The steepest value is obtained for the two galaxies with the CO clumps.

5 Discussion
5.1 Star-formation tracers
The various wavelengths are related to the star-formation process in different ways. The NUV emission originates in regions populated by massive, young stars (ages yr). This radiation is affected significantly by extinction, but after the necessary corrections have been made, its intensity relates directly to the actual SFR (Iglesias-Páramo et al. 2006). The H emission is the principal recombination line used to trace the transparent star-forming H II regions, where the presence of dust is negligible and molecular gas has been wiped out (Osterbrock 1989). There has been a discussion about the problems of using the 8 m emission dominated by PAHs as a tracer of star formation (SF), and no final conclusion has been reached (Calzetti et al. 2007; Wu et al. 2005). Since PAHs have been found to be associated with very young stars, it is likely that its emission is a reliable SF tracer. The relation between SF and emission at 24 m due to a hot dust phase has been investigated several times (see Helou et al. 2000), and is found to originate in very small dust grains (VSG) in regions surrounding the ionized gas. Finally, CO traces the molecular clouds inside which the process of SF occurs (molecular cores) or will occur (Kennicutt et al. 2007).
5.2 On the value of the slope
The luminosity of an emitting cloud of gas (or even stars) is to a first approximation given by , where the integral is computed over the entire volume of the cloud and is the local emissivity at frequency . If all parameters that control are constant within the volume, the expression reduces simply to . If the shape of the cloud is globally spherical, then . In this case, we expect a slope of , which is observed in the H image of NGC 3938 and in the NUV image of the same galaxy.
5.2.1 The case of
To derive a value of that differs from one, one of the previous hypotheses must be changed:
-
•
The shape must not be spherical: the clouds could be instead elongated along the line of sight, and this elongation should increase with an increasing size of the cloud. This hypothesis, however, appears very unrealistic.
-
•
The local emissivity could vary with the size of the cloud. This is possible if any parameter to which the emissivity is related varies as well, for example the density of the emitting gas. Most of the emissivity coefficients are related to the square of the gas density. If this is the case, we could obtain a slope larger than one if the mean density of the gas increases with the volume of the cloud. This could be due to a global increase in the density, or to the presence of high density clumps, with high local emissivity coefficients. For these clumpy regions, the resulting luminosity can be decomposed into two contributions: , where and are the total volume of the cloud and the volume of the high density clumps, respectively. The emissivity coefficient of the background low density gas is and the clump emissivity coefficient is . If the volume of the clumps is related to the total volume of the cloud according to , where is similar to a filling factor, we can describe the luminosity by . To observe any effect of the clumps, the contribution of both phases of the gas should have the same order of magnitude: . Since the clumps have higher emissivity coefficients () and a smaller relative volume ( small), one of these two parameters must increase with the size of the cloud to obtain a luminosity higher than that expected from pure volumetric effects (). The first option is that the emissivity of the dense clumps should increase: we can always consider denser clumps as the total size of the cloud increases. The second option is that the relative volume of the clumps increases, i.e. there are more or larger clumps in larger clouds. This would also explain the case of for H in NGC 3184 (see below).
-
•
It is known that due to density inhomogeneities, molecular gas tends to form clumps. However, clumps found at mid-infrared (MIR) emission regions (which could be explained by newly formed high to intermediate mass stars embedded into the dust that heat and re-emit with a temperature dependence ) are probably due to a global increase in the density, or to the presence of high density clumps, with high local emissivity coefficients. The clumpy nature of the dusty regions is clearly revealed in both galaxies. As shown in Fig. 1, MIR clumps closely follow the spiral arms and reach far larger volumes than the other tracers (see Figs. 2 and 3). The ionizing regions detected by their H and NUV emission appear to span a smaller range in volume than dusty and molecular gas regions, which reach far larger volumes.


5.2.2 The case of
The same study of the hypothesis corresponding to must be completed to understand the possible situations leading to (which was obtained for the H image of NGC 3184 ):
-
•
The shape of the cloud is not spherical: it must smoothly change from being spherical to oblate ellipsoidal, with a decreasing size in the direction of the line of sight. In the present case of face-on galaxies, this direction is perpendicular to the plane of the galaxy. The value of would change from 1 to 2/3, as the luminosity would become proportional to the area. This is not what is actually observed, since the slope is rather constant for a large range of cloud sizes.
-
•
Another way of changing the shape of the emitting cloud is to take into account the optical depth along the line of sight, which is related to the cloud’s size in this direction. Increasing the size of the cloud would lead to high values of the optical depth, such that the most distant part of the cloud could not be seen. In this case, it would be the shape of the visible cloud that would change, from a naturally spherical shape to a more disk-shaped when observed face on. We would observe a type of saturation effect as the optical depth started to become important, which would again change the slope from 1 to 2/3, something that is not observed.
-
•
The volume of the emitting cloud can also be reduced by removing its inner part. This may be the case if there were some places inside the cloud from which the gas does not emit. This could be explained if some clumps of gas are in a phase in which they do not emit. The presence of neutral or molecular high density insertions (high density clumps inserted on less dense surroundings), which not only do not emit in H, but also conceal the gas behind them, can lead to a decrease of the emitting volume as the size of the cloud increases. Such insertions would also explain the slope in the case of dust or CO maps as is observed (see Sect. 5.2.1).
-
•
We did not explore the possibility that emissivity decreases with the size of the cloud, since we cannot identify any physical process that could be responsible for this behavior.
6 Conclusions
We have studied star-forming regions in the face-on spiral galaxies NGC 3184 and NGC 3938 , which have emission detectable by a variety of different tracers: NUV, H, CO, and 8 and 24 m. By analyzing the multiwavelength luminosities of star-forming emission regions and their corresponding volumes , we have found a relation of the form . If we suppose that the luminosity is directly proportional to the volume, we should expect a value of 1, which is indeed observed for the images in H and NUV in NGC 3938 .
However, from the CO and 8 and 24 m images, a value of is derived for both NGC 3184 (1.8) and NGC 3938 (1.5). We conclude that this could be due to a change in the local emissivity with the size of the cloud, either by an augmentation of the overall density or because of the presence of high density clumps, with high local emissivity coefficients. For both galaxies we measure similar values of for the dust tracers, i.e. 1.2–1.3 for 8 m and 1.51 for 24 m. From previous studies, the clumpy structure found for molecular gas and H was expected. The mid-infrared emission of dust (PAH and VSG) heated by newly formed high to intermediate mass stars is revealed as clumps as well throughout the galaxies.
For the H image of NGC 3184 , a slope of 1 is obtained, which could be interpreted by the presence of neutral or molecular high density clumps, which not only do not emit in H but also conceal the gas behind them. This can lead to a decrease in the emitting volume as the size of the cloud increases.
For NGC 3184 and NGC 3938 , the volumes found for ionizing regions (H and NUV emission) appear to span a smaller range than that found for dusty (8 and 24 m) and molecular gas regions.
References
- Buat et al. (2005) Buat, V., Iglesias-Páramo, J., Seibert, M., et al. 2005, ApJ, 619, L51
- Calzetti et al. (2007) Calzetti, D., Kennicutt, R. C., Engelbracht, C. W., et al. 2007, ApJ, 666, 870
- Calzetti et al. (2005) Calzetti, D., Kennicutt, Jr., R. C., Bianchi, L., et al. 2005, ApJ, 633, 871
- Cardelli et al. (1989) Cardelli, J. A., Clayton, G. C., & Mathis, J. S. 1989, ApJ, 345, 245
- Cepa & Beckman (1989) Cepa, J. & Beckman, J. E. 1989, A&AS, 79, 41
- Cepa & Beckman (1990) Cepa, J. & Beckman, J. E. 1990, A&AS, 83, 211
- Fazio et al. (2004) Fazio, G. G., Hora, J. L., Allen, L. E., et al. 2004, ApJS, 154, 10
- Helfer et al. (2003) Helfer, T. T., Thornley, M. D., Regan, M. W., et al. 2003, ApJS, 145, 259
- Helou et al. (2000) Helou, G., Malhotra, S., Hollenbach, D. J., Dale, D. A., & Contursi, A. 2000, ArXiv Astrophysics e-prints
- Hodge & Lee (1990) Hodge, P. & Lee, M. G. 1990, PASP, 102, 26
- Hodge et al. (1989) Hodge, P., Lee, M. G., & Kennicutt, Jr., R. C. 1989, PASP, 101, 32
- Iglesias-Páramo et al. (2006) Iglesias-Páramo, J., Buat, V., Takeuchi, T. T., et al. 2006, The Astrophysical Journal Supplement Series, 164, 38
- Indebetouw et al. (2005) Indebetouw, R., Mathis, J. S., Babler, B. L., et al. 2005, ApJ, 619, 931
- Kennicutt (1988) Kennicutt, Jr., R. C. 1988, ApJ, 334, 144
- Kennicutt et al. (2003) Kennicutt, Jr., R. C., Armus, L., Bendo, G., et al. 2003, PASP, 115, 928
- Kennicutt et al. (2007) Kennicutt, Jr., R. C., Calzetti, D., Walter, F., et al. 2007, ApJ, 671, 333
- Knapen et al. (2004) Knapen, J. H., Stedman, S., Bramich, D. M., Folkes, S. L., & Bradley, T. R. 2004, A&A, 426, 1135
- Marcelin et al. (1994) Marcelin, M., Petrosian, A. R., Amram, P., & Boulesteix, J. 1994, A&A, 282, 363
- Martin et al. (2005) Martin, D. C., Fanson, J., Schiminovich, D., et al. 2005, ApJ, 619, L1
- Osterbrock (1989) Osterbrock, D. E. 1989, Astrophysics of gaseous nebulae and active galactic nuclei (Research supported by the University of California, John Simon Guggenheim Memorial Foundation, University of Minnesota, et al. Mill Valley, CA, University Science Books, 1989, 422 p.)
- Rieke et al. (2004) Rieke, G. H., Young, E. T., Engelbracht, C. W., et al. 2004, ApJS, 154, 25
- Thilker et al. (2007) Thilker, D. A., Boissier, S., Bianchi, L., et al. 2007, ApJS, 173, 572
- Werner et al. (2004) Werner, M. W., Roellig, T. L., Low, F. J., et al. 2004, ApJS, 154, 1
- Williams et al. (1994) Williams, J. P., de Geus, E. J., & Blitz, L. 1994, ApJ, 428, 693
- Wu et al. (2005) Wu, H., Chen, C., Cai-Na, H., et al. 2005, The Astrophysical Journal, 632, L79