Dust in the inner regions of debris disks around A stars
Abstract
We present infrared interferometric observations of the inner regions of two A-star debris disks, Leo and Lep, using the FLUOR instrument at the CHARA interferometer on both short (30 m) and long (200 m) baselines. For the target stars, the short baseline visibilities are lower than expected for the stellar photosphere alone, while those of a check star, Leo, are not. We interpret this visibility offset of a few percent as a near-infrared excess arising from dust grains which, due to the instrumental field of view, must be located within several AU of the central star. For Leo, the near-infrared excess producing grains are spatially distinct from the dust which produces the previously known mid-infrared excess. For Lep, the near-infrared excess may be spatially associated with the mid-infrared excess producing material. We present simple geometric models which are consistent with the near and mid-infrared excess and show that for both objects, the near-infrared producing material is most consistent with a thin ring of dust near the sublimation radius with typical grain sizes smaller than the nominal radiation pressure blowout radius. Finally, we discuss possible origins of the near-infrared emitting dust in the context of debris disk evolution models.
1 Introduction
The list of main sequence stars known to have circumstellar material in the form of debris disks has been greatly expanded over the last few years by surveys at longer wavelengths and most recently from Spitzer observations (see e.g., the review by Meyer et al., 2007). Given the size and distribution of dust in these disks, the grains are expected to have short lifetimes. Therefore, it is generally believed that the dust is not remnant from the star formation process, but is generated through collisions of larger bodies. The majority of known debris disks have cold (100 K) material located tens of AU from the central star in an analog of our own Kuiper belt. In some cases, this material extends to 1000 AU. A small fraction (Rieke et al., 2005; Beichman et al., 2006) have warmer dust located within 10 AU of the central star.
The distribution of material in a debris disk is a balance of collisions, radiation pressure, Poynting-Robertson (PR) drag and the dynamical influence of any large bodies in the system. In order to constrain models of these systems, the dust spatial extent and grain size distribution must be measured. Observations of optical and near-infrared scattered light have provided the most detailed overall picture of the dust distribution. However, these scattered light observations do not have sufficient resolution to characterize the material closest to the star, and this is where infrared interferometry can provide a unique constraint.
Although many of these sources do not show a clear near-infrared excess in their spectral energy distribution (SED), limits set by spatially unresolved broadband photometry are generally not better than a few to several percent. A small, warm dust component could be present if dust generated by collisions migrated close to the star or was produced by bodies in close orbits. If located within a few AU of the central star, this dust would be at temperatures which would produce near-infrared emission and small grains would produce scattered light. Detection of (or stringent limits on) warm dust will characterize the inner portions of these debris disks. The spatial resolution of infrared interferometry can be exploited to probe for warm dust in these systems. On long baselines ( 100 meters) the central star is resolved and the visibility is primarily a measure of the stellar photospheric size. On shorter baselines ( 50 meters) the photosphere is mostly unresolved and if the measured visibilities have high accuracy, other emission components can be detected by looking for deviations from the visibility expected for the stellar photosphere. Any resolved or incoherent emission will decrease the measured visibility from the stellar value.
Teams using the Palomar Testbed Interferometer (Ciardi et al., 2001) and the Center for High Angular Resolution Array (Absil et al., 2006; di Folco et al., 2007; Absil et al., 2008) have detected near-infrared extended emission around known debris disk systems, including Vega, the prototype debris disk. While a near-infrared excess was not known through broadband spectral modeling, the interferometrically detected near-infrared excess was consistent with the photometric uncertainties. Observations of other debris disk sources revealed a small near-infrared excess flux around Ceti and Aql (di Folco et al., 2007; Absil et al., 2008). In all these systems, the near-infrared excess is consistent with emission from an inner, hot dust component, although for Aql, a binary companion is also a likely origin.
In this paper we present infrared interferometry observations of two known debris disk systems, the A-type stars, Leo and Lep. The interferometry observations, including determination of the stellar angular diameter, and mid-infrared imaging for Leo are presented in §2. Possible origins for the observed visibility deficit are discussed in §3. In §4, we discuss the distribution of the excess producing grains and in §5 the origin of these grains. Our conclusions are given in §6.
2 Observations and data analysis
2.1 Targets
The targets were chosen from the sample of known debris disk systems with the V and K brightness as the primary selection criteria. Table 1 lists the target and check star stellar properties.
| Parameter | Leo | Leo | Lep |
|---|---|---|---|
| HD number | 102647 | 97603 | 38678 |
| Spectral type11NASA Stars and Exoplanet database: http://nsted.ipac.caltech.edu | A3Va | A5IVn | A2Vann |
| Distance22Distances taken from Hipparcos (Perryman & ESA, 1997); we note a more recent reduction of Hipparocs data (van Leeuwen, 2008) has yielded new distances which are within 1 of those listed here. We use the older values for consistency with previous work. (pc) | 11.1 0.11 | 17.7 0.26 | 21.5 0.32 |
| Radius33this work (R⊙) | 1.58 0.018 | 2.17 0.073 | 1.60 0.11 |
| Teff | 902044Chen et al. (2006) | 829611NASA Stars and Exoplanet database: http://nsted.ipac.caltech.edu | 991011NASA Stars and Exoplanet database: http://nsted.ipac.caltech.edu |
| Luminosity55calculated from the radius and effective temperature (L⊙) | 11.5 1.1 | 15.5 1.8 | 17.0 2.3 |
| v sin i (km/sec) | 11044Chen et al. (2006) | 17366Rieke et al. (2005) | 24544Chen et al. (2006) |
Leo was identified as having an infrared excess from IRAS observations (Aumann & Probst, 1991). Mid-infrared imaging has not resolved the disk (Jayawardhana et al., 2001, §2.4) although differences between the IRAS and ISO fluxes led Laureijs et al. (2002) to suggest that the disk emission may be somewhat extended in the ISO beam (52″ aperture). Chen et al. (2006) obtained Spitzer IRS spectra of Leo and found a featureless continuum spectra consistent with dust at 120 K located 19 AU from the central star.
Lep was also identified as a debris disk by Aumann & Probst (1991) and has an unusually high dust temperature (300 K) (Aumann & Probst, 1991; Chen & Jura, 2001). Recent work by Moerchen et al. (2007) resolved the excess at 18 m and their model comprises two dust bands extending from 2 to 8 AU. As with Leo, the Spitzer IRS spectrum for Lep is featureless (Chen et al., 2006).
2.2 CHARA Observations
Observations were conducted with the FLUOR fiber-optics beam combiner at the Center for High Angular Resolution Array (CHARA) operated by Georgia State University. CHARA is a long-baseline, six-element interferometer with direct detection instruments that work at optical to near-infrared wavelengths (ten Brummelaar et al., 2005). These FLUOR observations were taken in the K’ band and have an effective central wavelength of 2.14 microns. The FLUOR beam combiner produces high precision visibilities by interfering the inputs from two telescopes after spatial filtering through single-mode fibers (Coude du Foresto et al., 2003). In this design, wavefront aberrations are converted to photometric fluctuations which are corrected by simultaneous measurement of the fringe and photometric signals from each telescope.
Leo and a check star Leo were observed on 3 nights in 2006 May and Lep on 2 nights in 2006 October and November. A check star for Lep was observed but due to its lower K band flux, these data were not useful and are not included here. Observations of the targets and check star were interleaved with calibration observations to determine the instrument response function, also called the system visibility. The check star is an additional target with roughly the same properties as the main target, but no known excess emission at any wavelength. Observations of the check star are processed in the same way and with the same calibrators as the main target and serve as a measure of systematic effects in the data. The calibrators used, along with their adopted diameters are given in Table 2.
| Calibrator | Diameter (mas) | Target | Diameter reference |
|---|---|---|---|
| 70 Leo | 0.770 0.015 | Leo, Leo | SB relation, Kervella et al. (2004b) |
| Vir | 0.760 0.015 | Leo, Leo | SB relation, Kervella et al. (2004b) |
| IRC 10069 | 1.342 0.07 | Lep | Mérand et al. (2005) |
| Lep | 0.940 0.020 | Lep | SB relation, Kervella et al. (2004b) |
| HR 1965 | 1.272 0.017 | Lep | Mérand et al. (2005) |
| HR 1232 | 0.920 0.020 | Lep | SB relation, Kervella et al. (2004b) |
The FLUOR data consist of temporally modulated fringes over an optical path difference (OPD) of 170 microns, centered around the zero OPD. The coherence length (fringe packet size) in the K’ band is of order 11 fringes, or approximately 25 microns. In addition to the fringe signal, FLUOR records simultaneous photometric channels, in order to allow the correction of scintillation noise and coupling variations in the input single mode fibers. The photometric correction and flux normalization were done using the numerical methods described in Coude Du Foresto et al. (1997). Once the fringe signal was recovered, we estimated the squared visibilities of individual frames as the integrated power in the frequency domain.
To estimate the fringe power, we used a time/frequency transform, a Morlet wavelets transform, instead of the classical Fourier approach (Coude Du Foresto et al., 1997). The classical Fourier method extrapolates the power under the fringe peak using data collected at frequencies outside the fringe peak (Mérand et al., 2006). This approach works well if the readout noise is white. The wavelets approach isolates the fringe signal in the OPD and in the frequency domains (as described in Kervella et al., 2004a), allowing a measure of the off-fringe power at all frequencies and therefore a direct measurement of the background noise for each scan. The isolation of the fringe signal in OPD is possible because the modulation length used (170 microns) is much larger than the coherence length (approximately 25 microns) and the background noise is measured using the portion of the scan situated more than 50 microns on each side of the fringe packet (i.e. four times the coherence length).
The background noise arises from 3 components: the photometric variation residuals (after photometric correction), the photon shot noise and the detector readout noise. The first component is only present at very low frequencies, since fringes are acquired at a frequency (100Hz) higher than the scintillation and coupling variations (typically 25Hz at CHARA) and because the photometric correction is very efficient. The second component (photon shot noise) is white noise. The third component, readout noise, is less predictable and can have transients or peaks at discrete frequencies (electronic noise). As the wavelet approach directly measures the background component from the data, there are fewer residuals than in the Fourier method where the noise estimate is approximate. For the FLUOR data, the wavelet method improved the consistency of the results, although the basic results are the same between the two methods.
Finally, the final squared visibility estimate and the one sigma uncertainty for a given batch of frames are obtained by the average and standard deviation of the bootstrapped average, as described in Kervella et al. (2004a). The calibrated target data obtained using this reduction method are given in Table 3.
| Object | MJD | Baseline(m) | Pos Angle (deg) | V2 | |
|---|---|---|---|---|---|
| Leo | 53856.226 | 32.531 | -12.980 | 0.9487 | 0.0219 |
| 53856.270 | 33.234 | -21.034 | 0.9001 | 0.0269 | |
| 53856.309 | 33.801 | -26.735 | 0.9285 | 0.0204 | |
| 53864.185 | 313.083 | 74.485 | 0.0679 | 0.0079 | |
| 53865.185 | 312.858 | 74.288 | 0.0503 | 0.0040 | |
| 53865.236 | 293.126 | 68.316 | 0.0897 | 0.0032 | |
| Leo | 53856.248 | 33.823 | -20.956 | 0.9726 | 0.0393 |
| 53856.290 | 34.069 | -27.244 | 1.0025 | 0.0173 | |
| 53856.328 | 33.940 | -31.660 | 1.0356 | 0.0482 | |
| 53864.233 | 286.055 | 62.950 | 0.2206 | 0.0253 | |
| 53865.215 | 295.815 | 65.870 | 0.1790 | 0.0088 | |
| Lep | 54040.479 | 218.336 | -57.363 | 0.7543 | 0.0713 |
| 54040.487 | 223.077 | -57.415 | 0.9403 | 0.1002 | |
| 54040.506 | 232.879 | -57.237 | 0.5783 | 0.0772 | |
| 54045.475 | 24.739 | -22.258 | 0.9742 | 0.0209 | |
| 54045.498 | 26.062 | -26.679 | 0.9524 | 0.0235 | |
| 54045.518 | 27.252 | -29.651 | 0.9696 | 0.0272 |
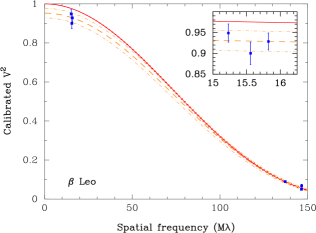
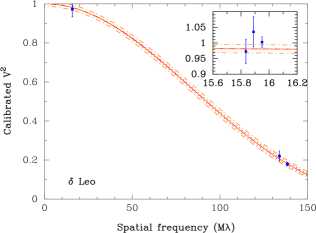
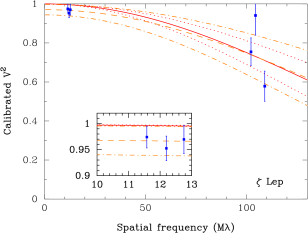
2.3 Stellar size and visibility deficit
If the measured visibilities were due entirely to a resolved stellar disk, both the short and long baseline data would be well-fit with a single uniform disk. However, as shown in Figure 1, the visibility measured on the short baseline for Leo and Lep is lower than expected from the stellar size fit on the long baseline. Fitting a single stellar size to both baselines yields a very poor fit as measured by in comparison to the single-baseline only fits for the target stars, while the single-component fit to both baselines for the check star, Leo, is good (Table 4). Any additional flux component within the field of view will decrease the measured visibility and will therefore make the model more consistent with the short-baseline data. A partially resolved emission component will increase the discrepancy between the long and short baseline visibilities as it would be more resolved, and therefore have lower visibility, on the long baselines. An over resolved, i.e. incoherent, source of emission will produce the same fractional decrease in visibility for all baselines. For the simple case of a star and an incoherent component, the measured visibility, , is
| (1) |
where is the visibility of the stellar photosphere and and are the fractional stellar and incoherent component fluxes. The visibility used here is a normalized quantity such that an unresolved source has while an incoherent (i.e. completely resolved) source has . We fit a single uniform diameter plus an incoherent emission contribution to both baselines, which gives a lower for Leo and Lep than the uniform disk by itself. The visibility deficit for Lep is a tentative detection as the V2 predicted from the stellar size, 0.9960.001, is only 2.3 from the average measured visibility, 0.966 0.013 and the stellar size uncertainty is much larger as the star is smaller and fainter than the other targets. We note that the stellar size for Lep from data reduced using the classical Fourier approach is the same as for the wavelets approach, despite the scatter in the long baseline data. Further observations are needed for confirmation of the visibility deficit of Lep. The best-fit incoherent component corresponds to an excess flux of 2.7 1.4 Jy for Leo and 0.47 0.41 Jy for Lep. For Leo the uniform disk fit is adequate, suggesting no visibility deficit on the check star and no substantial systematics in the observing or data reduction process.
| Object | Uniform disk | Uniform disk | Uniform disk | Uniform disk + incoherent flux | |||||
|---|---|---|---|---|---|---|---|---|---|
| all data | long baselines | short baselines | all data | ||||||
| Diam.(mas) | Diam.(mas) | Diam.(mas) | Diam.(mas) | Inc. flux | |||||
| Leo | 1.332 0.014 | 3.8 | 1.332 0.009 | 2.1 | 2.289 0.31 | 0.9 | 1.323 0.013 | 0.0240.013 | 1.6 |
| Leo | 1.1480.025 | 0.8 | 1.149 0.012 | 0.5 | 0.0 1.17 | 0.5 | 1.1490.022 | 0.00.006 | 1.0 |
| Lep | 0.700.15 | 2.5 | 0.69 0.09 | 3.7 | 2.0 0.65 | 0.2 | 0.66 0.14 | 0.0150.013 | 2.0 |
From the uniform disk fit, we can calculate a limb-darkened angular and physical diameter for these stars using the formula from Hanbury Brown et al. (1974)
| (2) |
where the coefficient depends on the effective temperature and is taken from Claret et al. (1995). The difference between the limb darkened and uniform disk diameters is less than 2% for our stars, with ratio values ranging from 1.011 to 1.014. The uniform disk and limb-darkened diameters and the derived stellar radii are given in Table 5, where the uniform diameter is taken from the stellar + incoherent component model. These limb-darkened diameters agree with values calculated from the surface-brightness relation of Kervella et al. (2004a) of 1.35, 1.17 and 0.73 mas for Leo, Leo, and Lep respectively.
We note that these limb-darkening parameters are appropriate for slowly rotating stars, which is violated by the values for given in Table 1. Aufdenberg et al. (2006) find limb-darkening corrections 2.5 times higher for Vega, an A0 star rotating at 275 km/sec. As our data are insufficient to separately derive the limb-darkening or rotational velocity, we use the low rotation rate coefficients to allow for comparison to other works, but note that even at 2.5 times higher, the limb darkening corrections would be 4%, still much too small to explain the difference between the short and long baseline sizes given in Table 4.
| Object | Uniform disk diam. | LD coeff | Limb darkened diam. | Stellar radius |
|---|---|---|---|---|
| (mas) | (mas) | (R⊙) | ||
| Leo | 1.323 0.013 | 1.012 | 1.339 0.013 | 1.54 0.021 |
| Leo | 1.149 0.022 | 1.014 | 1.165 0.022 | 2.14 0.040 |
| Lep | 0.66 0.14 | 1.011 | 0.67 0.14 | 1.50 0.31 |
The diameter of Leo has been previously measured with interferometry observations. Hanbury Brown et al. (1974) obtained a limb-darkened diameter of 1.33 0.1 mas at a wavelength of 4430 Å with the Narrabri intensity interferometer, while di Folco et al. (2004) measured 1.449 0.027 mas at 2.17 m with the VLTI, which is inconsistent with our diameter at the 3.7 level. However, the di Folco et al. (2004) fit did not include an incoherent component. If we include the di Folco et al. (2004) data in our two component fit, both the stellar diameter and incoherent flux level change by less than 0.2 , thus the VLTI and CHARA data are consistent.
2.4 Mid-infrared imaging
Mid-infrared imaging observations of Leo were made on 2006 March 8 (UT) using the Mid-Infrared Echelle Spectrometer (MICHELLE; Glasse & Atad-Ettedgui, 1993) on the Gemini North 8-meter telescope. MICHELLE utilizes a pixel Si:As blocked impurity band detector, with a spatial scale of pixel-1. Imaging was obtained in the Qa filter (µm, µm) with a standard off-chip 15″ ABBA chop-nod sequence and a chop position angle of E of N. Two image sequences of Leo were taken with 30 ms frametimes and a total on-source integration time of 325 s per image. Prior to and following the Leo observations, HD109511 (K0, Jy) was observed with the same observing sequence to serve as a point spread function and flux density calibrator. The data were reduced with custom-written IDL routines for the MICHELLE data format.
Leo appears unresolved in comparison to the calibrator. At 18.5 µm, the excess for Leo is Jy (Chen et al., 2006) and at 19 AU from the star, the radius inferred by Chen et al. (2006) for the mid-infrared emitting material, we measured an rms dispersion of the background in the Leo images of mJy pixel-1. In §4.4, we will use this limit to constrain the radial extent of the mid-infrared emitting material.
3 Origin of the visibility deficit
In this section we discuss the possible origins of the visibility deficit.
3.1 Companion
A companion anywhere within the 08 (FWHM) field-of-view (FOV) will lower the measured visibility. A companion within the fringe envelope (roughly 25 milliarcsec for these observations) will produce a visibility modulation which is a function of the binary flux ratio and separation and the projected baseline length and position angle. A companion outside this separation range but within the field-of-view will contribute incoherent flux and the visibility decrease will be the same fraction on all baselines. The flux ratio of a companion which would produce the measured visibility is the incoherent fraction listed in Table 4, which corresponds to K = 4.0 0.9 for Leo and K = 4.5 1.4 for Lep. These flux differences would be produced by a main sequence star of spectral type M0 for Leo and M2 for Lep.
Neither star has a known companion within a few arcsec of the primary star. The Washington Double Star (WDS) catalog lists 3 companions for Leo, located from 40″ to 240″ from the primary (far outside the FOV) with V magnitude differences of 6.3 to 13 (Worley & Douglass, 1997). None of these stars could affect the interferometry observations due to the large angular separation. Lep has no listed companions in the WDS. Both objects have been imaged in the mid-infrared (Jayawardhana et al., 2001; Moerchen et al., 2007, §2.4) with no companion detected. In our MICHELLE/GEMINI data, the Q-band magnitude difference for a point source which can be ruled out is 2.5 mag within 05 and 4 mag from 05 to 08. These data are sufficient to detect a possible companion between 05 to 08 around Leo for the derived companion spectral type of M0.
The strongest constraints on close (1″) companions come from the Hipparcos measurements. Leo was observed 64 times over 3.0 yrs with final positional uncertainties of 0.99 mas (RA) and 0.52 mas (dec), and Lep was observed 117 times over 3.1 yrs with uncertainties of 0.51 mas (RA) and 0.41 mas (dec) (Perryman & ESA, 1997). As neither source was detected to have any astrometric motion by Hipparcos, these uncertainties can be used to place limits on any stellar companions. Using the secondary stellar types inferred from the flux ratios, the companion stellar masses would be approximately 0.5 M⊙ for Leo and 0.4 M⊙ for Lep. As the astrometric signature increases with orbital distance, the astrometric uncertainty from the Hipparcos data sets a lower limit to the excluded periods, while the sampling duration sets the limit for longer-period companions. To estimate the shortest period companion which the Hipparcos data could detect, we assumed a mass for each primary of 2.0 M⊙ and quadratically combined the positional uncertainties to obtain astrometric uncertainties of 1.12 mas for Leo and 0.65 mas for Lep. Setting a threshold of 5 to account for the uneven time sampling, the minimum detectable separations are 0.25 AU ( Leo) and 0.34 AU ( Lep), which correspond to periods of 32 days and 51 days respectively.
The detection of longer-period companions is limited by the overall time span of the Hipparcos data. The orbital period and astrometric signature of a companion located at the edge of the FOV would be 5.5 yrs and 250 mas for Leo and 14.5 yrs and 200 mas for Lep. For Leo, the Hipparcos data samples half a period and would be sufficient to detect such a companion. For Lep, the Hipparcos data would sample 20% of the orbital period. For a circular orbit, the deviation of this arc from a best-fit straight line would be 12 mas, detectable with the 0.65 mas uncertainty, but detecting some phases of an elliptical orbit would be more difficult. A very long period companion with the relevant magnitude difference could have escaped detection if the orbit is inclined on the sky such that companion is currently too close to the primary (within 05) for detection by imaging. One probe of such a very long period orbit is the proper motion as a function of time. Gontcharov et al. (2001) combined proper motion data from ground-based catalogs starting in the 1930’s with the Hipparcos data. For Leo and Lep, the combined proper motions were within the uncertainties of the Hipparcos proper motions, and both stars were classified as having no companions within 10″.
Any companion closer than the short-period limit derived above would produce a substantial radial velocity signature. Using the inclination angles derived in §3.2, a companion at the short period limits above would produce a radial velocity of 8 km/sec for Leo and 12 km/sec for Lep. Galland et al. (2005) made measurements of Leo with an uncertainty of 137 m/s, more than sufficient to detection such a large signature, however, the time sampling covered only a few hours and is not sufficient to rule out companion periods of tens of days. Observations of Lep (Grenier et al., 1999, e.g.) have also been made with sufficient precision, but not sufficient time sampling to find a companion with a period of a many days.
In summary, neither target star has a known companion within the CHARA FOV and Hipparcos measurements rule out companions with periods from tens of days to several years. A very close companion (periods less than tens of days, separations less than 0.35 AU) can not be ruled out in either case, but would produce an easily detectable ( 5 km/sec) radial velocity signature. Although we can not definitively rule out a companion as the source of the flux decrement, it is unlikely given the above constraints on period and magnitude difference. A less massive companion would produce a smaller flux decrement, which would require another flux component in the system. Given the small phase space remaining for an undetected companion and the fact that the two mid-infrared excess sources ( Leo and Lep) have a near-infrared visibility decrement, while Leo with no mid-infrared excess does not, we proceed with the hypothesis that the flux decrement does not arise from a companion.
3.2 Stellar rotational oblateness
Our analysis of the visibility deficit on the short baseline relies on knowledge of the stellar size from the longer baselines. If the star is oblate due to rotation, the predicted size on the short baseline may be incorrect as the short and long baselines are nearly orthogonal (Table 3). We can calculate the maximum possible effect by assuming the short stellar axis is aligned with the longer baseline, which would place the longer axis along the short baseline, producing lower visibilities. We calculate the ratio of stellar radii, from
| (3) |
where and are the polar and equatorial radii, is the equatorial velocity, is the gravitational constant and is the stellar mass (Domiciano de Souza et al., 2002). For the most conservative calculation, we take to be the maximum equatorial velocity inferred by Royer et al. (2007) of a survey of A stars, which are grouped by sub-class. These velocities are 300 km sec-1 for Leo and Lep and 280 km sec-1 for Leo. The resulting oblateness is corrected for viewing angle by deriving from the measured and the assumed and approximating the stellar shape as an ellipsoid (Table 6). The observed stellar radii ratio is then given by
| (4) |
Starting with the derived stellar size on the long baseline (, see Table 4), we calculated the V2 that would be measured on the short baseline (V). We then applied the observed oblateness factor, to find the maximum possible angular diameter, , and recalculated the V2 for the short baseline (V. Because these angular sizes are at best marginally resolved on the short baseline, the change in visibility is less than 1% in all cases, even if the apparent angular size changes by 20%, as predicted for Lep. For comparison, we also list the short baseline size, from Table 4. The measured visibility on the short baseline, V is significantly lower than either V or V for both Leo and Lep but not for the check star Leo and thus stellar oblateness can not account for the measured visibility deficit. We note that if rotational axis of the star is aligned such that the short stellar axis is along the short baseline, then the true visibility decrement is actually slightly larger than measured.
As these stars are rotating rapidly, they are also subject to gravity darkening, which produces a decrease in the effective temperature from the pole to the equator. Since the limb-darkening depends on the effective temperature, this effect is also linked to the apparent oblateness. However, this effect is very small compared to the oblateness derived above. Using the effective temperature difference found by Aufdenberg et al. (2006) for Vega, an A0 star, of 2250 K, the limb-darkenening correction for the pole is 0.3% larger than correction at the equator. This factor goes against the rotational oblateness which makes the equatorial radius larger and even with the factor of 2.5 for a fast rotating star, is insufficient to explain the ratios between diameters fit to the long and short baselines of 1.72 0.23 for Leo and 2.9 1.0 for Lep.
| Leo | Leo | Lep | |
| (km sec-1) | 110 | 173 | 245 |
| assumed (km sec-1) | 300 | 280 | 300 |
| i (deg) | 21.5 | 38.1 | 54.7 |
| Req (R⊙) | 1.54 | 2.14 | 1.5 |
| XR | 0.74 | 0.70 | 0.74 |
| Xobs | 0.95 | 0.84 | 0.80 |
| (mas) (Table 4) | 1.3320.009 | 1.1490.012 | 0.690.09 |
| (mas) | 1.4010.009 | 1.3680.014 | 0.8260.11 |
| 2.289 0.31 | 0.0 1.17 | 2.0 0.65 | |
| V2 on short baseline: | |||
| V | 0.9760.0003 | 0.9810.0004 | 0.9960.001 |
| V | 0.9730.0003 | 0.9730.0006 | 0.9940.002 |
| V | 0.9380.015 | 1.001 0.015 | 0.966 0.013 |
3.3 Emission and scattering from dust
Dust grains within the field of view will produce a near-infrared excess through thermal emission and scattering. We assume that there is no gas in these debris disks and therefore the inner radial limit for the debris disk is the dust sublimation radius. For a sublimation temperature of 1600 K and assuming large grains in thermal equilibrium emitting as blackbodies, the sublimation radius is 0.12 AU for Leo and 0.14 AU for Lep. The 2 m emission will be maximized for dust at the sublimation temperature, so a lower limit to the excess luminosity can be estimated following Bryden et al. (2006)
| (5) |
where and are the Planck and Boltzmann constants. For a temperature of 1600 K, the fractional dust luminosity is for Leo and for Lep. For comparison, Chen et al. (2006) calculated mid-infrared dust luminosities of and for Leo and Lep respectively. However, the much larger near-infrared luminosity does not require substantially more mass than implied by the mid-infrared excess since, as the fractional dust luminosity represents the fraction of the star as seen by the dust, the calculated fractional luminosities are highly sensitive to the dust location. An estimate of the minimum mass of near-infrared emitting grains can be calculated using the fractional luminosity and assuming efficiently emitting grains (Jura et al., 1995),
| (6) |
where is the density, is the grain radius and is the distance from the star. A minimum mass can be calculated by using the values calculated above for small dust grains located near the sublimation radius. For a grain radius of m, at the dust sublimation radius and gm cm-3, the minimum mass of the near-infrared emitting material is M⊕ for Leo and M⊕ for Lep. Chen et al. (2006) derived a mass for the small grains in the mid-infrared producing material of for Leo and for Lep. So although the near-infrared excess represents a higher fractional dust luminosity, this can be produced by a much smaller mass than the mid-infrared ring.
A ring of hot dust near the sublimation radius is not incompatible with the incoherent flux model fit in §2.3, as the sublimation radius is large enough to be resolved on even the short baseline. Given the relative uncertainty in the incoherent flux component fit, a component with V would fit within the uncertainty. For Leo, the sublimation radius corresponds to 11 mas and a ring of any width at this radius has a V on all baselines in our observations. For Lep, the sublimation radius is at 7 mas and any ring wider than 1 mas (0.02 AU) produces V on all baselines. If the inclination angles are close to the values inferred in Table 3.2, these approximations are sufficient. Thus, thermal emission from hot dust near the sublimation radius could produce the measured visibility deficit.
At larger angular scales than have been investigated with the interferometer , debris disks are often detected in scattered light at optical and near-infrared wavelengths (e.g., AU Mic and Fomalhaut; Kalas, Liu, & Matthews, 2004; Kalas, Graham, & Clampin, 2005) and scattering from within the field of view of the interferometer ( 08) could also produce the observed visibility deficit. Scattering in the near-infrared will dominate emission for grains at several hundred degrees, depending on the grain size and composition. To investigate the scattering from warm dust, we used the debris disk simulator111http://aida28.mpia-hd.mpg.de/swolf/dds/ described by Wolf (2006) which calculates the thermal emission and scattering given the dust size, composition and distribution. For example, small grains uniformly distributed from 1.0 to 4.6 AU (the Leo FOV radius) will produce the observed near-infrared excess given a total mass of small grains of M⊕, depending on the exact size and composition. This is more than 1000 times larger than the minimum mass needed to produce the excess from hot grain emission.
As there is no known evidence for a companion, we contend that thermal emission and scattering from dust grains is the most likely origin of the near-infrared excess. This is also consistent with our finding that the two sources with a measured visibility deficit have mid-infrared excess emission while the control star, which has no known excess does not have a visibility deficit. In the next section, we explore the constraints on these grains and discuss possible mechanisms for their origin.
4 Dust distribution and small grain origin
4.1 Dust grain sizes
Both Leo and Lep have a substantial mid-infrared excess which has a characteristic temperature much lower than dust which would produce a near-infrared thermal excess and is therefore further from the central star. Many authors (see e.g. Dominik & Decin, 2003; Wyatt, 2005, and references therein) have studied the dynamics of debris disks similar to our targets and have found that collisions are dominant over PR drag, i.e grains collide and become smaller before PR drag significantly decreases the size of their orbits. Radiation pressure also plays a role as small grains are subject to removal from the system. However, clearing of small grains may not be absolute. Krivov et al. (2000) modeled the Pic disk, which has a similar spectral type (A6V) and optical depth to the systems discussed here and found that although grains at and below the canonical blowout radius are depleted compared to a purely collisional system, a population of small grains persists in their model. For our target stars, the radiation pressure size limit is 2 m, the PR drag timescale at 1 AU is 1000 yrs for 10 m radius grains and the collisional timescale for these same grains is 80 years (following the formula of Backman & Paresce, 1993).
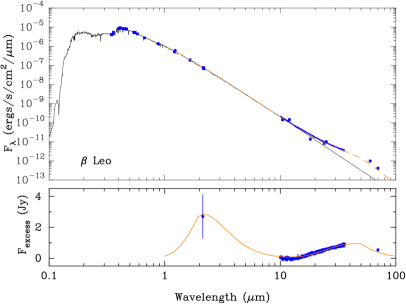
A second constraint on the dust size is the lack of a significant silicate feature in the IRS spectrum for either source (Chen et al., 2006, see Figure 2), although the excess for Leo is not strong enough at 10m to provide as strong a constraint as for Lep, which has excess emission at shorter wavelengths. The lack of a silicate emission feature requires the grain population to have radii larger than a few microns if composed of silicates or to be primarily non-silicate.
4.2 Modeling approach
As the interferometer data provide only an upper limit to the visibility and therefore a lower limit to the size of the near-infrared flux region, the strongest spatial constraint from the interferometry data is that the dust must be within the FOV. However, there is another strong constraint from the measured mid-infrared excess of these sources. The dust producing the near-infrared excess will also produce mid-infrared excess, with the exact flux depending of course on the dust temperature and opacity.
We now begin to explore various specific models for the distribution of dust in these systems, and examine whether these models fit within the constraints provided by the near and mid-infrared data. In all models, we assume optically thin emission for the near and mid-infrared emission. In this section, we consider the relative contributions of scattering and emission to the near and mid-infrared excess flux. For the scattering, we have used the debris disk models of Wolf (2006) to calculate the emission and scattered light flux for various grain radius and radial distributions and two example grain compositions. We have chosen grain compositions which will produce the featureless mid-infrared spectrum seen in the IRS data and have substantially different emissivity ratios between the near and mid-infrared. These two populations are silicate grains with radii between 3 and 10 m and graphite grains with radii from 0.1 to 100 m. In both cases, we use a distribution of grain radii, appropriate for collisionally dominated disks. For these toy models, we concentrated on illustrative cases of dust radial distributions and did not modify the grain radius distribution for the effects of radiation pressure. The possible presence of small grains is discussed in more detail in §4.4. For each case, the disk mass was determined by scaling to match the observed near-infrared excess. These masses are significantly higher than the minimum mass derived in §3.3 as that estimate assumes the flux comes only from small, hot grains which produce much more near-infrared emission for the same mass than a distribution of grain sizes and temperatures can. In Table 7 we present the results for the two grain populations over several radial distributions, listing the ratio of emission to scattering at 2 m, the excess flux at 10 and 24 m and the mass in small grains. All models have radial density profiles of .
| Leo | Lep | ||||||||
| Radial | Grain | Msmallgr | Msmallgr | ||||||
| distribution | type | (Jy) | (Jy) | M⊕ | (Jy) | (Jy) | M⊕ | ||
| Rsub-FOV | silicate | 6.1 | 1.7 | 1.2 | 8.5 | 18 | 16 | ||
| graphite | 8.6 | 5.4 | 2.8 | 10 | 6.7 | 4.6 | |||
| 1.0 AU-FOV | silicate | 0.019 | 231 | 254 | 0.02 | 261 | 400 | ||
| graphite | 4.9 | 2.0 | 1.8 | 4.1 | 32 | 35 | |||
| Rsub-1.0 AU | silicate | 8.6 | 10 | 3.9 | 8.8 | 10.5 | 4.0 | ||
| graphite | 9.2 | 4.7 | 2.0 | 12 | 4.7 | 2.1 | |||
As expected, emission dominates for grains close to the central star (1 AU), while scattering dominates for grains farther away. The mass in small dust grains necessary to produce the near-infrared excess flux is higher for scattering-dominated disks than for emission-dominated disks. The scattering-dominated cases produce too much mid-infrared flux, in some cases by more than an order of magnitude. The 24 m excesses measured by Su et al. (2006) are 0.460.01 Jy for Leo and 0.530.02 Jy for Lep and the 10 m excess from the IRS spectra are 0.0020.004 Jy for Leo and 0.180.01 Jy for Lep from Chen et al. (2006). The emission-dominated disks also produce too much mid-infrared flux, but not by as large a factor. As the models which have substantial near-infrared emission have mid-infrared fluxes close to the observed values, we assume that emission is the primary mechanism for producing near-infrared flux. In the following sections, we will explore other density distributions and models to fit both the near-infrared and mid-infrared excesses in detail.
4.3 Dust grain distributions
For both stars, we first considered the hypothesis that the grains producing the near-infrared excess were generated by collisions between larger bodies in the belt which produces the mid-infrared excess. These grains can then be dragged towards the central star via PR drag and become sufficiently heated to emit at near-infrared wavelengths. For a specific theoretical description of a disk in which grains created in collisions in the planetesimal belt migrate inward, we used the model of Wyatt (2005), who calculated the steady-state optical depth as a function of radius. In this model, the disks are collisionally dominated, but a small fraction of the dust created by collisions in the planetesimal belt migrates inwards due to PR drag and is subject to collisions as it migrates. Assuming a single grain size, Wyatt (2005) found the optical depth as a function of radius to be
| (7) |
where is the optical depth of the planetesimal belt at , the radius of the planetesimal belt and is a parameter balancing collisions and PR drag, which had a value of 2.4 for Leo and 6.7 for Lep. For the collisional lifetime equals the time it takes a grain to migrate to the star. We assume optically thin, blackbody grains distributed with the optical depth given by eq. 7 and starting at the sublimation radius. The value of is iterated until the optical depth within the CHARA FOV produces the observed near-infrared excess. We then calculate how much mid-infrared flux would be produced and compare to the measured mid-infrared excess.
For Leo, the mid-infrared excess spectra is well fit by a grain temperature T 120 K, which implies a distance from the star of 19 AU (Chen et al., 2006), well outside the FOV of our observations (4.6 AU). Applying the model in eq. 7 with AU and assuming an emissivity wavelength dependence of (§4.4) produces a 2/10 m flux ratio of 1.6, while the observed ratio, using our detection and the IRS data of Chen et al. (2006) is . A shallower grain emissivity function with wavelength will produce an even larger discrepancy between this model and the data. Thus, the grains which produce the near-infrared excess can not come from a smoothly distributed population generated by collisions in the mid-infrared belt.
Moerchen et al. (2007) resolved the 18 m emission from Lep and modeled the distribution as arising from two rings with stellar distances from 2-4 and 4-8 AU, which is contained within the CHARA FOV of 8.6 AU. Using a radius of 4 AU in eq. 7 produces a 2/6 m excess of 0.8, while the observed excess from our data and Chen et al. (2006) is 18. Thus this model is not a good fit for Lep either. We note that Moerchen et al. (2007) did not resolve the excess emission from Lep at 10 m and concluded that the dust producing this excess is interior to the resolved 18 m rings. They surmise that the 10 m emitting dust is migrating inward by PR drag from the belts resolved at 18 m.
4.4 Geometric models
To further examine the constraints which the near-infrared and mid-infrared excess place on the dust distribution, we use a geometric model of the dust distribution. The data are compared to the models in a Bayesian approach designed to constrain the range of valid model parameters, rather than finding a single best-fit model. The input data are: 1) the near-infrared excess within the interferometer FOV and the visibility limits for this excess, 2) the IRS data from Chen et al. (2006) and 3) the spectral energy distribution from 2 to 100 m from the literature, including a 70 m Spitzer-MIPS measurement (K. Stapelfeldt, private communication). We have constructed an SED for each star using photometry from SIMBAD in order to determine the excess flux. The stellar template was determined by fitting the optical and near-infrared photometry to a grid of Kurucz-Lejeune models (Lejeune et al, 1997) covering the range of effective temperature and surface gravity values appropriate for the main sequence stellar types of the target stars. Both stars are nearby and have photospheric colors consistent with (Chen et al., 2006).
The basic disk model is an optically thin ring of dust. To simplify the calculations, we consider the dust to be geometrically thin; however, we note that to intercept 1% of the starlight, the dust will need to have a finite vertical height. At a radial distance of 0.1 AU, this corresponds to a height with . Such a vertical height is smaller than a flared primordial disk at this radius (Chiang & Goldreich, 1997, ) and smaller than the value derived for the Pic dust disk at larger (r 15 AU) radii and thus is plausible.
The excess flux ratio between 2.2 m and the shortest IRS wavelength can be used to set a limit on the wavelength dependence of the grain emissivity. For Leo, F(2.2 m)/F(10 m) , implying an emissivity decreasing at least as fast as if the emission is from a hot blackbody. For Lep, F(2.2 m)/F(6 m) 18, implying emissivity proportional to at least for hot dust. As we wish to examine the range of disk physical parameters, including the grain size and composition, which can reproduce the near and mid-infrared excess emission, we adopt a analytic approximation for the grain properties to keep the calculation manageable yet self-consistent. We have therefore chosen a power-law representation of the radiative efficiency , following work on Pic by Backman et al. (1992) and Backman & Paresce (1993). For a given grain radius , the absorption and emission efficiency is roughly constant, , for radiation at wavelengths shorter than a critical wavelength and decreases for wavelengths longer than (Backman & Paresce, 1993). The relation between the grain radius and the critical wavelength depends on the grain composition and shape and varies from for strongly absorbing grains to for weakly absorbing grains (Backman & Paresce, 1993).
We assume that the disk is optically thin to its own radiation, therefore the stellar radiation is the only input. Radiation from the early A spectral types observed here (T K) is dominated by wavelengths m. Our input data are at 2.2 m and longer, therefore we can not constrain the value of the critical wavelength below 2 m. The grain emission efficiency decreases at wavelengths much larger than the grain radius and given our wavelength constraints, we assume that the excess is dominated by grains with a critical wavelength of m and therefore that the absorbing efficiency is essentially constant. The emission efficiency is assumed to follow a power-law such that . This formulation of the efficiency does not account for spectral features, but as neither object has such features, the approximation is appropriate. We investigate two values of : which is appropriate for absorbing dielectrics and amphorous materials such as silicate and roughly matches the silicate population considered in §4.2 and which is appropriate for conductive substances such as pure graphite or crystallines and represents the graphite population in §4.2. We then derived the temperature of the grains as a function of radius from the star, following Backman & Paresce (1993),
| (8) | |||
| (9) |
where L∗ is in L⊙, is in microns and , the distance to the star is in AU. Assuming a power law for the radial distribution, the flux in an ring is then (Koerner et al., 1998)
| (11) |
where is the optical depth and is the distance to the star from earth. The input parameters to our models are the inner disk radius , the disk radial extent , the optical depth, , the optical depth radial exponent, and the grain characteristic wavelength . Unless the grain composition varies with disk radius, the values of and are degenerate. We set = 1, thus here represents the emission optical depth and is only equal to the geometric optical depth if the grains have an albedo of 0.
For Leo and Lep we were unable to fit both the near-infrared and mid-infrared excess with a single ring of dust. This is not surprising as the 2 m excess is higher than the excess flux at the shortest IRS wavelengths, requiring a decrease in emissivity at some intermediate radii. The next level of sophistication is to add a second ring of dust, with each ring following the physical description given above.
For each object, a grid of millions of models was calculated and compared to the input data. The results for each object are a range of parameters consistent with the data, given all possible values for the other parameters. We found that some parameters were not well constrained by the data and others were degenerate, such as the optical depth and the disk radial extent. We initially assumed that the inner and outer rings had the same radial power-law and the same characteristic grain size, . We were unable to fit both the near-infrared and mid-infrared data with a two ring model if the characteristic grain size was the same in each ring. Fitting for two values of and within a single grid is computationally very expensive, so we fit just the IRS data to a single ring to constrain the values of and for the outer ring. For Leo, the value of is not well constrained, and we assume a value of -3/2 as predicted for collisionally dominated disks (e.g. Kenyon & Bromley, 2005).
For each star, we tried to match all the input data with the emissivity power-laws of or 2. For Leo, the data can not be matched with , not surprising given the flux ratio between 2 and 10 m discussed above. For Lep, models with can match both the near-infrared and mid-infrared data, but these models require that the outer ring extend over 20 AU, which is much larger than the extent derived by Moerchen et al. (2007) in their imaging. We therefore place a prior constraint of AU. With this constraint, only models provide adequate fits.
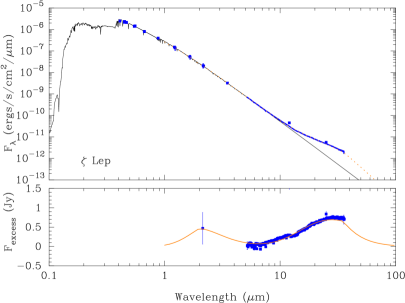
The range of parameter values which falls within a 67% probability range (corresponding to for a normal distribution) is given for each target in Table 8. An example model for each object is shown with the SED and IRS data in Figure 2. For Leo, the outer ring values of 7.5-15 AU are smaller than the 19 AU found by Chen et al. (2006) due to the different temperature law we used, but the inner and outer ring are clearly separated by a gap of several AU. For Lep, the inner and outer ring are at similar radii ( few AU) and although the inner ring must have significantly higher opacity to produce the near-infrared flux, it is possible to fit the data with models in which the inner and outer ring overlap. Interestingly, Moerchen et al. (2007) also required a higher flux ratio in their inner ring (2-4 AU) as compared to the outer ring (4-8 AU).
The optical depth and radial extent of the inner dust ring in these models are degenerate parameters as the constraining data are the 2 m flux and the lack of strong mid-infrared flux. We have deliberately limited these models to be optically thin, but we note that the near-infrared flux could also arise from a ring with a very small radial extent which was vertically optically thick. The strongest test of the radial extent for the inner ring would be to resolve it interferometrically, which requires observations on shorter baselines than the data presented here. For example, a ring around Leo at 0.12 AU with a radial extent , would have V at 2 m on baselines shorter than 13 meters and V on the 30 meter baseline we used. High precision measurements would still be necessary given the small flux contribution from the ring.
The relationship between the characteristic grain size and the physical grain radius depends on the grain composition and the distribution of sizes. One specific example of a grain material which could be approximated by our emissivity model is graphite, which is strongly absorbing for grain radii 0.1 m (Draine & Lee, 1984). To compute the physical grain size for graphite we take . The other factor is the distribution of grain radii. Following Backman et al. (1992), one method of tying to the physical radii is to find the radius which divides the grain population into two equal halves of surface area. For a distribution of , this radius is 4 times the minimum radius, . Putting these two factors together, we have . For our upper limit on the characteristic size in the inner ring m, this corresponds to m.
Grains that small are below the nominal radiation blowout radius for these stars. However, radiation pressure may not completely clear all the grains from debris disks like these. Krivov et al. (2000) modeled the Pic debris disk, which has a similar spectral type (A6 V) and mid-infrared excess to our targets. In their model, small grains are constantly created through collisions, particularly between particles on stable orbits and those being blown out of the system. They found that grains smaller than a few microns were depleted compared to the distribution of a collisionally dominated disk, but that a significant population remained. The resulting overall grain population could be approximated by a more shallow slope in the distribution, for example, fitting the resulting grain radii distribution with a single power-law between 0.1 and 100 m, results in . Thus the inner rings may contain grains smaller than 1 m, the nominal blowout radius.
Our model for both targets includes a much larger characteristic grain size in the outer ring, m, which corresponds to a minimum size of m for graphite grains. This is roughly the radiation blowout size. The conclusion from our models that the inner ring contains substantially smaller grain sizes than the outer ring should be confirmed with more detailed grain models, but as discussed more below, may suggest either different origins for the grains or different dynamics.
The dust sublimation temperature of 1600 K used in these models may be plausible for amorphous grains such as those represented by the model, but is higher than generally used for crystalline grains (e.g. 1250 K; Bauer et al., 1997) as represented by the model. A sublimation temperature of 1250 K results in much poorer fits to the data. At these high temperatures, micron-sized grain lifetimes will be short; for example, Lamy (1974) found lifetimes of less than 104 seconds for 1 m radius grains at 1500-1600 K. However, once the grains are very small, the grain temperature and lifetime may increase. In a study of grains with radii m heated through interactions with a single photon, Guhathakurta & Draine (1989) found a broad distribution of temperatures with excursions as high as 2800 K for graphite grains and 2050 K for silicate grains. Guhathakurta & Draine (1989) calculated the sublimation rates for these grains including a correction derived from fluctuation theory for finite systems which decreases the sublimation rate by . The resulting lifetimes for grains with radii from several to tens of Angstroms are yrs.
The combination of sublimation, radiation pressure and collisions will result in a grain size distribution substantially more complicated than the simple power-law often used in debris disks and assumed here. The result of all these processes may be a population of small hot grains which is constantly created through collisions and depleted through sublimation and radiation pressure. Alternatively, the presence of a significant number of small grains may imply origin in a transient event, as discussed in the next section. Our formulation of the grain temperature and emissivity efficiency does not properly represent very small grains and more detailed models than those considered here are necessary to determine if the temperatures and lifetimes of sub-micron sized grains are consistent with a stable grain population which could produce near-infrared flux observed here. Emission from small, hot grains has been invoked to fit the spectral energy distributions of debris disks (Sylvester et al., 1997) and the much more massive primordial disks of Herbig Ae/Be stars (Natta et al., 1993).
In the models presented here, the mid-infrared excess for Leo is produced by dust grains located AU from the star. At the pixel scale of our MICHELLE/Gemini data ( pixel-1, §2.4) and the distance of Leo ( pc), the mid-infrared dust emission is located of 8 pixels from the central core of the stellar image (FWHM pixels); thus, the Gemini observations of Leo should easily resolve the mid-infrared emission if the surface brightness is high enough. However, the Gemini observations show no evidence of detecting the outer mid-infrared emission. For a 5 AU ring width, the dust emission is spread out among 400 pixels, for a surface brightness of 0.75 mJy pixel-1. Given the measured dispersion of mJy pixel-1, the signal-to-noise ratio is then only (per pixel). Thus, the non-detection of the mid-infrared excess of Leo is fully consistent with our dust distribution model, even though the spatial resolution was more than sufficient to resolve the emission.
| Model parameter | Leo | Lep |
|---|---|---|
| Inner ring | ||
| (AU) | Rsub - 0.2 | Rsub - 0.2 |
| (AU) | 0.5 | 0.15 |
| 2-20 | 1-5 | |
| no constraint | -1 | |
| (m) | 2 | 2 |
| Outer ring | ||
| (AU) | 7 - 15 | 0.5 - 1.2 |
| (AU) | 3 - 10 | 11 - 15 |
| 2-3 | ||
| no constraint | -0.2 - 0.1 | |
| (m) | 35 - 70 | 30 |
| 2 | 2 |
5 Hot dust in debris disks
Photometric and spectroscopic surveys of debris disks have revealed other sources with dust within several AU of the star and the frequency of these systems is a strong function of the age of the system. For FGK stars the frequency of debris disks emitting at wavelengths shorter than 30m is 9-19% at ages less than 300 Myr, but less than 2-4% for stars older than 1 Gyr (Beichman et al., 2006; Meyer et al., 2008). For A stars, a similar trend is seen, although the excess rate for young A stars ( 190 Myr) is even higher at 33% (Su et al., 2006). The age estimates for our targets stars ( Leo: 50-380 Myr; Lep: 180-490 Myr; Lachaume et al. (1999); Chen et al. (2006)) place them in or near the age brackets for the higher-percentage hot dust population. Some theoretical models of planet formation predict higher planet formation rates for A stars, as compared to solar mass stars (Kennedy & Kenyon, 2008). Thus, detection of hot dust in our targets systems is not necessarily unexpected.
Other debris disks have near-infrared excesses detected through interferometry. Including this work, nine A and early F stars have been observed and, not including our tentative detection of Lep, three (Vega, Aql and Leo) were detected (Ciardi et al., 2001; Absil et al., 2006; di Folco et al., 2007; Absil et al., 2008) at the 1-2% excess level. Based on limited radial velocity data, Absil et al. (2008) suggest that their detected excess toward Aql may arise from a close M star companion and based on a reanalysis of the Spitzer data, they also find that there is no mid-infrared excess from this source. Only one lower mass star, Ceti, has an observed near-infrared excess (di Folco et al., 2007), although the observations of FGK stars are currently limited by the sensitivity of the instruments. The near-infrared flux levels of the detected sources are all at the few percent level, although this may represent the brightest examples of a population of disks with hot grains, as the limits on the non-detected sources are not substantially lower, e.g. di Folco et al. (2007) set an upper limit of 0.6% for the near-infrared emission from Eri.
The dust distribution inferred for Vega by Absil et al. (2006) is somewhat similar to Leo in that they modeled the inner dust with an inner radius of 0.17 to 0.3 AU with a very steep () radial power law, which is similar to a ring. The inner dust mass inferred was M⊕ with a dust luminosity of L⊙.
Although the number of debris disk stars surveyed is still relatively small, there are three detections (one marginally significant) of near-infrared excess for which a population of hot dust is the most likely explanation, and here we consider if they represent a stable dust population produced by collisions of larger bodies orbiting close to the star or are the result of a transient event. The production of small, hot dust grains from the break-up of a comet or asteroid has been invoked in other cases, such as HD 69830 (Beichman et al., 2005). Using a density of 3 gm cm-3, a mass of M⊕ can be generated from the break-up of a single body with a 10 km radius.
To evaluate the likelihood of so many transient events in A stars, we used the model of Wyatt et al. (2007) for the steady-state evolution of collision-dominated debris disks, in which they derive a maximum possible dust luminosity as a function of age. In examining the properties of 46 known A-star debris disks, they found only 4 stars with a dust luminosity significantly higher than this maximum. A dust luminosity well above the steady-state maximum suggests either a transient origin for the dust or unusual properties for the planetesimal belt. The mid-infrared excess of Lep is above this threshold, while the mid-infrared excess of Leo is below. We use the same calculation to evaluate the inner dust. For simplicity, we take the maximum steady-state flux () derived by Wyatt et al. (2007) for the outer planetesimal ring and scale that value to the inner ring radius using their derived relationship . This ignores any difference in grain properties between the disks but is acceptable for an order of magnitude calculation. For both Leo and Lep the near-infrared dust luminosity () compared to the maximum allowed is , obviously above the threshold of 10 set by Wyatt et al. (2007) for anomalous systems. We also calculated this quantity for Vega, which for the inner dust also has a value of . In this model of collisionally-dominated disks, all three of these objects are orders of magnitude higher than the expected steady-state flux, suggesting a transient event as the most likely origin. The finding from our simple dust model of small dust within the inner ring, but not the outer, mid-infrared producing ring, may also favor a transient origin for the near-infrared producing dust given the issues of dust lifetime to radiation pressure and sublimation. A recent planetesimal collision or comet passing would drastically change the dust radii distribution and dynamics.
Although more objects should be sampled to come to a stronger conclusion, it is suggestive that the near-infrared excess in these objects arises from a recent collision or cometary passing event. The near-infrared excess is an ideal probe of hot, small grains in these systems, as dust much closer to the star will sublimate. An observational test of the hypothesis that the near-infrared flux arises from emission from grains near the sublimation radius is to make observations at other wavelengths, particularly H (1.6 m) and L (3.5m) bands, to probe the wavelength dependence of the excess. If the flux is dominated by emission, the peak will be near K and L, while if it is scattering, the excess at H will be much higher and the excess at L much lower.
6 Conclusions
We have presented near-infrared interferometry observations of two A stars, Leo and Lep, which were known to have mid-infrared excess emission from a debris disk. A near-infrared excess of 1-2% was detected, although the detection for Lep should be confirmed. The interferometer observations do not spatially resolve the emission distribution, but place a maximum on the radial extent through the field of view, and in conjunction with the spectral energy distribution, the spatial distribution of dust can be constrained. Both objects can be modeled as having a thin ring of dust grains at or near the sublimation radius in addition to the previously known mid-infrared emitting belt.
Although the models presented here are not a unique fit to the data, particularly with respect to the grain population, we can place strong constraints on the dust composition and morphology. Both objects require small, non-silicate grains to be consistent with the near-infrared and mid-infrared excesses. The minimum grain size required (m) is an order of magnitude smaller than the nominal radiation pressure blowout radius for spherical grains and requires a high production rate of small grains if some depletion does occur due to radiation pressure and sublimation. For Leo, the near-infrared excess can not arise from dust generated by the planetesimal belt which produces the mid-infrared excess. For Lep, the most likely model using simple geometric distributions is also two separate rings, but it is possible that the larger bodies producing the inner dust may form a continuous extent with the mid-infrared planetesimal belt, although not with a simple, single power-law radial distribution. The luminosity of the inner dust is exceptionally high in comparison to steady-state evolutionary models of collisionally-dominated debris disks, suggesting origin in a transient event, such as the break-up of a comet or asteroid near the star.
These observations are limited by the sensitivity of the current instruments, but with improvements in near-infrared interferometry and other techniques, such as nulling interferometry and adaptive optics with coronagraphy, it should be possible to survey many more stars to determine the population with hot dust.
References
- Absil et al. (2006) Absil, O., et al. 2006, A&A, 452, 237
- Absil et al. (2008) Absil, O. et al. 2008, A&A, 487, 1041
- Artymowicz (2000) Artymowicz, P. 2000, Space Science Reviews, 92, 69
- Aufdenberg et al. (2006) Aufdenberg, J. P., et al. 2006, ApJ, 645, 664
- Aumann & Probst (1991) Aumann, H. H., & Probst, R. G. 1991, ApJ, 368, 264
- Backman & Paresce (1993) Backman, D. E., & Paresce, F. 1993, Protostars and Planets III, 1253
- Backman et al. (1992) Backman, D. E., Witteborn, F. C., & Gillett, F. C. 1992, ApJ, 385, 670
- Bauer et al. (1997) Bauer, I., Finocchi, F., Duschl, W. J., Gail, H.-P., & Schloeder, J. P. 1997, A&A, 317, 273
- Beichman et al. (2006) Beichman, C. A., et al. 2006, ApJ, 639, 1166
- Beichman et al. (2005) Beichman, C. A., et al. 2005, ApJ, 626, 1061
- ten Brummelaar et al. (2005) ten Brummelaar, T. A., et al. 2005, ApJ, 628, 453
- Bryden et al. (2006) Bryden, G., et al. 2006, ApJ, 636, 1098
- Chen et al. (2006) Chen, C. H., et al. 2006, ApJS, 166, 351
- Chen & Jura (2001) Chen, C. H., & Jura, M. 2001, ApJ, 560, L171
- Chiang & Goldreich (1997) Chiang, E. I., & Goldreich, P. 1997, ApJ, 490, 368
- Ciardi et al. (2001) Ciardi, D. R., van Belle, G. T., Akeson, R. L., Thompson, R. R., Lada, E. A., & Howell, S. B. 2001, ApJ, 559, 1147
- Claret et al. (1995) Claret, A., Diaz-Cordoves, J., & Gimenez, A. 1995, A&AS, 114, 247
- Coude Du Foresto et al. (1997) Coude Du Foresto, V., Ridgway, S., & Mariotti, J.-M. 1997, A&AS, 121, 379
- Coude du Foresto et al. (2003) Coude du Foresto, V., et al. 2003, Proc. SPIE, 4838, 280
- di Folco et al. (2007) di Folco, E., et al. 2007, A&A, 475, 243
- di Folco et al. (2004) Di Folco, E., Thévenin, F., Kervella, P., Domiciano de Souza, A., Coudé du Foresto, V., Ségransan, D., & Morel, P. 2004, A&A, 426, 601
- Domiciano de Souza et al. (2002) Domiciano de Souza, A., Vakili, F., Jankov, S., Janot-Pacheco, E., & Abe, L. 2002, A&A, 393, 345
- Dominik & Decin (2003) Dominik, C., & Decin, G. 2003, ApJ, 598, 626
- Draine & Lee (1984) Draine, B. T., & Lee, H. M. 1984, ApJ, 285, 89
- Galland et al. (2005) Galland, F., Lagrange, A.-M., Udry, S., Chelli, A., Pepe, F., Queloz, D., Beuzit, J.-L., & Mayor, M. 2005, A&A, 443, 337
- Glasse & Atad-Ettedgui (1993) Glasse, A. C., et al. 1997, Proc. SPIE, 2871, 1197
- Gontcharov et al. (2001) Gontcharov, G. A., Andronova, A. A., Titov, O. A., & Kornilov, E. V. 2001, A&A, 365, 222
- Grenier et al. (1999) Grenier, S., Burnage, R., Faraggiana, R., Gerbaldi, M., Delmas, F., Gómez, A. E., Sabas, V., & Sharif, L. 1999, A&AS, 135, 503
- Guhathakurta & Draine (1989) Guhathakurta, P., & Draine, B. T. 1989, ApJ, 345, 230
- Hanbury Brown et al. (1974) Hanbury Brown, R., Davis, J., & Allen, L. R. 1974, MNRAS, 167, 121
- Jayawardhana et al. (2001) Jayawardhana, R., Fisher, R. S., Telesco, C. M., Piña, R. K., Barrado y Navascués, D., Hartmann, L. W., & Fazio, G. G. 2001, AJ, 122, 2047
- Jura et al. (1995) Jura, M., Ghez, A. M., White, R. J., McCarthy, D. W., Smith, R. C., & Martin, P. G. 1995, ApJ, 445, 451
- Kalas, Liu, & Matthews (2004) Kala s, P., Liu, M. C., & Matthews, B. C. 2004, Science, 303, 1990
- Kalas, Graham, & Clampin (2005) Kalas, P., Graham, J. R.& Clampin, M. 2005, Nature, 435, 1067
- Kennedy & Kenyon (2008) Kennedy, G. M., & Kenyon, S. J. 2008, ApJ, 673, 502
- Kenyon & Bromley (2005) Kenyon, S. J., & Bromley, B. C. 2005, AJ, 130, 269
- Kervella et al. (2004a) Kervella, P., Ségransan, D., & Coudé du Foresto, V. 2004, A&A, 425, 1161
- Kervella et al. (2004b) Kervella, P., Thévenin, F., Di Folco, E., & Ségransan, D. 2004, A&A, 426, 297
- Koerner et al. (1998) Koerner, D. W., Ressler, M. E., Werner, M. W., & Backman, D. E. 1998, ApJ, 503, L83
- Krivov et al. (2000) Krivov, A. V., Mann, I., & Krivova, N. A. 2000, A&A, 362, 1127
- Lachaume et al. (1999) Lachaume, R., Dominik, C., Lanz, T., & Habing, H. J. 1999, A&A, 348, 897
- Lamy (1974) Lamy, P. L. 1974, A&A, 35, 197
- Laureijs et al. (2002) Laureijs, R. J., Jourdain de Muizon, M., Leech, K., Siebenmorgen, R., Dominik, C., Habing, H. J., Trams, N., & Kessler, M. F. 2002, A&A, 387, 285
- Lejeune et al (1997) Lejeune, T. et al 1997, A&AS 125, 229
- Mérand et al. (2005) Mérand, A., Bordé, P., & Coudé Du Foresto, V. 2005, A&A, 433, 1155
- Mérand et al. (2006) Mérand, A., Coudé du Foresto, V., Kellerer, A., ten Brummelaar, T., Reess, J.-M., & Ziegler, D. 2006, Proc. SPIE, 6268, 46
- Meyer et al. (2008) Meyer, M.R., et al., 2008, ApJ, in press
- Meyer et al. (2007) Meyer, M. R., Backman, D. E., Weinberger, A. J., & Wyatt, M. C. 2007, Protostars and Planets V, 573
- Moerchen et al. (2007) Moerchen, M. M., Telesco, C. M., Packham, C., & Kehoe, T. J. J. 2007, ApJ, 655, L109
- Natta et al. (1993) Natta, A., Prusti, T., & Krugel, E. 1993, A&A, 275, 527
- Perryman & ESA (1997) Perryman, M. A. C., & ESA 1997, ESA Special Publication, 1200,
- Rieke et al. (2005) Rieke, G. H., et al. 2005, ApJ, 620, 1010
- Royer et al. (2007) Royer, F., Zorec, J., & Gómez, A. E. 2007, A&A, 463, 671
- Su et al. (2006) Su, K. Y. L., et al. 2006, ApJ, 653, 675
- Sylvester et al. (1997) Sylvester, R. J., Skinner, C. J., & Barlow, M. J. 1997, MNRAS, 289, 831
- van Leeuwen (2008) van Leeuwen, F. 2008, VizieR Online Data Catalog, 1311
- Wolf (2006) Wolf, S. 2006, Astrophysics Software Database, 5
- Worley & Douglass (1997) Worley, C. E., & Douglass, G. G. 1997, A&AS, 125, 523
- Wyatt et al. (2007) Wyatt, M. C., Smith, R., Greaves, J. S., Beichman, C. A., Bryden, G., & Lisse, C. M. 2007, ApJ, 658, 569
- Wyatt (2005) Wyatt, M. C. 2005, A&A, 433, 1007