The Arecibo Legacy Fast ALFA Survey VII: A Neutral Hydrogen Cloud Complex in the Virgo Cluster
Abstract
We present observations of an HI cloud complex most likely located in the Virgo galaxy cluster, first reported by Kent et al. (2007). The complex consists of five clouds, detected in the data set of the ALFALFA extragalactic HI survey at Arecibo. The clouds have radial velocities between 480 and 610 . At the Virgo cluster distance, they are spread over a projected span of 170 kpc and have HI masses ranging from 0.48 to 1.7 . The overall HI mass of the complex is . The clouds’ velocity widths vary between 50 and 250 . New results of follow-up aperture synthesis observations conducted with the Very Large Array are also presented, which yield a higher resolution view of two of the clouds in the complex. These two resolved clouds show no evidence of symmetry in the gas distribution or of any ordered motions. The possibility that the complex is a group of primordial objects, embedded in their own dark matter halo is thought to be unlikely. Scenarios in which the clouds have been removed from the disk of a galaxy traveling at high speed through the intracluster medium are considered. The most likely among those is thought to be one where the clouds were separated from NGC 4445 at a time Gyr ago. The orbital velocity of the clouds and the putative parent galaxy would now be seen at a relatively large angle with respect to the line of sight.
1 Introduction
The study of the cold gas content in extragalactic systems plays an important role in understanding their formation and evolution. Not only does the gas content reveal information on the star formation potential of a galaxy, it can also help trace the dynamic history and response to the surrounding environment, whether it inhabits a dense cluster or an unpopulated field. For example, the fingerprint of galactic collisions and ram pressure stripping effects can be seen in the form of detached gaseous fragments and clumps. The 21 cm spectral line of neutral hydrogen serves as an important tool for measuring the cool, neutral gas component of galaxies, as well as a redshift indicator and kinematical probe. The HI line can also be detected in low mass systems with little or no stellar emission. Blind HI surveys thus yield samples which include a population “underappreciated” in optical surveys.
A number of intergalactic HI clouds have been reported in the literature, some in pairs and groups or in the vicinity of large disk galaxies (e.g. Schneider et al. 1983; Sancisi et al. 1987; Kilborn et al. 2000; Ryder et al. 2001), others the result of disturbances from interactions within a cluster (Minchin et al. 2005, 2007; Oosterloo & van Gorkom 2005; Haynes et al. 2007). The serendipitous detection of HI1225+01 (Giovanelli & Haynes 1989; Chengalur et al. 1995) revealed a binary structure, with the NE component found to be associated with a dwarf galaxy, while the SW component has failed to yield any optical light down to a surface magnitude limit of 27 mag arcsec-2 (Salzer et al. 1991). A recently reported HI feature, VirgoHI21, was detected north of the spiral galaxy NGC 4254 (Minchin et al. 2005) and interpreted as a fairly massive ”dark galaxy”. ALFALFA survey data, which provides full coverage of the region, indicate that VirgoHI21 is not an isolated dark galaxy, but rather a tidal tail of NGC 4254 resulting from the high speed encounter of that galaxy with a now distant interloper (Haynes et al. 2007; Duc & Bournaud 2008).
A galaxy traveling through a cluster can be affected by a variety of mechanisms, the most commonly invoked being ram pressure stripping. The study of HI deficiency in Virgo spirals was pioneered by Davies & Lewis (1973), with the first reliably measured deficiencies reported by Chamaraux, Balkowski & Gerard (1980). Giovanelli & Haynes (1983) showed that HI deficient galaxies in Virgo had truncated HI disks. These results were extended to other clusters (Giovanelli & Haynes 1985; Haynes & Giovanelli 1986; Haynes, Giovanelli & Chincarini 1984) and mapped with higher resolution (Cayatte et al. 1990; Chung et al. 2007). Oosterloo & van Gorkhom (2005) recently reported the discovery of a HI cloud in the vicinity of the Virgo spiral NGC 4388 with a HI mass of , resolved into distinct clumps. They show a clear connection to NGC 4388. It has also been shown that galaxies can be “harassed” by the collective effect of the cluster potential and multiple high speed encounters with other cluster members (e.g. Moore et al. 1996; Mihos et al. 2005). The hot intracluster gas is a hostile environment for the cold material removed from cluster galaxies through these processes. The interaction remnants represented by the latter are thus transient features. A full census of their number and estimates of longevity can provide insights on the metal enrichment of the intracluster gas.
Virgo is the nearest rich cluster of galaxies, thus providing the best target for the detailed study of many environment driven effects on the evolution of galaxies. With over 1300 cataloged detections (Binggeli et al. 1985), the overdensity associated with the Virgo cluster extends over more than 300 square degrees in the sky, distributed in several subclumps. The largest two clumps are centered around large elliptical galaxies, M87 for the main clump, and M49 for the southern subclump. The morphology–density relation is well established in the cluster, with late type objects thought to be still falling into the cluster, as it dynamically evolves. The dynamically vulnerable, extended HI disks of late type galaxies can be easy victims of the processes discussed above. Optical data bases, such as the Digital Sky Survey (Lasker et al. 1990) and the Sloan Digital Sky Survey (York et al. 2000), provide photometry and targeted spectroscopy of cluster objects, as does the compendium of Virgo galaxies data of GOLDMINE website (http://goldmine.mib.infn.it/ ; Gavazzi et al. 2003). Individual galaxy distances are growing in number thanks to the ACS Virgo Cluster survey, which focuses on early-type galaxies via the surface-brightness fluctuation method (Mei et al. 2007). Targeted HI surveys also have played an important role in the overall characterization of the cluster (see, e.g. GOLDMINE for references).
The HI Parkes All-Sky Survey (HIPASS; Barnes et al. 2001) has mapped 30000 deg2, part of which covers Virgo in the region 12 R.A. and +2 Dec. . HIPASS catalogs available from NED list 125 galaxies in this region. The Arecibo Legacy Fast ALFA Survey (ALFALFA; Giovanelli et al. 2005) is more sensitive and has significantly higher angular and spectral resolution than HIPASS. It is thus providing a much more incisive look into the HI properties of the cluster. While the HI content of many individual spiral galaxies has been mapped in detail with interferometry (Cayatte et al. 1990, 1994; Chung et al. 2007), no survey has covered the Virgo cluster region with the sensitivity and completeness of ALFALFA. It is a primary goal of the ALFALFA survey to study and characterize the local HI Universe, including the Virgo cluster. ALFALFA will provide a fair, well-sampled and homogeneous spectral dataset, covering 7000 deg2 of the high galactic latitude sky out to a redshift of . Approximately 250 deg2 of the Virgo cluster in the range R.A.(J2000) and Dec.(J2000) have been completely surveyed as of late 2007, with catalogs of extracted source parameters already released for publication (Giovanelli et al. 2007; Kent et al. 2008). A key feature of the survey is its sensitivity to low HI mass objects – ALFALFA will provide a complete HI census down to at the Virgo distance. Sampling the low-mass population will be key in determining the HI mass function in the cluster environment, as well as in the field. The ALFALFA dataset in Virgo has already yielded many new interesting results (Kent et al. 2007; Haynes et al. 2007; Koopmann et al. 2008).
In this paper we give a detailed description of a multi-component HI cloud complex in the Virgo cluster region initially reported by Kent et al. (2007). In section 2 we describe the observations and data reduction method within the context of ALFALFA and the cloud detections made with that dataset. In section 3 we detail follow-up observations conducted with the Very Large Array. In section 4 we discuss CO observations of the cloud. Section 5 discusses the environment of the cloud complex. Section 6 discusses possible formation mechanisms for the cloud complex. Section 7 summarizes the results of the paper. Throughout the paper we assume a distance to the Virgo Cluster of =16.7 Mpc, and refer to the heliocentric reference frame for all velocities.
2 Discovery of a HI Cloud Complex
The ALFALFA observing strategy is described in detail by Giovanelli et al. (2005). The data are obtained in a meridian transit drift mode with the Arecibo -band Feed Array (ALFA). Raw scans consist of 14 spectra (7 beams 2 linear polarizations/beam), sampled at a rate of 1 Hz. The spectra span a 100 MHz bandwidth with 4096 channels per polarization, centered at 1385 MHz. The resulting spectral resolution is 24.4 kHz before smoothing, corresponding to at the rest frequency of the 21cm HI line. Scans are calibrated, baselined, and flagged for radio frequency interference, and then combined into regularly sampled data cubes.
Details of the ALFALFA data processing can be found in Kent (2008, PhD thesis). Briefly, frequency channels in each grid have been baselined with linear fits and then “flatfielded”, where a median subtraction has been performed in both the right ascension and declination directions. A matched-filter algorithm was used for signal detection, with manual follow-up (Saintonge 2007). The careful attention to signal extraction, analysis, and data quality has proven to be invaluable in detecting faint objects and optimizing the output of the signal extraction process.
The cloud complex was discovered in the ALFALFA data obtained in the Spring 2005 campaign, which sampled the Virgo core region (). The data presented here are taken from a data cube centered at (J2000). The system temperatures of the ALFA receivers during the observations were in the range , yielding a root mean square (rms) noise of mJy/beam in channels with . The characteristics of the ALFALFA data cube from which the data are taken are summarized in Table 1.
2.1 ALFALFA Observations
The cloud complex is located near – this places it 2.9∘ (845 kpc in projection) South of M87 and 1.5∘ (432 kpc in projection) north of M49. We discuss the optical environment of the cloud complex in Section 5.
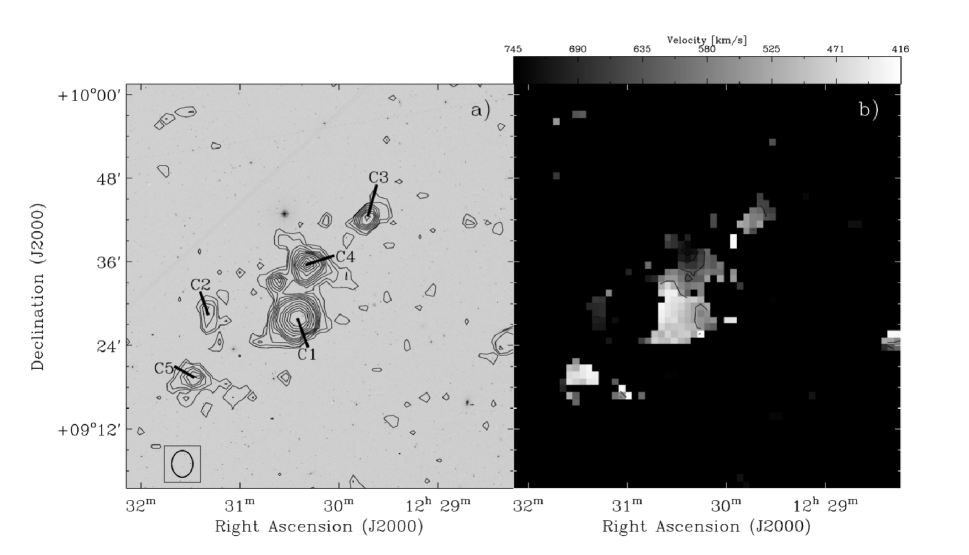
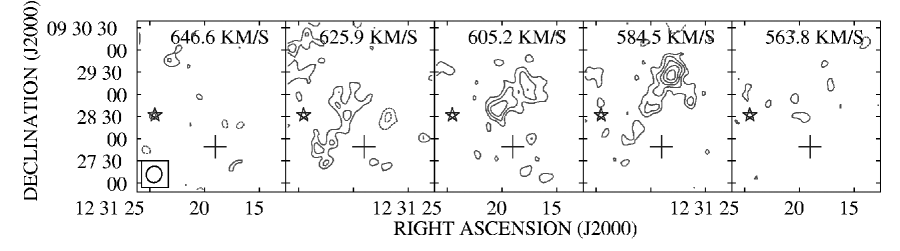
The complex consists of five distinct emission features or “clouds”, which we denote C1–C5. Together, they span approximately 35′ (170 kpc in projection at the cluster distance) on the sky and 130 in velocity. Channel maps of the ALFALFA dataset in the vicinity of these detections are shown in Figure 1, and total intensity (zeroth moment) and intensity-weighted velocity maps of the region is in Figure 2. An integrated spectral profile for each cloud is presented in Figure 3.
The individual properties of the clouds derived from the ALFALFA data are given in Table 2; all parameters are computed in the manner described by Giovanelli et al. (2007). The spatial centroid of each cloud is in col. (2). Its accuracy depends on the source strength, and varies from an average of for the brightest features to for the faintest ones. The heliocentric velocity , width at 50% of the peak W50 and total flux of the integrated spectral profiles in Figure 3 are in cols. (3)–(5). The signal-to-noise ratio of the detections is in col. (6), and is given by
| (1) |
where is in Jy , is in , is a smoothing width equal to the number of bins bridging half the signal, and is the rms noise (in mJy) across the integrated spectrum at 10 resolution. The HI mass for each cloud is in col. (7), and is computed assuming that the clouds are optically thin and at the Virgo distance =16.7 Mpc:
| (2) |
where is in Mpc and is in Jy . The uncertainties on in Table 2 and elsewhere do not include that in the distance adopted, which is poorly constrained due to the large peculiar velocities of objects near or within the cluster.
2.2 Cloud Morphologies and Kinematics from ALFALFA data
Cloud C1: C1 is the main cloud in the complex and the highest detection in this region. It is marginally resolved by the ALFA beams (Figure 2). Its integrated profile is symmetric and narrow with a peak flux density of mJy (Figure 3). C1 has one of the largest HI masses in the complex at . There is a faint, uncataloged optical feature visible in SDSS images in the vicinity of C1; its relationship to the HI cloud is discussed in Section 5.
Cloud C2: This isolated cloud is the faintest ALFALFA detection in the region at , and it has the lowest H I mass. C2 is close to the ImV dwarf galaxy VCC 1357 (Binggeli et al. 1985), but the ALFALFA centroid is offset from the optical position of the latter by 2′ to the West. No optical redshift is available for VCC 1357. An Arecibo single-beam observation centered on VCC 1357 with similar sensitivity to the ALFALFA data is presented by Hoffman et al. (1987). The properties of their detection are identical to those of C2 within the measurement uncertainties; these and the ALFALFA observations have likely uncovered the same object. However, the previous association of VCC 1357 with this H I source is now in doubt by the evidence for an offset in position between the two, and by the detection of the other H I complex clouds presented here. The positional offset between VCC 1357 and C2 is confirmed by the VLA data discussed in the next section. The possible relationship between C2 and VCC 1357 is discussed in Section 5.
Cloud C3: This northernmost component of the complex is unresolved by the ALFA beam. Its integrated profile appears asymmetric with more emission on the high velocity side of the peak (Figure 3), but this may be an artifact of the poor . C3 is not connected to the main clouds C1 and C4 at the sensitivity obtained. There is no discernible optical counterpart to C3 in the SDSS or DSS survey images of the region.
Cloud C4: This cloud appears to be connected to the main cloud C1, with its centroid located just 6′.6 to the North of the latter (Figures 1 and 2). Its H I mass, , is comparable with that of C1 but its integrated profile is significantly broader. The spectrum is asymmetric with more emission on the high-velocity side of the peak (Figure 3), and the cloud is (poorly) resolved into a collection of smaller clumps by the ALFA beam (Figure 1). Line broadening is thus likely to arise from this superposition, rather than from coherent rotation. There is no discernible optical counterpart to C4 in the SDSS or DSS survey images of the region.
Cloud C5: This cloud is located 17′.4 Southeast of the main cloud C1. Its integrated profile appears to be symmetric, and implies an H I mass that is a third that of C1 at . At the ALFALFA sensitivity, C5 is not connected with any other complex clouds. There is no discernible optical counterpart to C5 in the SDSS or DSS survey images of the region.
3 Aperture Synthesis Follow-up Observations
Aperture synthesis observations of the central region of the cloud complex detected by ALFALFA were obtained with the Very Large Array111The VLA is a facility of National Radio Astronomy Observatory, which is operated by Associated Universities, Inc., under a cooperative agreement with the National Science Foundation. (VLA) in two campaigns. On 2005 July 11, 5 hours on-source were obtained via rapid response observations in C configuration. On 2006 Jan 18 – 23, dynamically scheduled observations during the D – A configuration change yielded hours on-source with antennas that hadn’t yet been moved. All observations had common pointing and spectral centers of (J2000) and MHz, and online Hanning smoothing was applied to yield 48.8 kHz channels over a total bandpass of 3.125 MHz. The observing setup was chosen to maximize the number of ALFALFA cloud detections accessible to the VLA in a single pointing: all of the clouds in Table 2 except C3 fall within the resulting field-of-view and bandpass.
The data from the runs was reduced using the Astronomical Image Processing System (AIPS; Greisen 2003). Standard flux, phase and bandpass calibration routines were applied. Continuum emission was removed from the data via linear fits to the average visibilities in line-free channels spanning 245 kHz at either end of the calibrated bandpass, yielding a net bandwidth of 2.2 MHz sensitive to HI emission.
After calibration, the data from each run were combined into a single UV data cube and imaged using a variety of spatial and spectral weighting schemes. The dirty beam pattern was deconvolved from the data using the Multi-Scale Clean algorithm implemented in AIPS (Cornwell 2008; Greisen et al. , in prep.), in which components are extracted from a series of tapered images of the visibilities. We find that the resulting maps are not sensitive to the details of the deconvolution process, and therefore analyze the highest sensitivity, naturally-weighted cube with a synthesized beam width of 22″ (1.8 kpc at the Virgo distance). All maps and derived parameters are corrected for the attenuation of the primary beam, and averaged over 2 or 3 spectral channels to yield resolutions of or , respectively. A summary of the aperture synthesis observing and map parameters is given in Table 3. For clarity, all variables denoting parameters derived from the VLA observations are primed.
3.1 H I Aperture Synthesis Detections
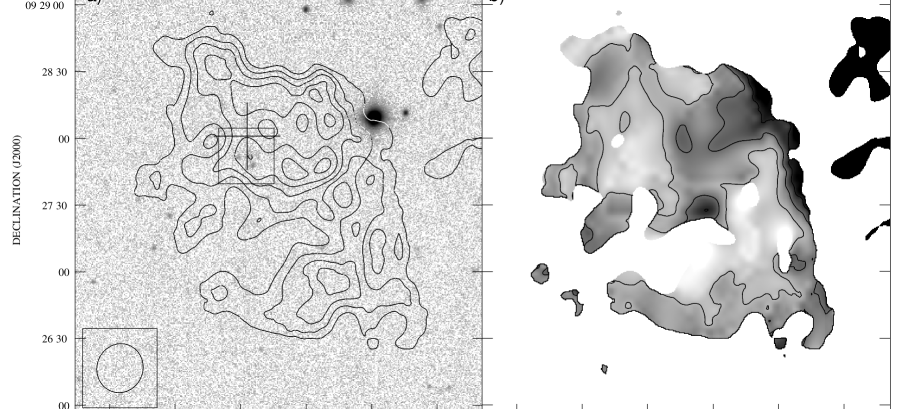
We make two detections in the VLA data, which correspond to the clouds C1 and C2 identified in the ALFALFA survey data. Channel maps of these detections are shown in Figs. 4 and 5. Contours are at multiples of the median rms map noise in the primary beam–corrected maps at that location, and negative contours are indicated by dashed lines. We find that the emission associated with C1 and C2 spans multiple synthesized beams over contiguous (but largely independent222The noise in each channel is weakly correlated by the continuum subtraction. We have verified that the details of this subtraction do not impact the detected cloud morphologies.) channels irrespective of the visibility weighting or image deconvolution scheme adopted: they are credible detections in the VLA data.
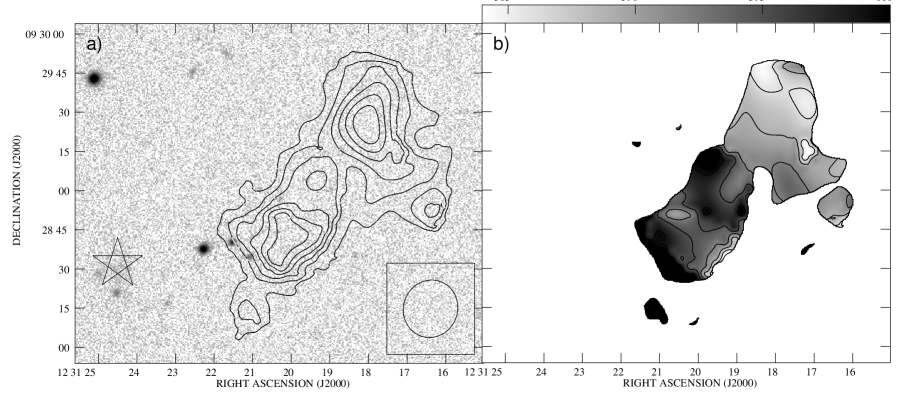
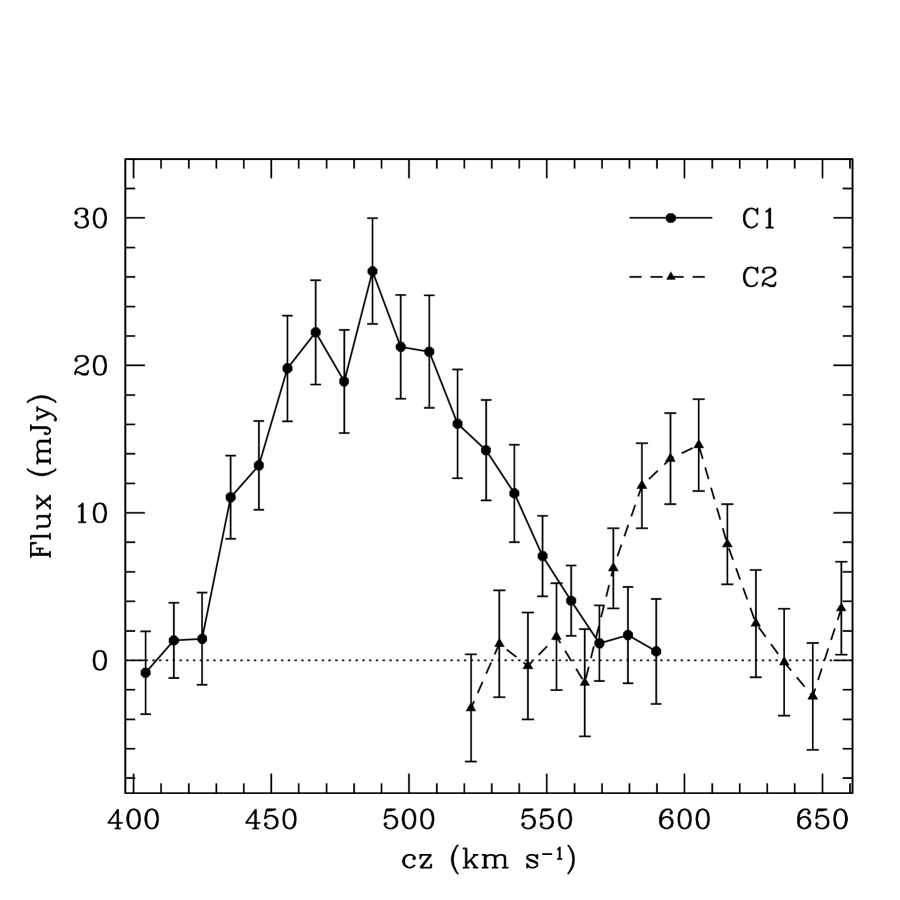
Total intensity and intensity-weighted velocity maps for the clouds are shown in Figs. 6 and 7. The data cubes are blanked before these moments are computed: a mask is generated for each frequency channel by smoothing the data to half the angular resolution in Table 3 and blanking regions with fluxes less than 2 of that image. In addition, the intensity-weighted velocity maps in Figs. 6b and 7b are computed only at locations with column density cm-2. Integrated spectral profiles for C1 and C2 from the VLA observations are in Figure 8. The error bars on each point in Fig. 8 reflect integrated over the emission region in that channel and a calibration uncertainty.
The properties of C1 and C2 derived from the VLA data are given in Table 4. Unless otherwise indicated, the parameters are computed in the same manner as their ALFALFA counterparts (see Section 2.1). The location of the peak in the total intensity maps of Figs. 6a and 7a is given in col. (2). The centroid of the integrated profiles of Figure 8 is in col. (3), and of the profiles is in col. (4). The values of are corrected for instrumental effects by assuming that the unbroadened profile is gaussian. The integrated flux density and H I mass are in cols. (5) and (8), respectively. The maximum angular extent of each cloud is in col. (6). We adopt the outermost locations where cm-2 in Figs. 6a and 7a as the cloud edges, and correct the measured values for beam smearing. The position angle at which is measured is in col. (7). An estimate of the dynamical mass of each cloud is in col. (9), and is computed via:
| (3) |
where is the object diameter in arcminutes, is in and the Virgo distance is in Mpc. We note that has physical meaning only if the clouds are self-gravitating and in dynamical equilibrium; these two assumptions may not be valid for C1 and C2 (see Section 6).
Position-velocity slices through the C1 and C2 datacubes are shown in Figs. 9 and 10, respectively. For C1 in Fig.9, one 3″-wide slice is oriented along , and the other is perpendicular to this axis. We note that the emission is unresolved both spatially and spectrally along the axis perpendicular to for C2, and we therefore show only the slice oriented along in Fig. 10.
3.2 HI Morphologies and Kinematics of C1 and C2
The VLA follow-up data provide important insight into the H I morphologies and kinematics of C1 and C2.
Cloud C1: Figs. 4 and 6a show that C1 has a disordered morphology at the resolution of the VLA observations, with the bulk of the emission stemming from an arc-like structure at . The apparent “clumpiness” of the detected emission down to the synthesized beam width of ″ (1.8 kpc) is not a deconvolution artifact, and suggests that the cloud exhibits structure on even smaller scales. The box in Fig. 6 a encloses a faint, uncatalogued optical feature that is coincident with a high peak in C1; we discuss the implications of an association between these optical and HI sources in §6. Figs. 6b and 9 show that the cloud has no coherent velocity structure.
Figs 4 and 6 illustrate that there is very good agreement between the centroid of the C1 emission detected by ALFALFA and that detected by the VLA. The global properties of C1 measured from the VLA data also correspond well with those obtained from the ALFALFA data, although less HI flux is detected in the former ( 4%, Tables 2 and 4). If this “missing” flux is uniformly distributed over a circular region at least 1.5′ across, it would escape detection at the 3 level in an optimally smoothed frequency channel of the VLA data. If it is contained in a coherent structure, we expect it to be kinematically coincident with the arc in Fig. 6 since 0.
Cloud C2: Figs. 5 and 7 illustrate that C2 has a markedly different H I morphology from C1. The emission in each channel of the VLA observations is barely resolved both spatially and spectrally, with the bulk of the emission in an unresolved feature at (J2000) in the channel. The total intensity map of C2 in Fig. 7a consists of two clumps: that to the Northwest results from the brightest H I feature at , and that to the Southeast results from emission distributed over 625 . Figs. 7b and 9 indicate that there is a gradient in the velocity field of C2. Given the poor sensitivity and resolution of the VLA data across the detection, it remains unclear whether or not this gradient stems from coherent internal motions.
A comparison between the integrated properties of C2 derived from the ALFALFA and VLA observations suggests that a small but statistically significant amount of H I in this source has not been detected by the VLA (; Tables 2 and 4). There are few direct constraints on the morphology of the missing gas. However, given the gradient in the C2 velocity field (Fig. 7b), the quantities and are consistent with a kinematically coherent extension to the Southeast beyond that detected at in Fig 5.
The star in Figs. 5 and 7a denotes the optical location of VCC 1357 (Binggeli et al. 1985). The VLA observations therefore confirm the offset between this source and C2 suggested by the ALFALFA data (§2.2). It is thus clear that if C2 is associated with VCC 1357, then the gas in this system is displaced by (10 kpc in projection, or optical diameters; Binggeli et al. 1993) from the stars. We discuss the implications of an association between these H I and optical features in Section 5.
3.3 Non-Detections in the VLA Follow-up Data
While the complex clouds C4 and C5 fall within the field-of-view and bandpass of our VLA observations, they are not detected in the resulting dataset. This is not surprising given their projected distances of 11.2′ and 12.5′ from the pointing center in Table 4. Given the integrated spectral profile shapes and centroids of these clouds in the ALFALFA survey data (Table 2), we expect their emission to fall below the detection limit in the VLA data cube if they are smoothly distributed over a circular region with a diameter . The VLA non-detections therefore provide little insight into the morphologies and kinematics of C4 and C5.
4 CO(3–2) Observations
An exploratory observation of the CO(3–2) emission line consisting of a single pointing (R.A.(J2000) = 12h30m 27s, Dec.(J2000) = +9∘28′34.5′′) was carried out with the APEX Telescope (Güsten et al. 2006) located in the Chajnantor Plateau in northern Chile. This pointing was chosen because corresponds to the peak of the HI emission in the VLA map. The observations took place during the night of January 1st, 2008, using the the 345 GHz DSB heterodyne receiver APEX-2A. The beamsize (FWHM) of the APEX 12-m telescope is 18′′ at 345 GHz. The receiver was tuned to CO(3–2) at 490 km s-1, with a total bandwidth of 1550 km s-1 and spectral resolution of 0.8 km s-1. Observations were performed with an atmospheric opacity at 220 GHz of 0.34, with a mean PWV 2.1 mm yielding to a Tsys(DSB) = 370 K. Pointing using Saturn as reference was regularly performed and was better than 2 The total on-source integration time was 36 min, reaching a rms of 48 mK with a spectral resolution of 0.9 km s-1. The antenna efficiency was estimated at 70%.
Data reduction and analysis were performed using the CLASS package from the GILDAS software (Pety 2005). Reduction consisted of baseline subtraction and the integration of the individual scans. The adjacent channels were re-binned to a velocity resolution of 22.9 km s-1, leading to a rms of 12.9 mK in . No clear detection was found.
These exploratory CO(3–2) observations allow us to place an upper limit to the mass in molecular form in C1. In order to estimate a 3- upper limit, we assume an expected line width of 50 km s-1, yielding to a 1.93 K km s-1. We assume a conversion “X” factor between the CO(1–0) line and the molecular hydrogen column density of 2.81020 cm-2 (km s-1)-1 (Bloemen et al. 1986). We also adopted a CO(3–2)/CO(1–0) integrated line intensity ratio of 0.4 which is the typical value of the Galactic disk (Sanders et al. 1993). These values yield a H2 column density limit for the observation of 1.31021 cm-2, averaged over a beam of 18′′. At a distance of 16.7 Mpc, this column density over a 1′ diameter is equivalent to a molecular hydrogen upper mass limit of 4.0 108 M⊙, which is comparable to the HI mass (see Table 2.). Allowing for uncertainties in the value of the X factor, the metallicity of the cloud gas, and the CO(3–2)/CO(1–0) integrated line ratio, we can conclude that the gas mass in the cloud C1 is unlikely to be dominated by the molecular component.
5 The Environment of the Cloud Complex
The optical feature of unknown redshift appearing in the field of C1 and discussed in Section 3.2 appears to be just above the SDSS –band detection limit. If the feature is approximately across, then its –band luminosity at the Virgo distance would be . The stellar M/L ratios models of Bell et al. (2003) give 1.6. If this feature is the optical counterpart of C1, then the stellar to HI mass ratio is less than 0.01 and . An analogous exercise for C2 and the putative counterpart VCC 1357 yields a stellar to HI mass ratio of less than 0.05.
As for the possible optical counterparts of clouds C1 and C2, attempts to obtain optical redshifts were made in two occasions with the Palomar 5m Hale telescope. The first time was unsuccessful due to limited sky transparency, the second due to lack of any discernible Hα emission or of any other measurable spectral signature. The possibility of an association between HI and optical features remains open.
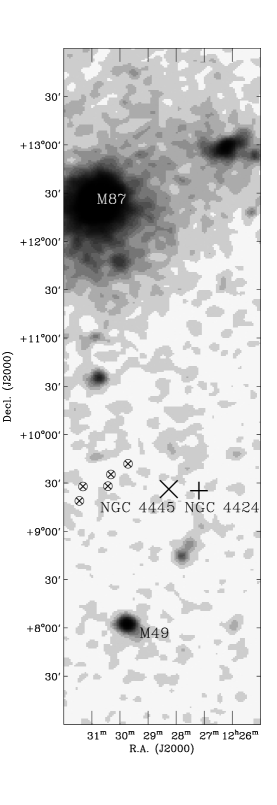
Figure 11 shows the Virgo Cluster X-ray emission in the vicinity of the HI cloud complex (Snowden et al. 1995). The large X–ray emission regions are centered on M49 and M87, with the HI cloud complex indicated with the crossed circles. Near the projected location of the cloud complex, Vollmer et al. (2001) estimate that the hot intracluster gas (ICM) density is cm-3, while Shibata et al. (2001) have measured an ICM temperature of in units of K.
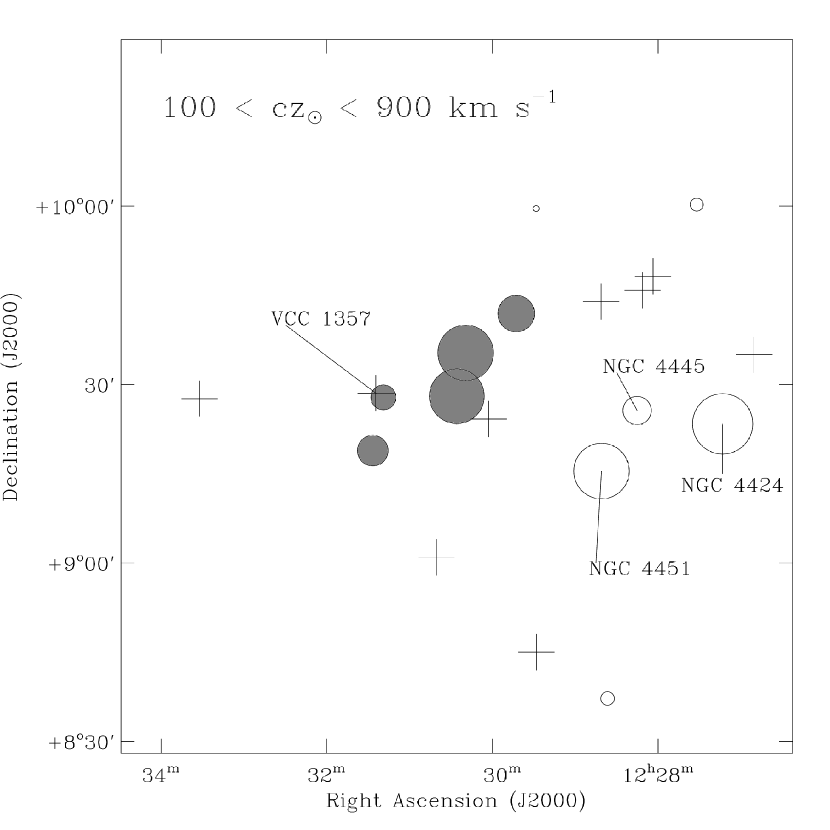
Several galaxies are projected in the vicinity of the cloud complex. Figure 12 shows all cataloged objects within of C1 and with heliocentric velocities between 100 and 900 : galaxies detected in the 21cm line are plotted with a circle of area proportional to the HI mass; galaxies not detected in ALFALFA with redshift information from other sources are plotted with crosses, most of which are early type systems. It is assumed that all galaxies are located at the distance of the Virgo cluster. Note that the velocities of the HI clouds range between 480 and 607 , i.e. if they are part of the Virgo cluster their line of sight velocity with respect to the cluster reference frame is directed toward us, as the heliocentric velocity of the cluster is 1150 (Huchra 1988). Under the assumption that the clouds originated in the disk of a galaxy moving at high speed through the cluster, the velocity of the parent galaxy should also be incoming in the cluster reference frame, and most likely doing so at a larger velocity than the clouds themselves, as the latter would be decelerated by ram pressure after stripping. In the heliocentric reference frame, the parent galaxy should then have a lower velocity than those in the cloud complex. Two objects satisfy that condition: NGC 4424 and NGC 4445. Their locations are indicated by a plus sign (NGC 4424) and X symbol (NGC 4445) in Figure 11. In addition, as we discuss below, they are also extremely gas deficient for their size, which is evidence that they have been stripped within the last passage through the cluster.
The SBa galaxy NGC 4424 (also known as UGC 7561 and VCC 9079) is located at (J2000). This places NGC 4424 at a projected distance of 236 kpc from the cloud center, and 900 kpc from M87. This peculiar galaxy is at a velocity (=437 ), near that of the main cloud. The angular size of the stellar component, , translates to a linear size of kpc at the Virgo distance. A detailed study by Cortes et al. (2006) characterizes it as having disturbed morphology; they also suggest that CO observations are indicative of non–circular gas motions and discuss convincingly the vulnerability of the galaxy to ram pressure stripping (see also Kenney et al. 1996). NGC 4424 has a HI mass of 2.5 and estimations of HI deficiency values have been reported between of 0.75 (Chung et al. 2007) and 1.09 (Helou et al. 1984). Those figures indicate that NGC 4424 has lost between 80% and 90% of its HI gas. Chung et al. (2007) noted that NGC 4424 exhibits a one–sided tail extending to the southeast, which is also detected by ALFALFA, and that the HI disk is truncated at a radius smaller than that of the stellar component of the galaxy. The direction of the tail shows the southeast to northwest direction of motion for NGC 4424; this motion is not compatible with the position of the cloud complex.
NGC 4445 (also known as UGC 7587 and VCC 1086) is an edge on spiral, possibly of type Sab, located at (J2000). Its heliocentric radial velocity is =354 and the HI mass (Kent et al. 2008). Solanes et al. (2002) estimate its HI deficiency between 0.98 and 1.11, i.e. NGC 4445 has lost about between 90% and 93% of its HI gas. With a major axis angular diameter of , its linear size is about 13 kpc. We are not aware of HI synthesis data of this object; none are found in the VLA data archive.
6 Discussion
One possibility that deems consideration is that the clouds are gravitationally bound structures, embedded in their own dark matter halos. If an HI cloud is gravitationally bound, its total dynamical mass within the HI radius can be computed from Equation 3, assuming spherical symmetry. Such mass is 2.3 for C1 and 0.3 for C2 as calculated from the aperture synthesis measurements. The density of such objects would be for C1 and for C2. These densities can be compared to the critical density, , where . Were dark matter to provide the gravitational binding and to extend well beyond the visible, baryonic component, the total halo mass of, e.g., C1 would exceed . In that case, it would be surprising that the VLA data do not exhibit any trace of ordered motions in the gas, nor does the visible matter show any degree of central concentration, thus violating the mass–concentration relation for halos. A similar issue can be raised for the whole cloud complex. If bound by self–gravity, its total dynamical mass would be of order of and its mean density . Again, the cloud complex shows no ordered motions. The possibility that the clouds in the complex are a group of optically dark galaxies embedded in their own dark matter halo appears relatively implausible.
For a purely gravitational event, we may expect stream-like topology in the removed gas, which is not observed. High speed galaxy-galaxy encounters tend to produce relatively small damage in terms of gas mass loss by the victim, albeit spectacular in spatial extent as in the case of NGC 4254/VirgoHI21. For NGC 4424 and NGC 4445, the damage would have been quite substantial (more HI is seen in the cloud complex than in either of the galaxies themselves) and the topology of the remnant is not particularly stream-like. These are not however very strong arguments and the possible origin through a high speed close encounter cannot be excluded.
Ram pressure stripping is very likely if the galaxy’s orbit takes it deep in the cluster potential well, and can result in severe gas depletion from its outer disk (Cortes et al. 2006). With a radial velocity differing from the systemic velocity of the cluster by 700 and a projected location half way between M87 and M49, the likelihood that ram pressure is currently very effective is marginal; it could however have been far more effective a few 108 years ago, if the orbit dipped closer to the cluster center, independently on whether or not an encounter or merger took place. As we will see, that likelihood is even higher for NGC 4445.
6.1 Orbital Motion Through the ICM: a Simple Simulation
We consider the motion of a galaxy as it dips into the ICM on a parabolic orbit of pericluster distance . Parametrized by the azimuthal angle , as illustrated in Figure 13, the distance of the galaxy from the focal point (M87) is
| (4) |
while the orbital escape velocity is
| (5) |
where is the cluster mass. For simplicity, we assume the cluster mass is concentrated in M87 and equal to , rather than integrating the motion for a changing cluster mass within the variable , which is sufficient for our purposes. For the ICM density we assume the –model (Schindler, Binggeli & Boehringer 1999; Vollmer et al. 2001), given by
| (6) |
with a central density of cm-3 and a core radius of kpc, appropriate for the SW sector of the cluster and kpc for the cluster as a whole.
As the galaxy travels through the ICM, we assume the galactic gas is stripped at pericluster; from there on, we estimate the ram acceleration and integrate the growing separation and between the galaxy and clouds. Figure 14 shows the orbital parameters for pericluster distances of = 400, 500, and 600 kpc. The best orbit in this simple exercise is fit with 500 kpc. In that scenario, a galaxy reaches a distance = 1100 kpc, 1.0 Gyr after pericluster passage. The velocity of the galaxy at = 1100 kpc is 1100 . Velocity () and spatial () separation values of 200 kpc and 300 respectively are obtained from Figure 14. Corrections for the inclination along the line-of-sight for 45∘ give values of 140 kpc and 200 . These numbers are in general agreement with the observed values.
6.2 Possible Formation Mechanisms
We can now consider two possible scenarios of cloud formation as the galaxy moves through the cluster: (a) removal by ram pressure and (b) a high speed tidal interaction, of the type responsible for VirgoHI21 (Duc & Bournaud 2008; Haynes et al. 2007).
Ram pressure stripping will occur when the ram pressure arising from the motion of the galaxy at velocity with respect to the intracluster medium of number density , (where is the proton mass), exceeds the restoring gravitational force that binds the gas to the galaxy: , where is the gas surface density of the galactic disk and is the total surface mass density of the disk. This condition can be rewritten as
| (7) |
where and are now the total disk and gas masses within the radius .
At the location of the cloud complex, some 845 kpc from M87, the density of the intracluster gas (ICM) is significantly lower than near the center of the cluster. For a –model (Eqn. 6) at the present projected distance of the clouds from M87, cm-3. In the case of NGC 4424, , where is the angle between the line of sight and the galaxy velocity vector. We estimate a disk mass enclosed within kpc of about (a generous estimate, since the total velocity width of the HI emission of the galaxy is 61 (Kent et al. 2008) and the inclination of the disk, albeit unknown, is unlikely to be smaller than 45∘) and assume . With those numbers, the ram pressure term roughly matches the restoring force at the larger galactocentric radii. Chung et al. (2007) also compute ram pressure effects in the range between 125 175 cm-3 ()2 and a restoring force range between 40 475 cm-3 ()2 for NGC 4424.
In the case of NGC 4445, . The radial extent of the HI disk is currently unknown, but we can estimate the ram pressure and the restoring force at kpc, as well as its disk mass from a rotational velocity of 107 , from the measured velocity full width of the HI line of 213 . Again, the ram pressure term is comparable with the restoring force at the galactocentric radii at which most of the HI would be expected to be found in an unperturbed disk.
It is interesting to point out that NGC 4522, a very clear case of ram pressure stripping carefully studied by Kenney et al. (2004), is projected on the same region of the cluster (RA=12h 33m 39.7s, Dec=09∘ 10′30″) albeit in a different velocity regime ( ). At the present location, Kenney et al. argue that the ICM density as described by the smooth –model of eqn. 6 is likely to be inadequate to explain the stripping. They invoke the possibility that the ICM may be locally denser than implied by the model.
6.3 Timing Considerations
Estimates of the tidal effects can be made by considering two nearby clouds in the vicinity of a cluster (Figure 15). The two clouds will disperse at a rate under the gravitational tidal acceleration from the cluster potential, where is
| (8) |
where is the mass of the cluster within radius Rcluster, and is the initial separation of the two clouds. The timescale of the encounter can be taken as , where is the velocity of the cloud complex with respect to the cluster. Taking , we can write a simple relation for the separation rate of the two clouds
| (9) |
Two clouds initially separated by 10 kpc, located 845 kpc from the center of the cluster of mass and moving at a velocity of with respect to the cluster would roughly double their separation in a time comparable with the cluster crossing time. Tidal forces related to the cluster potential alone are unlikely to account for the spatial dispersion of the clouds in the complex, if they were stripped from a single galaxy.
The cloud complex is separated by kpc and by in velocity from NGC 4424; the corresponding numbers for NGC 4445 are respectively kpc . This separation would increase from zero to the observed value over a time of order
| (10) |
for NGC 4424 and
| (11) |
for NGC 4445. For relatively large values of , they can be comparable with the time it takes for the galaxy to cross the inner regions of the cluster . Under constant acceleration, the time necessary to reach the observed values of and would be about twice as computed above. Either of those assumptions are unrealistic if ram pressure acts upon the clouds, as they travel through an ICM of variable density. However, two preliminary conclusions can be made already: (i) if the clouds originated from NGC 4445 or NGC 4424, the stripping took place at least a few yrs ago; (ii) simple kinematic timescales make NGC 4445 as a more palatable candidate as a parent galaxy than NGC 4424. In the following, we concentrate our discussion on the assumption that the clouds were stripped from NGC 4445, although we maintain the inferred relations parametrized form for easy application to NGC 4424. Next, we derive the acceleration due to ram pressure.
As a spherical cloud of radius travels through the ICM at speed , the force acting on its surface can be written as the ram pressure times the area, given by
| (12) |
The resulting acceleration due to ram pressure is
| (13) |
where the factor accounts for the fraction of gas in form other than HI and is the HI mass of the cloud. The acceleration can then be written as
| (14) |
Once the gas is stripped, while the motion of the galaxy is relatively unimpeded by the ram pressure, the clouds fall behind, affected by the acceleration . In order to accumulate a velocity difference from the galaxy , at constant acceleration a time on order of will be required, while in order to accumulate a separation , a time on order of will be required:
| (15) |
| (16) |
where
| (17) |
For cloud C1, . The maximum radius out to which the VLA detects HI emission in C1 is about , which translates to 6.5 kpc at the Virgo cluster distance. However, the effective radius of the cloud is very likely smaller than 6.5 kpc. A cursory inspection of Figure 6 shows that only about 1/3 of the area subtended by the emission out to a 1′ radius exceeds a column density of gas at half the peak level, which would yield an effective radius of order of 3 kpc. In addition, from the topology of the HI gas in our own ISM, it is found that while the majority of the HI emission arises in denser regions, those clouds’ volume filling factor is quite small. Such structure would be unresolved by the 22″ (1.8 kpc) beam of the VLA observations. Values of order –4 kpc appear appropriate. The parameter , which accounts for the mass fraction of He and other than HI gas, should be in the range 0.4–0.7. Near the current location of the clouds, the ICM density is unlikely to exceed cm-3, unless the ICM is very clumpy, as suggested by Kenney et al. (2004). As for the parameters specific for the galaxies, for NGC 4424 , kpc and , while for NGC 4445 , kpc and . Note that by imposing we can obtain a constraint on the combination of physical parameters
| (18) |
As we discussed earlier, accumulation of distance and velocity offsets between clouds and parent galaxy, and , at either constant rate or constant acceleration are used under outlined above, and do not take into account projection effects, which would account for the orientation of NGC 4445 and the clouds with respect to M87 at the cluster center. It is important to note that a connection between NGC 4445 and the cloud complex is somewhat ambiguous, especially when compared to other disrupted gas features like NGC 4388 which show a clear connection in the form of a tail.
6.4 Evaporation Timescale
According to our findings, if the clouds were stripped from a parent galaxy, most of the stripping took place a fair fraction of a Gyr ago. In that case, it is reasonable to investigate the survival of the clouds in the ICM. Differential ram pressure forces will lead to ablation and dilution of the gas clouds. In addition, upon removal from the galaxy, the cold gas can be heated by conduction by the intracluster gas and the gas mass of the cloud would thus be progressively reduced by evaporation, if (presumably absent) stellar mass loss does not replenish the gas. The evaporation rate in yr-1 can be written as (Cowie & Songaila 1977)
| (19) |
where is the mean molecular weight, the proton mass, the thermal conductivity, the intracluster gas temperature in units of K, the effective cloud radius in kpc (proportional to the square root of the area of the cloud exposed to the ICM), the Boltzmann constant and ln the Coulomb logarithm. For (Shibata et al. 2001) and , the evaporation timescale is
| (20) |
where is a correction factor roughly proportional to the fraction of the time the cloud’s orbit – between the time the gas is removed from the disk and the time of observations — places it in a part of the ICM within which the conductivity coefficient yields the evaporation rate in Eqn. 19. This estimate is very uncertain due to the largely unknown geometry of the cloud, an exact knowledge of its orbit through the ICM, the unknown fraction of the gas in ionized form and the possible presence of magnetic fields, which would inhibit conduction across field lines. It is clear from Eqn. 20 that if the HI gas is stripped from the galaxy in a region deep enough in the cluster ICM, conduction can obliterate evidence of the cold gas on timescales of yr. However, the rate in Eqn. 20 is approximately valid only in vicinity of the cluster core. Away from the central and denser parts of the cluster conduction becomes decreasingly effective, due to the rapid increase of the mean free path of electrons and conduction becoming saturated: this is thought to take place a couple of cluster ICM core radii ( kpc) out from the center of the ICM distribution (Sarazin 1986). This is why in the simulation described in the preceding section, we have maintained the closest approach of the galaxy to M87, , at values greater than a few hundred kpc; the evaporation timescale remains higher than the kinematical ones and the clouds can be preserved.
7 Summary
We have utilized datasets from the ALFALFA survey and follow-up observations with the Very Large Array to obtain both single dish and aperture synthesis observations of a new HI cloud complex in the Virgo Cluster. The results of these observations are summarized as follows:
-
1.
Five separate HI clouds in the ALFALFA survey have been discovered with radial velocities between 500 and 600 . The complex subtends an angle of 35’ (170 kpc), the individual cloud HI masses range from 0.48 to 1.7 and the overall HI mass of the complex is , at the distance of the Virgo cluster. The clouds’ velocity widths vary between 50 and 250 . In the latter case, the wide spectrum is likely to be due to a blend of several poorly resolved clumps.
-
2.
Several cluster galaxies are found in the vicinity of the cloud complex; the most likely candidates for association with the clouds are NGC 4424, a disturbed SBa with at a projected distance of 235 kpc from the center of the cloud complex, and NGC 4445, an edge on spiral at a projected distance of 150 kpc, with . Both galaxies are extremely HI deficient, apparently having lost between 80% and 93% of their HI gas. The total HI mass of the cloud complex is equivalent to between 1/2 and 1/3 of the HI lost by NGC 4424 and about 4/5 of the HI lost by NGC 4445.
-
3.
Two of the clouds in the complex (C1 ad C2) have been detected with the VLA. They have angular sizes of 2.7′ and 1.5′ respectively. The synthesis maps do not exhibit any degree of symmetry in the gas distribution or in the velocity field. Faint optical features are found in the vicinity of the two clouds. Lack of optical redshifts prevent us from establishing a physical association. If the optical features were associated with the two clouds, their HI mass to –band luminosity ratios would be respectively for C1 and for C2, in solar units. A handle on the HI size allows estimates of the dynamical masses of the clouds, contained within the HI radius and under the hypothesis that they are self–gravitating. Those values are for C1 and for C2.
-
4.
The possibility that the clouds constitute a group of primordial structures, embedded in their own dark matter halos, appears unlikely. A more plausible scenario is that the complex is material removed from a galaxy traveling through the cluster at high speed, such as NGC 4424 or NGC 4445. A ram pressure stripping event is preferred to a purely gravitational one.
-
5.
A simulation of plausible orbital parameters for the putative parent galaxy was carried out showing that a nearly radial orbit that would take it to within 400 kpc from M87 would produce effects comparable with those observed. Nearest approach to M87 would have resulted 1 Gyr ago, at which stripping of most of the gas is assumed to have taken place. The nearest approach to the cluster center would be approximately 500 kpc. At that distance from M87, thermal conduction would be ineffective at evaporating the clouds after removal from the parent galaxy. At pericluster passage, the velocity (not corrected for l.o.s. inclination) of the galaxy would be 1100 . The inclination of the orbital plane to the line of sight of the best fit simulation would be approximately 45∘.
-
6.
Dynamical timescales, based on relative velocities and spatial displacements of the clouds from the putative parent galaxy, suggest that the most likely such parent is NGC 4445.
This research has made use of the NASA/IPAC Extragalactic Database (NED) which is operated by the Jet Propulsion Laboratory, California Institute of Technology, under contract with the National Aeronautics and Space Administration. was developed and maintained under NASA ADP Grant NAS5-32068 under the auspices of the High Energy Astrophysics Science Archive Research Center at the Goddard Space Flight Center Laboratory of NASA. KS acknowledges support from a Jansky Fellowship during the completion of this work. This work has been supported by NSF grants AST–0307661, AST–0435697, AST–0607007 and the Brinson Foundation.
This research has made use of Sloan Digital Sky Survey (SDSS) data. Funding for the SDSS has been provided by the Alfred P. Sloan Foundation, the Participating Institutions, the National Aeronautics and Space Administration, the National Science Foundation, the U.S. Department of Energy, the Japanese Monbukagakusho, and the Max Planck Society. The SDSS Web site is http://www.sdss.org/. The SDSS is managed by the Astrophysical Research Consortium (ARC) for the Participating Institutions. The Participating Institutions are The University of Chicago, Fermilab, the Institute for Advanced Study, the Japan Participation Group, The Johns Hopkins University, the Korean Scientist Group, Los Alamos National Laboratory, the Max-Planck-Institute for Astronomy (MPIA), the Max-Planck-Institute for Astrophysics (MPA), New Mexico State University, University of Pittsburgh, University of Portsmouth, Princeton University, the United States Naval Observatory, and the University of Washington.
References
- Barnes et al. (2001) Barnes, D. G. et al. 2001, MNRAS, 322, 486
- Bell et al. (2003) Bell, E. F., McIntosh, D. H., Katz, N., & Weinberg, M. D. 2003, ApJS, 149, 289
- (3) Binggeli, B., Sandage, A., & Tammann, G. A. 1985, AJ, 90, 1681
- (4) Binggeli, B., Popescu, C. C., & Tammann, G. A. 1993, A&AS, 98, 275
- (5) Bloemen, J. B. G. L., et al. 1986, A&A, 154, 25
- (6) Cayatte, V., van Gorkom, J.H., Balkowski, C., & Kotanyi, C. 1990, AJ, 100, 604
- (7) Cayatte, V., van Gorkom, J.H., Balkowski, C., & Kotanyi, C. 1994, AJ, 107, 1003
- Chamaraux et al. (1980) Chamaraux, P., Balkowski, C., & Gerard, E. 1980, A&A, 83, 38
- Chung et al. (2007) Chung, A., van Gorkom, J. H., Kenney, J. D. P., & Vollmer, B. 2007, ApJL, 659, L115
- Chengalur et al. (1995) Chengalur, J. N., Giovanelli, R., & Haynes, M. P. 1995, AJ, 109, 2415
- Cornwell (2008) Cornwell, T. J. 2008, ArXiv e-prints, 806, arXiv:0806.2228
- (12) Cortes, J. R., Kenney, J. D. P., Hardy, E. 2006, AJ, 131,747
- Cowie & Songaila (1977) Cowie, L. L., & Songaila, A. 1977, Nature, 266, 501
- Davies & Lewis (1973) Davies, R. D., & Lewis, B. M. 1973, MNRAS, 165, 231
- (15) Djorgovski, S. 1990, AJ, 99,31
- Duc & Bournaud (2008) Duc, P.-A., & Bournaud, F. 2008, ApJ, 673, 787
- (17) Gavazzi, G., Boselli, A., Donati, A., Franzetti, P. and Scodeggio, M. 2003, å, 400, 451
- (18) Giovanelli, R. et al. 2005a, AJ, 130, 2598
- (19) Giovanelli, R. & Haynes, M. P. 1989, ApJL, 346, L5
- Giovanelli & Haynes (1985) Giovanelli, R., & Haynes, M. P. 1985, ApJ, 292, 404
- Giovanelli & Haynes (1983) Giovanelli, R., & Haynes, M. P. 1983, AJ, 88, 881
- (22) Giovanelli, R. et al. 2007, AJ, 133,2569
- Greisen (2003) Greisen, E. W. 2003, Astrophysics and Space Science Library, 285, 109
- (24) Güsten, R. et al. 2006, Society of Photo-Optical Instrumentation Engineers (SPIE) Conference, Vol 6267, Ground-based and Airborne Telescopes. Edited by Steep, Larry M. Proceedings of SPIE, Volume 6267, pp. 626714.
- (25) Haynes, M. P., Giovanelli, R., & Chincarini, G. L. 1984, ARA&A, 22, 445
- Haynes & Giovanelli (1986) Haynes, M. P., & Giovanelli, R. 1986, ApJ, 306, 466
- (27) Haynes, M. P., Giovanelli, R., & Kent, B. R. 2007, ApJL, 665, L19
- (28) Helou, G., Hoffman, G. L., & Salpeter, E. E. 1984, ApJS, 55, 433
- Hibbard et al. (2001) Hibbard, J. E., van der Hulst, J. M., Barnes, J. E., & Rich, R. M. 2001, AJ, 122, 2969
- (30) Hoffman, G. L., Helou, G., Salpeter, E. E., & Lewis, B. M. 1989, ApJ, 339, 812
- (31) Hoffman, G. L., Helou, G., Salpeter, E. E., Glosson, J., & Sandage, A. 1987, ApJS, 63, 247
- (32) Huchra, J. P. 1988, in ASP Conf. Ser. 4, The Extragalactic Distance Scale, ed. S. van den Bergh & C.J. Prichet (Salt Lake City: ASP), 257
- (33) Kenney, J. D. P., Koopmann, R. A., Rubin, V. C., & Young, J. S. 1996, AJ, 111, 152
- Kenney et al. (2004) Kenney, J. D. P., van Gorkom, J. H., & Vollmer, B. 2004, AJ, 127, 3361
- (35) Kent, B. R. et al. 2007, AJ, 665, L15
- (36) Kent, B. R., Giovanelli, R., Haynes, M. P. et al. 2008, AJ, 136, 713
- (37) Kent, B. R. 2008, Ph.D. Thesis, Cornell University
- Kilborn et al. (2000) Kilborn, V. A., et al. 2000, AJ, 120, 1342
- (39) Koopmann, R.A. et al. , 2008, ApJL, accepted
- Lasker et al. (1990) Lasker, B. M., Sturch, C. R., McLean, B. J., Russell, J. L., Jenkner, H., & Shara, M. M. 1990, AJ, 99, 2019
- (41) Mei, S. et al. 2007, ApJ, 655, 144
- Mihos et al. (2005) Mihos, J. C., Harding, P., Feldmeier, J., & Morrison, H. 2005, ApJL, 631, L41
- Minchin et al. (2005) Minchin, R. et al. . 2005, ApJL, 622, L21
- Minchin et al. (2007) Minchin, R., et al. 2007, ApJ, 670, 1056
- Moore et al. (1996) Moore, B., Katz, N., Lake, G., Dressler, A., & Oemler, A., Jr. 1996, Nature, 379, 613
- (46) Oosterloo, T. & van Gorkom, K. 2005, A&A, 437, L19
- (47) Pety, J. 2005, in SF2A-2005: Semaine de l’Astrophysique Francaise, ed. F. Casoli, T. Contini, J. M. Hameury, & L. Pagani, 721
- Ryder et al. (2001) Ryder, S. D., et al. 2001, ApJ, 555, 232
- Saintonge (2007) Saintonge, A. 2007, AJ, 133, 2087
- (50) Salzer, J. J., Alighieri, S. D., Matteucci, F., Giovanelli, R. & Haynes, M. P. 1991, AJ, 101,1258
- Sancisi et al. (1987) Sancisi, R., Thonnard, N., & Ekers, R. D. 1987, ApJL, 315, L39
- (52) Sanders, D. B., Scoville, N. Z., Tilanus, R. P. J., Wang, Z., & Zou, S. 1993, AIP Conf. Proc., 278, 311
- Sarazin (1986) Sarazin, C. L. 1986, Reviews of Modern Physics, 58, 1
- Schindler et al. (1999) Schindler, S., Binggeli, B., Böhringer, H. 1999, A&A, 343, 420
- Schneider et al. (1983) Schneider, S. E., Helou, G., Salpeter, E. E., & Terzian, Y. 1983, ApJL, 273, L1
- (56) Shibata et al. 2001 ApJ, 49, 228
- Snowden et al. (1995) Snowden, S. L. et al. 1995, ApJ, 454, 643
- Solanes et al. (2002) Solanes, J. M., Sanchis, T., Salvador-Solé, E., Giovanelli, R., & Haynes, M. P. 2002, AJ, 124, 2440
- (59) Verde, L., Oh, S. P., & Jimenez, R. 2002, MNRAS, 336,541
- Vollmer et al. (2001) Vollmer, B., Cayatte, V., Balkowski, C., & Duschl, W. J. 2001, ApJ, 561, 708
- York et al. (2000) York, D. G., et al. 2000, AJ, 120, 1579
| Parameter | Value |
|---|---|
| Sky center (J2000) | , |
| Spectral range | 25 MHz (-2000 – 3200 ) |
| Effective integration time | 48 seconds (beam solid angle)-1 |
| Spectral resolution | 24.4 kHz (5.1 ) |
| Half-power beam size | |
| RMS noise for | 2.5 mJy/beam |
| Cloud | ||||||
|---|---|---|---|---|---|---|
| (J2000) | () | () | (Jy ) | |||
| (1) | (2) | (3) | (4) | (5) | (6) | (7) |
| C1 | , | |||||
| C2 | , | |||||
| C3 | , | |||||
| C4 | , | |||||
| C5 | , |
Note. — Col. (1): cloud name. Col. (2): right ascension and declination of cloud centroid (J2000). Col. (3): average heliocentric velocity of integrated spectral profile from Figure 3. Col. (4): profile width, measured at 50% of the integrated spectra profile peak and corrected for instrumental broadening as described in Giovanelli et al. (2007). Col. (5): total flux of integrated spectral profile. Col. (6): signal-to-noise ratio of the detection, computed using and via eq. 1. Col. (7): base 10 logarithm of total HI mass, computed using via eq. 2.
| Parameter | Value |
|---|---|
| Pointing center (J2000) | , |
| Total time on-source | 265 min |
| Net bandpass | 2.2 MHz (378 – 822 ) |
| Maximum spectral resolution | 48.8 kHz (10.3 ) |
| Natural Weighting: | |
| Synthesized beam | @ -20∘ |
| at pointing center, | 0.33 mJy/beam |
| at pointing center, | 0.29 mJy/beam |
| Feature | ||||||||
|---|---|---|---|---|---|---|---|---|
| (J2000) | () | () | () | (′) | (°) | |||
| (1) | (2) | (3) | (4) | (5) | (6) | (7) | (8) | (9) |
| C1 | 36 | |||||||
| C2 | 146 |
Note. — Col. (1): cloud name. Col. (2): right ascension and declination of the peak (J2000). Col. (3): average heliocentric velocity of integrated spectral profile from Figure 8. Col. (4): profile width, measured at 50% of the integrated spectral profile peak and corrected for instrumental effects assuming that unbroadened profile is gaussian. Col. (5): total flux of integrated spectral profile. Col. (6): maximum linear extent of region with in the total intensity maps (Figs 6a and 7a). Col. (7): position angle at which was measured. Col. (8): base 10 logarithm of total H I mass, computed using via eq. 2. Col. (9): base 10 logarithm of the dynamical mass, computed using and via eq. 3.