Broad-band X-ray spectral evolution of GX 339–4 during a state transition ††thanks: Based on observations with INTEGRAL, an ESA project with instruments and science data centre funded by ESA member states (especially the PI countries: Denmark, France, Germany, Italy, Switzerland, Spain), Czech Republic and Poland, and with participation of Russia and the USA.
Abstract
We report on X-ray and soft -ray observations of the black-hole candidate GX 339–4 during its 2007 outburst, performed with the RXTE and INTEGRAL satellites. The hardness-intensity diagram of all RXTE/PCA data combined shows a q-shaped track similar to that observed in previous outbursts.The evolution in the diagram suggested that a transition from hard-intermediate state to soft-intermediate state occurred, simultaneously with INTEGRAL observations performed in March. The transition is confirmed by the timing analysis presented in this work, which reveals that a weak type-A quasi-periodic oscillation (QPO) replaces a strong type-C QPO. At the same time, spectral analysis shows that the flux of the high-energy component shows a significant decrease in its flux. However, we observe a delay (roughly one day) between variations of the spectral parameters of the high-energy component and changes in the flux and timing properties. The changes in the high-energy component can be explained either in terms the high-energy cut-off or in terms of a variations in the reflection component. We compare our results with those from a similar transition during the 2004 outburst of GX 339–4.
keywords:
X-ray: binaries – accretion: accretion discs – black hole: physics – stars: individual: GX 339–41 Introduction
Since its discovery Markert et al. (1973), the black-hole candidate (BHC) GX 339–4 has been observed to spend long periods in outburst. Although historically it was found to be mainly in the hard state (Maejima et al. 1984; Ilovaisky et al. 1986; Miyamoto et al. 1991), since the launch of RXTE the source has been monitored and complete sets of transitions have been observed and studied (Belloni et al. 2005; Zdziarski et al. 2004; Del Santo et al. 2008). Unlike the BHC prototype Cyg X–1, for which spectral state transitions are directly correlated with luminosity, GX 339–4 shows hysteresis in its relation between X-ray luminosity and spectral state Zdziarski & Gierliński (2004), as also observed in other BHC in low-mass binary systems (LMXB; Maccarone & Coppi 2003; Smith, Heindl & Swank 2002). It was observed that hard-to-soft state transitions during the rise phase occurs at higher luminosities than the soft-to-hard transitions during the decline phase (Smith, Heindl & Swank 2002; Zdziarski et al. 2004).
CGRO, Ginga and RXTE data from GX 339–4 collected in the period 1987-2004 have been analysed by Zdziarski et al. (2004). These authors reported on long term variability and spectral correlations for the 15 outbursts of GX 339–4 that occurred in this period. Furthermore, in that work a lower limit for the source distance at 7 kpc was provided.
The 2002/2003 outburst (Smith et al. 2002a; Nespoli et al. 2003; Buxton & Bailyn 2004) was followed with RXTE in detail through timing and hardness-ratio (HR) analysis Belloni et al. (2005). These authors described hysteresis in term of the source’s evolution through a hardness-intensity diagram (HID). Belloni et al. (2005) also introduced new definitions for the different sub-states observed during state transitions: the hard-intermediate (HIMS) and the soft-intermediate states (SIMS; see also Homan & Belloni 2005; Belloni 2005). For a description of historical and alternative states classification see Tanaka & Lewin (1995), van der Klis (1995) and a more recent review by McClintock & Remillard (2006).
During the 2002/2003 outburst, close to the transition to the SIMS (on 2002 May 17th Smith et al. 2002b ), a rapid (hours) bright radio flare was observed Fender et al. (2002) which led to the formation of a large-scale relativistic jet Gallo et al. (2004). Fender, Belloni & Gallo (2004) associated this flare and subsequent matter ejections with the crossing of the so-called jet-line, i.e. the HIMS-SIMS transition as reported by Nespoli et al. (2003). During this HIMS-SIMS transition GX 339–4 showed fast changes in its timing properties, but almost none in the 3-20 keV energy spectrum Homan et al. (2005).
In February 2004 a new outburst started, which reached a significantly lower peak flux than the 2002/2003 outburst (Buxton et al. 2004; Smith et al. 2004; Belloni et al. 2004; Kuulkers et al. 2004). To get broad-band coverage during the expected HIMS-SIMS spectral transition, simultaneous RXTE and INTEGRAL observations were made. Belloni et al. (2006) combined data from PCA, HEXTE and IBIS, and obtained good quality broad-band (3-200 keV) energy spectra before and soon-after the transition. These spectra indicated steepening of the hard, high-energy component. Also, the high-energy cut-off that was present at 70 keV before the transition was not detected later. Therefore, although spectral parameters at lower energies do not change abruptly through the transition, the energy of the cut-off increases or disappears rather fast (within 10 hours). The power spectra before and after the transition showed significant differences (see Belloni et al. 2005; Belloni 2008): from strong band-limited noise and type-C QPO to much weaker noise and type-B QPO (for a description of the properties of different types of QPO, see Casella, Belloni & Stella 2005).
In 2006 RXTE monitoring of GX 339–4 revealed low-level X-ray activity (Bezayiff & Smith 2006; Swank et al. 2006) until December, when a new strong outburst started Krimm et al. (2006). Miller et al. (2007) triggered a public INTEGRAL ToO campaign on GX 339–4 which started on January 30th (Caballero-Garcia et al. 2007a-e). We activated our RXTE campaign with the aim to follow the source through a HIMS-SIMS transition. Unfortunately, we did not observe the main transition, as we did in 2004, but managed to capture a secondary transition. In this paper, we report the results of the timing and spectral analysis of our RXTE data from 2007 March 4–6 and of the quasi-simultaneous interval of the INTEGRAL public data.
| Interval | INTEGRAL | RXTE | |||||
|---|---|---|---|---|---|---|---|
| Start (UT) | End (UT) | SCWs interval† | Exp. | Start (UT) | End (UT) | Exp. | |
| March 4 (17:51) | March 4 (23:06) | 10-16 | 17.9 ks | March 4 (16:45:36) | March 4 (17:57:04) | 3.7 ks | |
| March 4 (23:08) | March 5 (21:09) | 17-45 | 73.5 ks | March 5 (13:22:40) | March 5 (14:18:40) | 3.1 ks | |
| March 5 (21:35) | March 6 (13:04) | 46-65 | 52.4 ks | March 6 (12:40:16) | March 6 (13:51:44) | 3.9 ks | |
INTEGRAL Science Windows are tagged by a number indicating the related orbit as well as the pointing internal to it. Here we show the interval of the used pointings.

2 Observations and data analysis
In order to follow the new outburst of GX 339–4 at high energies, an INTEGRAL ToO campaign was carried out. Starting from 2007 January 30 (MJD 54130), six observations of 130 ks each (spaced by two weeks) were planned Miller et al. (2007). A total number of 255 pointings (5 observations), referred to as “science windows” (SCW), lasting each roughly 2500 seconds, were performed. These observations covered a two month period starting from INTEGRAL revolution (rev) 525 until rev 544. Our analysis focused on ISGRI Lebrun et al. (2003), the low energy detector layer of the coded mask imager, IBIS Ubertini et al. (2003). Fig. 1 shows the ISGRI light curve of the full INTEGRAL campaign. We report here on a short time interval, 56 SCWs of the orbit 536 (indicated in Fig. 1), during which the transition occurred (Tab. 1).
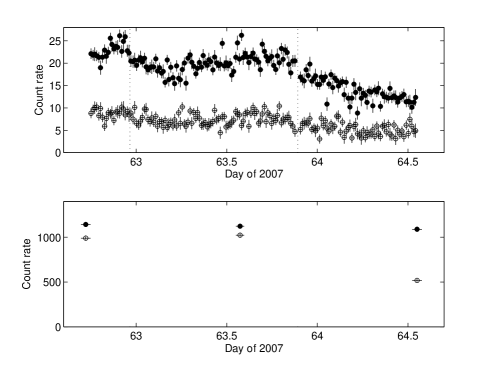
The IBIS/ISGRI scientific analysis was performed using the INTEGRAL off-line analysis software, OSA 7.0. The total ISGRI light-curve with a bin size equal to the duration of the SCW was obtained by extracting counts rate of GX 339–4 from images (Fig. 1). In Figure 2 (top) we show the ISGRI light-curves of rev 536 in the energy ranges 20-40 keV and 40-80 keV. These count rates in a bin size of 1000 seconds have been obtained with the OSA tool ii_lc_extract. Spectra were extracted from each pointing with the ii_spectra_extract script in 35 logarithmic energy bins spanning from 20 keV to 1 MeV. These IBIS/ISGRI spectra were averaged in three groups (Tab. 1) and 1.4% of systematic errors were added.
In 2007, the RXTE campaign on GX 339–4 consisted of a large number of observations covering the full outburst (Motta et al. 2008). For this work, we isolated three pointings overlapping with the INTEGRAL observation periods (see Tab. 1 and Fig. 2, bottom). We extracted PCA and HEXTE energy spectra (background and deadtime corrected) from each of the three observations using the standard RXTE software within HEASOFT V. 6.4, following the standard extraction procedures. For spectral analysis, only PCU2 from the PCA and Cluster B from HEXTE have been used. A systematic error of 0.6% has been added to the PCA spectra to account for residual uncertainties in the instrument calibration. We accumulated background-corrected PCU2 rates in the channel111corresponding to the original 0–128 channels bands = 6–48 (2.5–20.2 keV), = 6–14 (2.5–6.1 keV) and = 23–44 (9.4–18.5 keV). is the total rate, while the hardness was defined as (see Homan & Belloni 2005). For the timing analysis of the PCA data we produced power spectra from 16-s stretches accumulated in the channel band 0–35222corresponding to the original 0–255 channels (2–15 keV) with a time resolution of 1/128 s. This resulted in spectrograms of 243, 201 and 253 power spectra for the three observations, respectively (see Nespoli et al. 2003). The power spectra were normalised according to Leahy et al. (1983) and converted to squared fractional rms (Belloni & Hasinger 1990). For different time selections (see below), we averaged the power spectra and subtracted the contribution due to Poissonian noise (see Zhang et al. 1995). The timing analysis was performed with custom software.
3 Results
3.1 Evolution and timing analysis
GX 339–4 light curves collected with the high-energy instruments, IBIS/ISGRI and HEXTE (Fig. 2), show a count rate decrease by about a factor of two from March 4.7 to 6.6 (days 62.7 to 64.6 of 2007). Note that the IBIS count rate in the low/hard state at the beginning of the outburst (30th January) was much higher (see Fig. 1). Based on time averaged count rates, we divided the IBIS data in three groups, referred to as , and (Tab. 1, Fig. 2). In the energy range 20–40 keV, we measured variations between groups and , and between and , of about 25% and 32%, respectively. Variations within each group are less than 15%. At low energies (2.5–20.2 keV), however, the three PCA pointings show almost constant count rates, suggesting that a transition occurred between groups and .
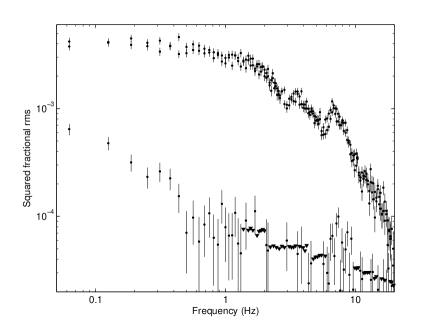
Timing analysis confirms this suggestion. The power density spectra (PDS) corresponding to the PCA data of the three RXTE observations indicate that observations and are very similar, while observation is different (see Fig. 3). The PDS of the former features band-limited noise and a quasi-periodic oscillation (QPO) around 7 Hz, i. e. type-C QPOs, with a Q factor (defined as the ratio of the centroid frequency of the QPO by its FWHM) around 2.5. The total integrated 0.1–64 Hz fractional rms is 12% (in 2–15 keV). The PDS of observation corresponds to much weaker variability (2.4%) with a hint of a broad excess around 8 Hz, possibly a type-A QPO (Q3). These results indicate that observations and correspond to a HIMS, while observation corresponds to a SIMS.
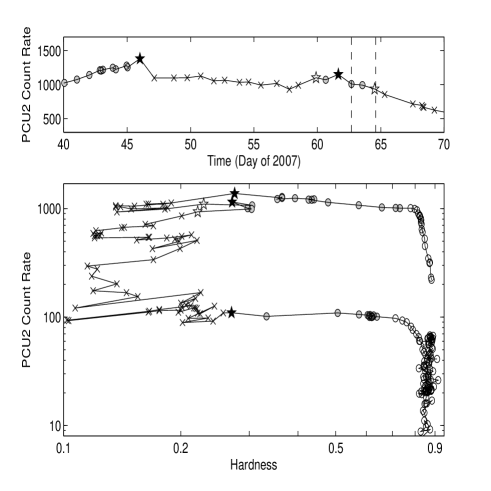
In addition to our observations, the outburst has been followed in detail with a public RXTE program, leading to a good coverage of the full outburst. In order to describe the global behaviour of GX 339–4 in 2007, we show in Figure 4 (bottom) the HID of all available data, together with the PCU2 light curve (Fig. 4, top) spanning the one-month period encompassing our INTEGRAL observations. The symbols in Fig. 4 indicate different shapes of the power density spectra (see below; a full spectral/timing analysis will be presented in a forthcoming paper).
Comparing this diagram with the HIDs previously reported for the 2002/2003 and 2004 outbursts (Belloni et al. 2005; Belloni et al. 2006), we note a similar q-shaped track pattern as described in Homan & Belloni (2005; see also Belloni 2008). Between day 45 and day 46, a HIMS to SIMS transition occurred (Motta et al. 2008). Moreover, at the beginning of March GX 339–4 displayed additional HIMS/SIMS transitions, as indicated by switches between various types of low-frequency QPOs (see Figures 3 and 4). From the symbols in Fig. 4 we can see that the observed sequence C-C-B corresponds to the transition that occurred earlier (days 45/46), while the transition reported here corresponds to the QPO sequence C-C-A (days 62.7/64.6). These last three RXTE observations have been performed simultaneously with INTEGRAL (see Fig. 2).
3.2 Spectral analysis
We performed a broad-band spectral analysis of data collected with three different instruments: PCA (3–20 keV), HEXTE (20–90 keV) and IBIS/ISGRI (20–200 keV). Spectra were combined according to the intervals defined in Section 3.1 (see Tab. 1 and Fig. 2). XSPEC version 11.2.3 was used for spectral fits.
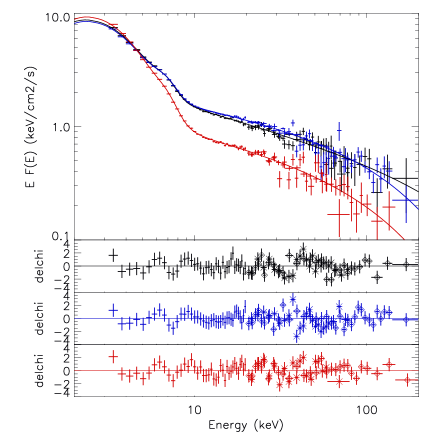
A simple model consisting of multi-color disc-blackbody (diskbb) plus a cut-off power law (cutoffpl) was used to fit spectra shown in Fig. 5. The hydrogen column density measured with instruments having a low-energy coverage, e.g. Chandra, was taken into account by adding a wabs component to the model and freezing =5 cm-2 (Méndez & van der Klis 1997; Kong et al. 2000). An Iron emission line with centroid fixed at 6.4 keV was needed to obtain good fits. To account for cross-calibration problems, multiplicative constants of 0.9 and 1.1 for the HEXTE and IBIS/ISGRI spectra (as compared to the PCA) were added to the fits. The above model resulted in good fits (see Tab.2). Leaving the high energy cut-off out of the model did not yield acceptable values.
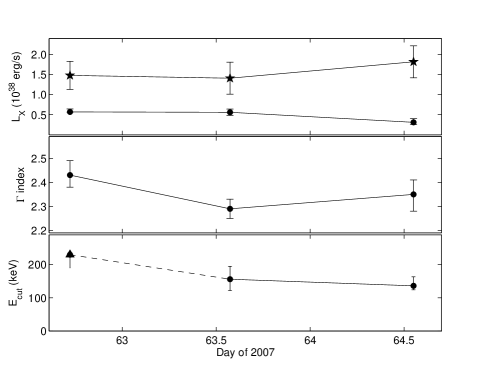
At low energies we found the disc temperature (kTbb) and inner radius to remain constant within the errors (90% confidence). However, variations in the high-energy component included a decrease of the power-law index (Fig. 6, middle) and the high-energy cut-off (Fig. 6, bottom) between period and .
Taking the best-fit values of radius and inner disc temperature (Tab. 2), we estimate the bolometric luminosity of the disc component as 1.5, 1.4 and 1.8 erg s-1 for the three time intervals, respectively (Fig. 6, top; stars). While the disk flux increases by a factor of only 1.3, the decrease in the high-energy component luminosity is about a factor of 1.8 (from 5.7 to 3.1 erg s-1) from period to (Fig. 6, top; filled circles). The latter seems to be mostly the result of the decrease in the power-law normalisation, instead of the variation of the cut-off.
Based on observations performed in 2004 Del Santo et al. (2008), we investigated a possible second non-thermal component, partially responsible for the high-energy spectra in HIM state. Due to the short exposure time and statistics (spectra up to 200 keV), we did not manage to constrain parameters of an additional power-law on a thermal Comptonization component, as in Del Santo et al. (2008).
A further scenario is suggested by the presence of the iron emission line. We tried to model the high-energy component of our spectra with an exponentially cut-off power-law reflected from neutral material (pexrav, Magdziarz & Zdziarski 1995). While the disc temperature is consistent with the previous model, the high energy component is significantly different (Tab. 3). With the addition of a reflection component, we cannot constrain the high energy cut-off, neither derive a lower limit. Moreover, the reflection component becomes significant in the intervals and .
4 Discussion
Comparing the 2007 outburst of GX 339–4 with previous outbursts (from 2002/2003 and 2004) in terms of their HID tracks (see Fig. 2 in Belloni et al. 2006), we see similar q-shaped tracks Homan & Belloni (2005). The count rate level of the upper horizontal branch in the 2007 is slightly higher than that of 2002/2003, and well above the one of 2004 (more than a factor of 3). The evolution of states throughout the outburst, as estimated from the timing properties, is also very similar to the previous ones. The HIMS-SIMS transition on the upper branch takes place at a similar color as the secondary transition described in this work.
On 2007 March 4-6, we have observed a “mini-transition” from the HIMS to SIMS in GX 339–4, which occurred on a secondary horizontal branch of the q-track (Fig. 4). During this secondary transition, clearly marked by changes in the properties of fast aperiodic timing (from band-limited noise and type-C QPO to power-law noise and a weak type-A QPO), an important change in the power-law flux component was observed. This seems to be consistent with results from Nespoli et al. (2003) and Belloni et al. (2005) suggesting that power-law flux and timing are tightly correlated during the fast transitions.
Moreover, a change in the high energy cut-off and photon index appeared between the two HIMS observations rather than between the HIMS and the SIMS. During this secondary transition we observed a slight delay between variations of the spectral parameters and the ones of the hard-X flux and timing properties.
The power-law with high energy cut-off () is a simple model to describe thermal Comptonization of soft photons by a hot electron plasma. A decrease in may indicate the cooling of the electrons plasma, possibly causing the energy reservoir for thermal Comptonization to go down. The increase of disc luminosity causing the cooling of the hot corona is usually observed in hard-to-soft state transitions of BHC (Zdziarski & Gierliński 2004; Del Santo et al. 2005; Del Santo et al. 2008). During the SIM state described in this work, we found indications for a slight increase (a factor of 1.3) in the disc flux, simultaneously with a decrease of the high energy flux by a factor of two.
An alternative scenario for explain the delay between cut-off and flux changes, involves the presence of a second, possibly non-thermal, source of high-energy photons. As the corona cools (between intervals and ), the second high energy component continues to be responsible for most of the flux. After the transition HIMS-to-SIMS this second component disappears, resulting in a decrease of the high energy flux.
In 2004, the major HIMS to SIMS transition on the primary horizontal branch was simultaneously observed with INTEGRAL and RXTE Belloni et al. (2006). After the transition, these authors report on the lack of the high energy cut-off in the SIMS (present at 70 keV in the HIMS). Del Santo et al. (2008) confirm the latter result (disappearance of the cut-off in the SIMS) by using simultaneous IBIS, SPI and JEM-X data collected during the same transition. However they found a higher value of the cut-off in that same HIM state ( keV) because of new INTEGRAL calibrations. Here, we observe a secondary HIMS-to-SIMS transition with a different behaviour: during the transition the high-energy cut-off has moved to a lower energy. Moreover, this variation is observed to take place before the transition as deduced from the timing properties, although we cannot exclude additional very fast timing transitions between the three intervals.
Also, a fit with a pexrav model fails to measure a significant cut-off for any of the intervals examined here. In this scenario the spectral changes observed between intervals and could be due to the appearance of the Compton reflection component. The increase of the reflection component, as the spectrum becomes softer, is expected in the truncated disc model Done et al. (2007).
In summary, the transitions observed in 2004 and 2007 display different properties at high energies. Other differences which might play a role are:
-
•
the 2004 outburst peaked at a considerably lower luminosity (and count rate) than that of 2007;
-
•
the transition in 2004 corresponded to the main transition from hard to soft, while in 2007 we observed a secondary transition;
-
•
after the transition, in 2004 a type-B QPO was observed, while in 2007 a type-A QPO was observed.
These observations clearly indicate that the properties of the high-energy component(s) in the spectrum of GX 339–4 during a HIMS-to-SIMS transition are complex. Del Santo et al. (2008) analysed a uniform INTEGRAL data-set collected during the 2004 outburst, including the fast transition presented in Belloni et al. (2006). These authors report on different state transitions: HIMS-to-SIMS-to-HSS. All these transitions, occurring when GX 339–4 was going forward (from right to left) on the main horizontal branch, have been explained as being driven by increase of the soft cooling photon flux in the corona. The transition HIMS-to-SIMS presented in this work (in 2007) occurred on the secondary-branch of the q-pattern and showed different behaviour, even though it occurred at same color as the 2004 transition.
In conclusion, we still do not have a complete picture of the evolution of the hard spectral component during the whole transition LHS to HSS. More coordinated observations, such as those presented here, are needed.
Acknowledgments
MDS is supported by the Italian Space Agency (ASI), via contract INTEGRAL I/008/07/0. MDS thanks Julien Malzac for useful scientific discussion. As one of the thousands Italian researchers with a long-term temporary position, MDS acknowledges the support of Nature (455, 835-836) and thanks the Editors for increasing the international awareness of the current critical situation of the Italian Research. MDS and AB aknowledges the INTEGRAL data archival support at IASF-Roma by Memmo Federici. TMB acknowledges support from the International Space Science Institute (ISSI) and from ASI via contract I/088/06/0. We thank J. Miller et al. for immediately making the data from their INTEGRAL program publicly available.
References
- Belloni (2005) Belloni T., 2005, in Proc. of COSPAR Colloquium “Spectra and Timing of Compact X-Ray Binaries”, Mumbai, India, in press (astro-ph/0507556)
- Belloni (2008) Belloni T., 2008, in “The jet paradigm: from microquasars to quasars”, Ed. T. Belloni, Springr, in press.
- (3) Belloni T., Hasinger G., 1990, A&A, 230, 103
- (4) Belloni T., van der Klis M., Lewin W.H.G., van Paradijs J., Dotani T., Mitsuda K., Miyamoto S., 1997, A&A, 322, 857
- Belloni et al. (2004) Belloni T., Homan J., Cui W., Swank J., 2004, ATel #236
- Belloni et al. (2005) Belloni T., Homan J., Casella P., van der Klis M., Nespoli E., Lewin W. H. G., Miller J. M., Méndez, M., 2005, A&A, 440, 207
- Belloni et al. (2006) Belloni T., Parolin I., Del Santo M., et al., 2006, MNRAS, 367, 1113
- Bezayiff & Smith (2006) Bezayiff N., & Smith D. M., 2006, ATel #707
- Buxton & Bailyn (2004) Buxton M., Bailyn C., 2004, ATel, #270
- Buxton et al. (2004) Buxton M., Gallo E., Fender R. P., Bailyn C., 2004, ATel, #230
- (11) Caballero-Garcia M. D., Miller J., Kuulkers E., Diaz Trigo M., et al., 2007a, ATel #1000
- (12) Caballero-Garcia M. D., Miller J., Kuulkers E., Diaz Trigo M., et al., 2007b, ATel #1012
- (13) Caballero-Garcia M. D., Miller J., Kuulkers E., Diaz Trigo M., et al., 2007c, ATel #1029
- (14) Caballero-Garcia M. D., Miller J., Kuulkers E., Diaz Trigo M., et al., 2007d, ATel #1032
- (15) Caballero-Garcia M. D., Miller J., Kuulkers E., Diaz Trigo M., et al., 2007e, ATel #1050
- (16) Casella, P., Belloni, T., Stella, L., 2005, ApJ, 629, 403
- Del Santo et al. (2005) Del Santo M., Bazzano A., Zdziarski A. A., et al., 2005, A&A, 433, 613
- Del Santo et al. (2008) Del Santo M., Malzac J., Jourdain E., Belloni T., & Ubertini P., 2008, MNRAS, in press (astro-ph/0807.1018)
- Done et al. (2007) Done C., Gierliński M., Kubota A., 2007, A&AR, 15, 1
- (20) Fender R.P. Belloni T., Gallo E., 2004, MNRAS, 355, 1105
- Fender et al. (2002) Fender R.P., Corbel S., Tzioumis T., Tingay S., Brocksopp C., Gallo E., 2002, ATel, #107
- Gallo et al. (2004) Gallo E., Corbel S., Fender R.P., Maccarone T.J., Tzioumis A.K., 2004, MNRAS, 347, L52
- (23) Grove J.E., Johnson W.N., Kroeger R.A., McNaron-Brown K., Skibo J.G., Phlips B. F., 1998, ApJ, 500, 899
- Homan & Belloni (2005) Homan J., Belloni T., 2005, in T. J. Maccarone, R. P. Fender, L. C. Ho eds, “From X-ray Binaries to Quasars: Black Hole Accretion on All Mass Scales”, Ap&SS, 300, 107
- Homan et al. (2005) Homan J., Buxton M., Markoff S., Bailyn C.D., Nespoli E., Belloni T., 2005, ApJ, 624, 259
- (26) Ilovaisky S.A., Chevalier C., Motch C., Chiappetti L., 1986, A&A, 164, 67
- Kong et al. (2000) Kong A.K.H., Kuulkers E., Charles P.A., Smale A.P., 2000, MNRAS, 311, 405
- Krimm et al. (2006) Krimm H. A., Barbier L., Barthelmy S. D., 2006, ATel #968
- Kuulkers et al. (2004) Kuulkers E., Bodaghee A., Foschini L., et al., 2004, ATel, #240
- (30) Leahy D.A., Darbro W., Elsner R.F., Weisskopf M.C., Kahn S., Sutherland P.,G., Grindlay J.E., 1983, ApJ, 266, 160
- Lebrun et al. (2003) Lebrun F., Leray J. P., Lavocat P., et al., 2003, A&A, 411, L141
- (32) Maccarone T., Coppi P., 2003, MNRAS, 338, 189
- (33) Maejima Y., Makishima K., Matsuoka M., Ogawara Y., Oda M., Tawara Y., Doi K., 1984, ApJ, 285, 712
- Magdziarz & Zdziarski (1995) Magdziarz P., Zdziarski A. A., 1995, MNRAS, 273, 837
- Markert et al. (1973) Markert T. H., Canizares C. R., Clark G. W., Canizares C. R., Clark G. W., Lewin W. H. G., Schnopper H. W., Sprott G. F., 1973, ApJ, 184, L67
- (36) McClintock J. E., Remillard R. A., 2006, in “Compact stellar X-ray sources”, W. H. G. Lewin & M. van der Klis Eds., Cambridge University Press
- Méndez & van der Klis (1997) Méndez M., van der Klis M., 1997, ApJ, 479, 926
- Miller et al. (2007) Miller J. M., Kuulkers E., Caballero-Garcia M. D., et al., 2007, ATel #980
- (39) Miyamoto S., Kimura K., Kitamoto S., Dotani T., Ebisawa K., 1991, ApJ, 383, 784
- (40) Motta S., et al., 2008, in prep.
- Nespoli et al. (2003) Nespoli E., Belloni T., Homan J., Miller J. M., Lewin W.H.G., Méndez M., van der Klis M., 2003, A&A, 412, 235
- (42) Smith D. M., Heindl W. A., Swank J. H., 2002, ApJ, 569, 362
- (43) Smith D. M., Swank J. H., Heindl W. A., Remillard R. A., 2002a, ATel, #85
- Swank et al. (2006) Swank J. H., Smith E. A., Smith D. M., Markwardt C. B., 2006, ATel #944
- (45) Smith D. M., Belloni T., Heindl W. A., Kalemci E., Remillard R., Nowak M., Swank J. H., Corbel S., 2002b, Astron. Telegram, 95
- Smith et al. (2004) Smith D. M., Heindl W. A., Swank J. H., Wilms J., Pottschmidt K., 2004, ATel, #231
- (47) Tanaka Y., Lewin W. H. G., 1995, in “X-ray Binaries”, Cambridge Astrophysics Series (Cambridge, MA: Cambridge Univ. Press), ed. W. H. G. Lewin, J. van Paradijs & E. P. H. van den Heuvel, 126
- Ubertini et al. (2003) Ubertini P., Lebrun F., Di Cocco G., et al., 2003, A&A, 411, L131
- (49) van der Klis M., in “X-ray Binaries”, Cambridge Astrophysics Series (Cambridge, MA: Cambridge Univ. Press), ed. W. H. G. Lewin, J. van Paradijs & E.P.H. van den Heuvel, 252
- Zdziarski et al. (2004) Zdziarski A. A., Gierkiński M., Mikołajewska J., Wardzinski G., Smith D. M., Harmon B. A., Kitamoto S., 2004, MNRAS, 351, 791
- Zdziarski & Gierliński (2004) Zdziarski A. A., Gierliński M., 2004, Progress of Theoretical Physics Supplement, 155, 99
- (52) Zhang W., Jahoda K., Swank J. H., Morgan E. H., Giles A. B., 1995, ApJ, 449, 930
| Interval | Disc blackbody | Cut-Off power-law | (d.o.f.) | ||||
|---|---|---|---|---|---|---|---|
| kT [keV] | Rin [km] | Fd [erg cm-2s-1] | Ec [keV] | Fp [erg cm-2s-1] | |||
| 0.84 | 48 | 4.2 | 2.43 | 230 | 7.5 | 1.07(99) | |
| 0.83 | 48 | 4.3 | 2.29 | 156 | 7.4 | 0.99 (99) | |
| 0.85 | 52 | 5.5 | 2.35 | 136 | 4.1 | 1.06 (99) | |
| Interval | kT [keV] | / | (d.o.f.) | |
|---|---|---|---|---|
| 1.09(98) | ||||
| 0.4 | 1.10(98) | |||
| 1.0(98) |