Giant Chromospheric Anemone Jet observed with Hinode and Comparison with Magnetohydrodynamic Simulations: Evidence of Propagating Alfvn Waves and Magnetic Reconnection
Abstract
Hinode discovered a beautiful giant jet with both cool and hot components at the solar limb on 2007 February 9.
Simultaneous observations by the Hinode SOT, XRT, and TRACE 195 satellites revealed that hot
( K) and cool ( K) jets were located side by side and that the hot jet preceded the
associated cool jet ( min.). A current-sheet-like structure was seen in optical (Ca II H),
EUV (195 ), and soft X-ray emissions, suggesting that magnetic reconnection is occurring in the transition region
or upper chromosphere. Alfvn waves were also observed with Hinode SOT. These propagated along
the jet at velocities of km s-1 with amplitudes (transverse velocity) of
5-15 km s-1 and a period of .
We performed two-dimensional MHD simulation of the jets on the basis of the emerging flux - reconnection model,
by extending Yokoyama and Shibata’s model. We extended the model with a more realistic initial condition
( K corona) and compared our model with multi-wavelength observations.
The improvement of the coronal temperature and density in the simulation model allowed for the first time
the reproduction of the structure and evolution of both the cool and hot jets quantitatively, supporting the magnetic
reconnection model. The generation and the propagation of Alfvn waves are also reproduced
self-consistently in the simulation model.
1 Introduction
The solar chromosphere has been known to be very dynamic (e.g., Bray & Loughhead, 1974; Zirin, 1988). However, recent Hinode observations (Kosugi et al., 2007) revealed that it is even more dynamic than previously thought (Shibata et al., 2007; Katsukawa et al., 2007; Cirtain et al., 2007)(see also special issue, Initial Results from Hinode, 2007, PASJ, Vol. 59, No. SP3). It has long been observed that H jets called surges often occur in the chromosphere (see e.g. Rust, 1967; Kurokawa & Kawai, 1992). Surges are believed to be produced by magnetic reconnection (Heyvaerts et al., 1977; Yokoyama & Shibata, 1995, 1996; Isobe et al., 2005), which is an energy conversion mechanism from magnetic energy into thermal and kinetic energies of plasma when two anti-parallel magnetic fields encounter and reconnect with each other. New chromospheric observations with the calcium II H-line broad band filter of the Solar Optical Telescope (SOT; Tsuneta et al., 2008) on board Hinode revealed that jets are ubiquitous in the chromosphere and some of the jets show evidence of magnetic reconnection (Shibata et al., 2007; Katsukawa et al., 2007).
There have been several multi-wavelength observations of jets (e.g. X-ray and H (Schmieder et al., 1995; Canfield et al., 1996), H and EUV (Chae et al., 1999; Jiang et al., 2007), and EUV and X-ray (Alexander & Fletcher, 1999)). These have shown that hot jets (X-ray or EUV jet) and cool jets (H surge or dark EUV jet) are almost co-spatial and co-temporal, and that they are dynamically connected to each other. Yokoyama and Shibata (1995, 1996) explained such a relation between hot and cool jets qualitatively by performing a resistive MHD simulation of an emerging flux model. However, their model was not fully realistic because of various computational difficulties; it was not possible to reproduce both emerging flux and jets self-consistently in one model, so they assumed an unrealistic initial temperature ( K) and density ( cm-3 corona) for the corona. Because of this, the coronal Alfvn speed in their model was lower than the actual value, so the jet velocity was also lower than the observed velocity of the H surge/jet. In this Letter, we succeed in modeling for the first time both the emerging flux and jet self-consistently with realistic coronal temperatures ( K) and densities and attempt to compare simulation results and observations quantitatively.
2 The 2007 February 9 Giant Ca Jet Event
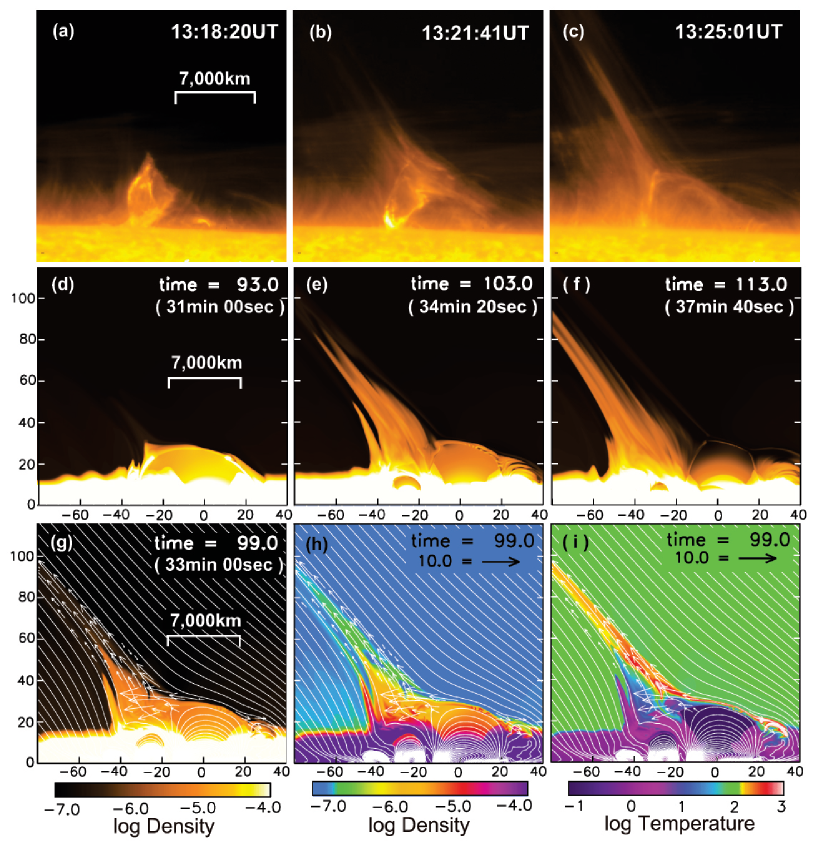
The solar jet studied here occurred on the west limb of the Sun around NOAA active region 10940 on 2007 February 9 at 13:20 UT, which was associated with a weak soft X-ray brightening observed in GOES. The maximum height of the jet was km and its width km. Figure 1a-1c shows Ca II H-line broad-band filter snapshot images taken with SOT on board Hinode, which provide a high spatial resolution (0.2” or 150 km on the solar surface) and stable observation of the photosphere and chromosphere. The cold plasma jet, which we call the Ca jet, began to be ejected upward with inclination angle of 45 degree at 13:18 UT. The jet grew up to a cusp- or inverted-Y shaped structure, whose morphology was similar to that of coronal anemone jets (Shibata et al., 1994). The maximum upward velocity occurred 10 minutes later at 13:30 UT (also see Fig.2a). The jet was accelerated to km s-1 along the field line. The cool plasma subsequently fell down with a decelerated free-fall motion.
Yohkoh observations have led to the interpretation of the anemone-shaped structure as a result of magnetic reconnection between an emerging magnetic bipole and a preexisting coronal uniform field (Shibata et al., 1992, 1994; Shimojo et al., 1996). This interpretation has been supported by magnetohydrodynamic (MHD) simulations of emerging flux (Heyvaerts et al., 1977; Yokoyama & Shibata, 1995, 1996; Isobe et al., 2005). By extending previous simulations the new simulations consider a more realistic initial condition, which allow a comparison with observations. 111 Initial coronal and chromospheric/photospheric temperatures are 100 and unity in unit of K, respectively, and plasma (= ratio of gas pressure to magnetic pressure) is 4 in the horizontal flux sheet just below the photosphere, 0.01-0.06 in the inner corona, and varies from 4 to 0.06 in the chromosphere/photosphere. Note that this simulation is based on an idealized model, in which there is no difference between chromosphere and photosphere in temperature. Numerical computation was carried out using the CIP-MOCCT scheme (Kudoh et al., 1999) with total grid points of (), whose grid size is 0.2 ( km) and uniform in the whole computational box. We assumed anomalous resistivity (Ugai, 1985), whose functional form is for and for , where , is the drift velocity, is the mass density, is the current density and is the threshold above which anomalous resistivity sets in. Typical magnetic Reynolds number at the location of reconnection is , where is the Alfvn speed just outside the current sheet, is the length of the current sheet, and is the magnetic diffusivity. The magnetic Reynolds number used in our simulation model is much lower than the actual number for solar corona, and the assumed functional form for the anomalous resistivity has not yet been physically established. However, it should be noted that this type of anomalous resistivity reproduce well the fast reconnection model (e.g., Ugai, 1985) and explosive energy release in solar flares (e.g., Yokoyama & Shibata, 1994). Our initial condition of the simulations is basically similar to that of Yokoyama & Shibata (1995), with the only difference being in coronal temperature and density; they were assumed to be K and cm-3 in the Yokoyama-Shibata model, but K and cm-3 in our model. Note that our coronal parameters are much more realistic than theirs.
As a result of our new two-dimensional MHD simulation, we found that a simulated jet is amazingly similar to the observed jet. The comparison among them is shown in Figure 1 (d-f are simulation results). These simulations are performed by solving the two-dimensional resistive MHD equations with uniform gravitational field and without thermal conduction and radiative cooling effects. We note that a jet is magnetically driven, not gas pressure driven, so the dynamics of the jet cannot be influenced by thermal conduction and radiative cooling effects even if the temperature is not fully realistic. We also note that evaporation effects due to thermal conduction are not included in our model, so the evaporation-driven X-ray jets (Shimojo et al., 2001; Miyagoshi & Yokoyama, 2004) cannot be modeled in the Letter. As an initial state, we set hydrostatic plasma in the corona (K), chromosphere/photosphere (K), and convection zone with a horizontal flux sheet just below the photosphere and a uniform oblique magnetic field outside the flux sheet in the whole region. This flux sheet is unstable for the magnetic buoyancy instability (the Parker instability; Shibata et al., 1989; Matsumoto et al., 1993), so the perturbed flux sheet is excited and emerges into the corona. While we performed a two-dimensional simulation, the emerging process of magnetic flux would actually become much more complex in three dimensions (see e.g. Fan, Abbett & Fisher, 2003; Isobe et al., 2005). In two dimensions, once reconnection occurs between the emerging flux and preexisting field, the field lines with a polarity opposite to that of the ambient field become connected to the ambient polarity regions, forming an inverted-Y shape or anemone jet. Because the time and spatial scales are arranged almost in the same way as in Figure 1a-c, the simulation model turns out to be able to explain observational facts very well. Reconnection creates multiple islands which confine cool, dense, chromospheric plasma in the current sheet, which are ejected at the Alfvn speed km s-1 (B/20G)(n/ cm50-150 km s-1 if we assume coronal field B20 G and density n cm-3 in the upper chromosphere, in agreement with the observations (shown in Fig.2a). These facts support a magnetic reconnection model. Note that, if reconnection occurs below the lower chromosphere, shocks are formed in front of a jet due to rapid decrease of plasma density (e.g., Shibata et al., 1982; Tarbell et al., 1999), which may eventually accelerate jets along magnetic field lines. However, in such a case, only cool jets are formed. In our case, it seems that reconnection occurred in the transition region or upper chromosphere, because not only cool jets but also hot jets are observed simultaneously (see section 3).
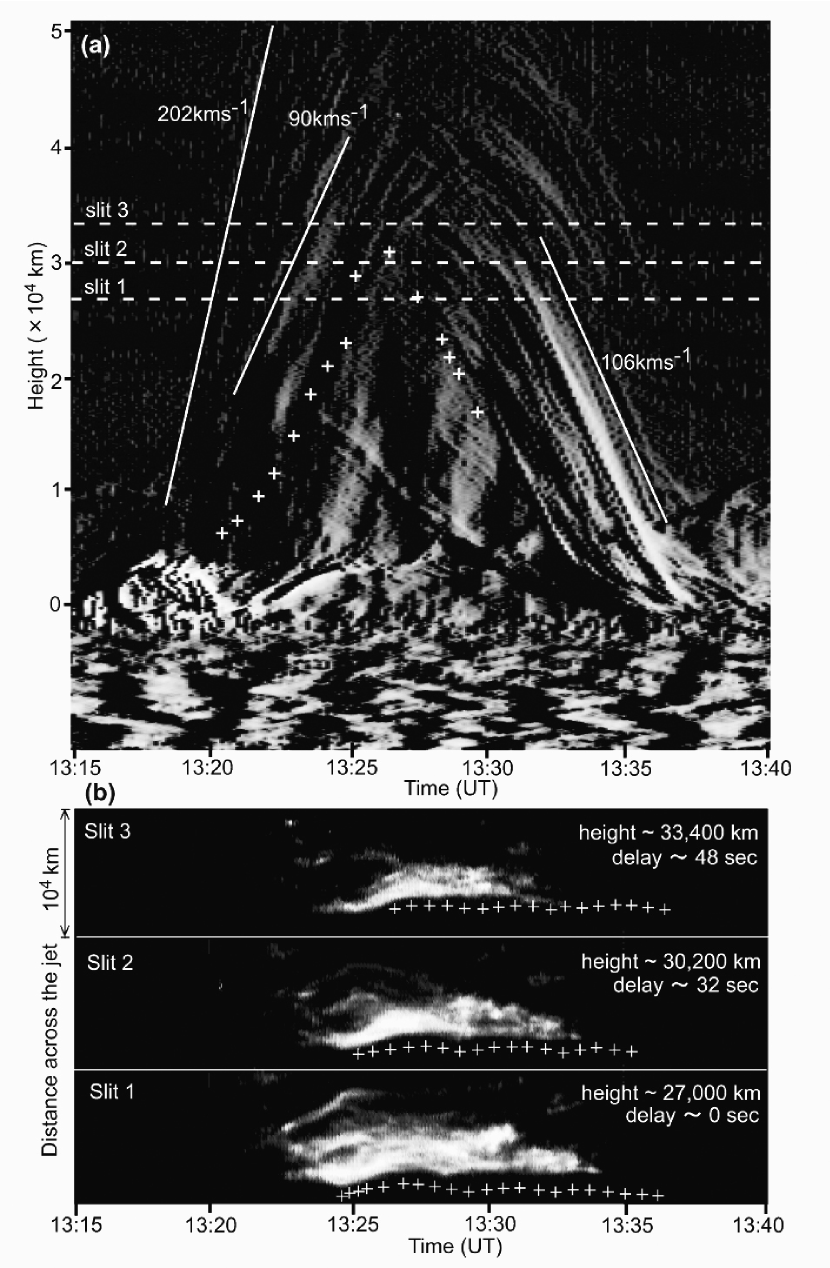
Figure 2b shows the distance-time diagram of the position of the Ca jet (as represented by Ca intensity distribution), which revealed the oscillation of the jet with amplitude of 5-15 km s-1 and period of 200 s. From the oscillation pattern at three different heights, we find that the oscillation propagates along the jet at 100-200 km s-1. Since the jet is believed to be along the magnetic field, the propagation of the oscillation is the evidence of the propagating Alfvn waves. The simulation model reproduced also the generation and propagation of Alfvn waves (see plus symbols in Fig. 2b). Hinode observations revealed the existence of Alfvn waves or Alfvn-like oscillation (Okamoto et al., 2007; De Pontieu et al., 2007), but propagating Alfvn waves have not been observed until now. Hence our observations are the first observational evidence suggesting the presence of propagating Alfvn waves.
3 Comparison between Hot/Cool components of the Jet and MHD simulation
Our simulation shows that both hot and cool jets can be accelerated simultaneously by magnetic reconnection driven by emerging flux, as in Yokoyama & Shibata (1995). The plasma in the corona is heated to temperatures from a few million K to about 10 million K. This hot plasma can be observed as microflares and soft X-ray jets. At the same time, cool jets are accelerated if the reconnection occurs in the transition region or in the upper chromosphere, where cool plasma is situated near the reconnection point. According to the model, X-ray or EUV jets are seen as hot jets that are accelerated by the magnetic tension force of the reconnected field lines, and H surges or Ca jets are seen as cool jets that are accelerated by the slingshot effect due to the reconnection, which produces a whiplike motion. Furthermore, if a large amount of energy is injected into the upper chromosphere, the cold plasma above the energy injection point is heated up and evolves into evaporation (Shimojo et al., 2001), although we cannot reproduce it because of the lack of thermal conduction in the energy equation. Such a coexistence of hot and cool jets is indeed confirmed by observations with the comparisons between associated X-ray or EUV jets and H surges (Schmieder et al., 1995; Canfield et al., 1996; Chae et al., 1999; Alexander & Fletcher, 1999; Ko et al., 2005; Jiang et al., 2007).
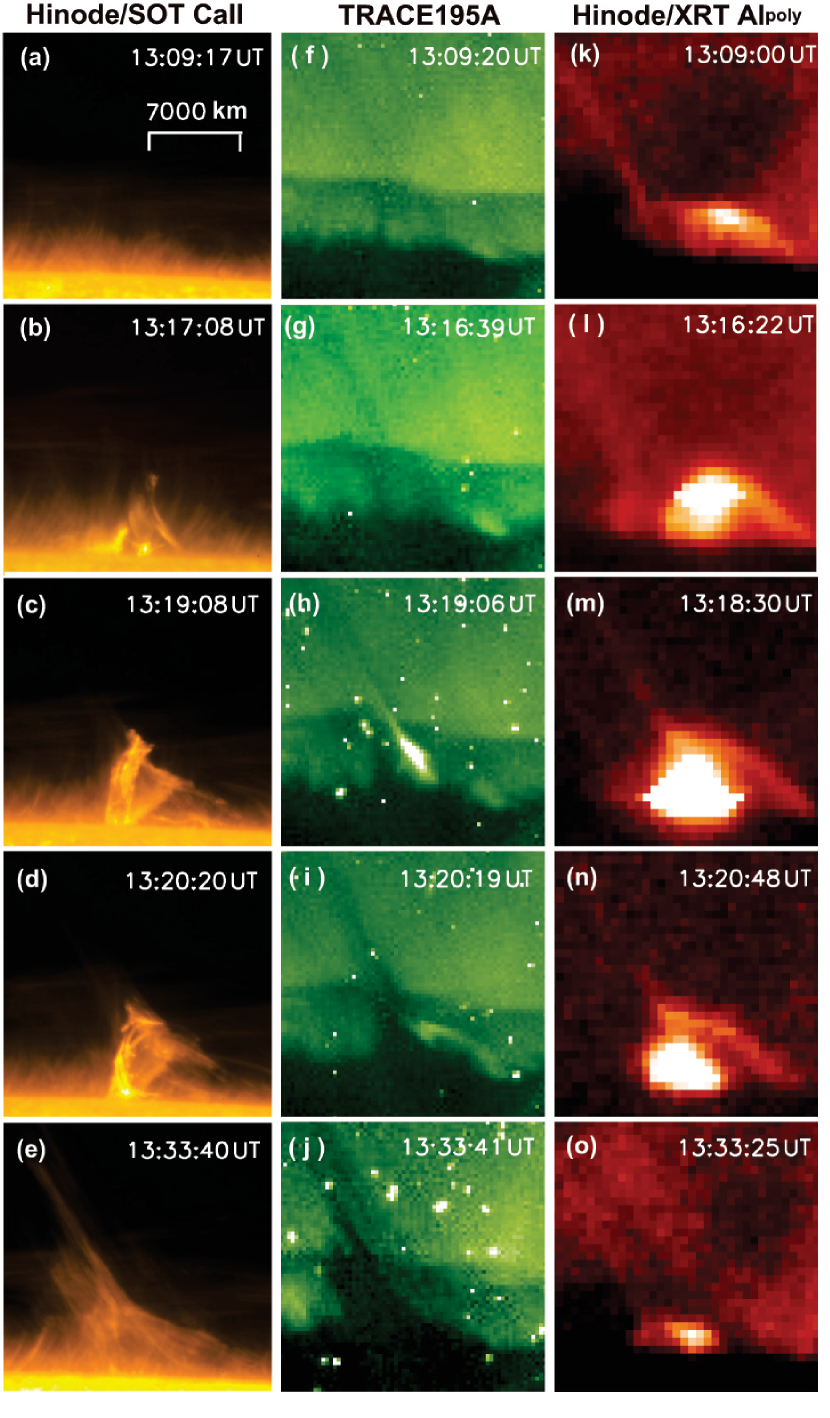
Figure 3a-o shows the time evolution images of the jet with multiwavelength observations taken with the SOT and X-Ray Telescope (XRT; Golub et al., 2007) aboard Hinode, and the Transition Region and Coronal Explorer (TRACE; Handy et al., 1999) 195 filter. An X-ray image before ejection shows a loop structure over the limb, at the footpoint of which a jetlike feature appeared at 13:09 UT, preceding other wavelengths. X-ray emission gradually increased its intensity and, just after 13:16 UT, an X-ray jet started to be ejected, and cusp- or inverted-Y shaped structure was formed. An EUV jet was ejected from a looplike bright emission patch at the moment when the patch reached its maximum intensity. The cold plasma ejection, such as the Ca jet and a dark EUV jet in absorption ( K), was delayed by 1-2 minutes relative to the X-ray and EUV brightening. The maximum upward velocity of the cool jets occurred about 10 minutes later than the X-ray spike (also see Fig.2a). As a result of spatial co-alignment, the EUV jet was identified with the X-ray jet, whereas the dark EUV jet appeared to be a counterpart to the Ca jet. The X-ray jet and the Ca jet were ejected side by side with each other, which is the same feature as shown in the simulation results of Figure 1i. These observational facts indicate the following three features: (1) The X-ray jet ( K) and the EUV jet ( K) are likely to have the same physical origin, and the Ca jet ( K) and the dark EUV jets (unknown temperature, K) also have the same origin. (2) The X-ray and the Ca jets are different kinds of plasma ejection, implying dynamically connected hot and cool plasma ejections along different field lines. (3) The X-ray jet precedes the Ca jet by 1-2 minutes compared with their maximum intensity time, and some hot structure was also observed with X-ray emission 10 minutes earlier than jet ejection.
We note that the delay of the cool jet may not be due to a cooling effect, because the delay time is much shorter than the cooling time. Furthermore our simulation without a cooling term reproduces both hot and cool jet very well. According to the simulation, the current sheet is formed between the corona (hot and thin plasma) and the emerging flux with chromospheric density and temperature (cool and dense plasma). Hence the reconnection is very asymmetric (Petschek & Thorne, 1967). In such a case, the low-density part becomes a hot and fast jet, while the high-density part forms a cool and slow jet, because the local Alfvn speed is high (low) in the low (high) density part. This is why a hot jet preceded a cool jet; i.e., the hot jet reaches higher altitude earlier than the cool jet.
4 Summary and Discussion
MHD simulation results (Fig.1d-i) reproduce remarkably well the dynamics and structure of cool and hot jets and their relative timings. The only structure that the simulations cannot explain is the existence of an X-ray bright point (probably an unresolved loop) in Fig.3m-o. However, MHD simulations in Figure 1 are two-dimensional, and hence discrepancy between observations and simulations may be explained by three-dimensional effects. In fact, the reconnection model (Yokoyama & Shibata, 1995, 1996; Shibata et al., 1992, 1994; Shimojo et al., 1996) predicts the formation of not only jets but also loops in a separated place, which can explain many X-ray observations showing that bright points (loops) are situated separately from jets (Shibata et al., 1992, 1994; Shimojo et al., 1996). In our case, such bright loops may be situated just in front of jets because of three-dimensional projection effects.
On the other hand, detailed comparison between simulations and observations suggests that the current sheet structure in Figure 1e may be visible as one of legs in the inverted-Y shaped structure. It is interesting to see that EUV and X-ray loops seem to be situated along the same leg, i.e., possibly corresponding to the current sheet.
We note here that an X-ray brightening at the footpoint cannot be seen in EUV emission but in absorption. This may be interpreted as either the three-dimensional effect that the EUV emission from the X-ray source is covered by cool plasma ejection or the temperature effect such that the temperature in the X-ray source is too high to emit enough EUV emission. (Note that usually X-ray loops cannot be seen in EUV images.)
It is also noted that both observations and simulations show the generation of Alfvn waves when magnetic reconnection occurs: the jet undergoes apparent motion perpendicular to the jet direction at amplitudes of 5-15 km s-1 (see Fig. 2b). This velocity is also comparable to that observed for polar X-ray jets (Cirtain et al., 2007). These Alfvn waves are generated by reconnection (Yokoyama, 1998; Takeuchi & Shibata, 2001), and may contribute to the heating and acceleration of solar wind when the magnetic field is open (Parker, 1988; Suzuki & Inutsuka, 2005).
References
- Alexander & Fletcher (1999) Alexander, D. & Fletcher, L. 1999, Sol.Phys., 190, 167
- Bray & Loughhead (1974) Bray, R. J. & Loughhead, R. E. 1974, The Solar Choromosphere (The international astrophysics series; London Chapman and Hall)
- Canfield et al. (1996) Canfield, R. C. et al., 1996, ApJ, 464, 1016
- Chae et al. (1999) Chae, J. et al., 1999, ApJ, 513, 75
- Cirtain et al. (2007) Cirtain, J. W. et al., 2007, Science, 318, 1580
- De Pontieu et al. (2007) De Pontieu et al., 2007, Science, 318, 1574
- Fan, Abbett & Fisher (2003) Fan, Y., Abbett, W. P. & Fisher, G. H. 2003, ApJ, 582, 1206
- Golub et al. (2007) Golub, L. et al., 2007, Sol.Phys., 243, 63
- Handy et al. (1999) Handy, B. N. et al., 1999, Sol.Phys., 187, 229
- Heyvaerts et al. (1977) Heyvaerts, J., Priest, E. R., & Rust, D. M. 1977, Sol.Phys., 53, 255
- Isobe et al. (2005) Isobe, H., T. Miyagoshi, Shibata, K. & Yokoyama, T. 2005, Nature, 434, 478
- Jiang et al. (2007) Jiang, Y. C. et al. 2007, A & A, 469, 331
- Katsukawa et al. (2007) Katsukawa, Y. et al., 2007, Science, 318, 1594
- Ko et al. (2005) Ko, Y.-K., et al. 2005, ApJ, 623, 519
- Kosugi et al. (2007) Kosugi, T. et al., 2007, Sol.Phys., 243, 3
- Kudoh et al. (1999) Kudoh, T., Matsumoto, R. & Shibata, K. 1999, Comput.Fluid Dyn.J., 8, 56
- Kurokawa & Kawai (1992) Kurokawa, H. & Kawai, G. 1992, in Proc. of IAU Colloq. 141, Beijing, ed. H. Zirin, G. Ai & H. Wang (San Francisco: ASP, 1993),46,507
- Matsumoto et al. (1993) Matsumoto, R., Tajima, T., Shibata, K. Kaisig, M. 1993, ApJ, 414,357
- Miyagoshi & Yokoyama (2004) Miyagoshi, T. & Yokoyama, T. 2004, ApJ, 614, 2, 1042
- Okamoto et al. (2007) Okamoto, T. J. et al., 2007, Science, 318, 1577
- Parker (1988) Parker, E. N., 1988, ApJ, 330, 474
- Petschek & Thorne (1967) Petschek, H. E. & Thorne, R. M. 1967, ApJ, 147, 1157
- Rust (1967) Rust, D. M., 1967, in Proc. of IAU Symp. 35, Budapest, ed. K. O. Kiepenheuer (Reidel, Dordrecht, Netherlands, 1968), 77
- Schmieder et al. (1995) Schmieder, B. et al., 1995, Sol.Phys., 156, 245
- Shibata et al. (1982) Shibata, K., Nishikawa, T., Kitai, R. & Suematsu, Y. 1982, Sol.Phys., 77, 121
- Shibata et al. (1989) Shibata, K. et al., 1989, ApJ, 338, 471
- Shibata et al. (1992) Shibata, K. et al. 1992, PASJ, 44, 173
- Shibata et al. (1994) Shibata, K. et al. 1994, ApJ, 431, 51
- Shibata et al. (2007) Shibata, K. et al., 2007, Science, 318, 1591
- Shimojo et al. (1996) Shimojo, M. et al. 1996, PASJ, 48, 123
- Shimojo et al. (2001) Shimojo, M., Shibata, K., Yokoyama, T. & Hori, K. 2001, ApJ, 550, 1051
- Suzuki & Inutsuka (2005) Suzuki, T. K. & Inutsuka, S. 2005, ApJ, 639, 49
- Takeuchi & Shibata (2001) Takeuchi, A. & Shibata, K. 2001, ApJ, 546, L73
- Tarbell et al. (1999) Tarbell, T., Ryutova, M., Covington, J. & Fludra, A. 1999, ApJ, 514, L47
- Tsuneta et al. (2008) Tsuneta, S. et al, 2008, Sol.Phys., 249, 167
- Ugai (1985) Ugai, M., 1985, Plasma Phys. Controlled Fusion, 27, 1183
- Yokoyama & Shibata (1994) Yokoyama, T. & Shibata, K. 1994, ApJ, 436, L197
- Yokoyama & Shibata (1995) Yokoyama, T. & Shibata, K. 1995, Nature, 375, 42
- Yokoyama & Shibata (1996) Yokoyama, T. & Shibata, K. 1996, PASJ,48, 353
- Yokoyama (1998) Yokoyama, T., 1998, in Proc. of an International Meeting, Guadeloupe, France, ed. T.-D. Guyenne (European Space Agency, 1998, ESA SP-421), 215
- Zirin (1988) Zirin, H. 1988 Astrophysics of the Sun (Cambridge University Press)