Adaptive control of CO2 bending vibration: deciphering field-system dynamics
Abstract
We combined adaptive closed-loop optimization, phase-shaping with a restricted search space and imaging to control dynamics and decipher the optimal pulse. The approach was applied to controlling the amplitude of CO2 bending vibration during strong-field Coulomb explosion. The search space was constrained by expressing the spectral phase as a Taylor series, which generated pulses with characteristics commensurate with the natural physical features of this problem. Optimal pulses were obtained that enhanced bending by up to 56% relative to what is observed with comparably intense, transform limited pulses. We show that (1) this judicious choice of a reduced parameter set made unwrapping the dynamics more transparent and (2) the enhancement is consistent with field-induced structural changes to a bent excited state of CO, which theoretical simulations have identified as the state from which the explosion originates.
pacs:
33.15.Dj, 33.80.Eh, 42.50.Hz, 82.53.KpThe confluence of intense laser fields of ultra-wide spectral bandwidth, pulse shaping Weiner (2000) and adaptive feedback Levis et al. (2001) provides a unique opportunity to explore the manipulation and engineering of many-particle dynamics at the quantum level. From two-particle collective motion to the complexities of biological interactions, the potential to guide an arbitrary system with tailored pulses in a predetermined way has opened new vistas for control via light-matter interaction. While much progress has been made towards developing schemes for realizing control – achieving a specific goal Judson and Rabitz (1992); Warren et al. (1993) – an ability to relate the complex field patterns of the control pulse to a sequence of steps along and/or between potential surfaces describing specific states of the system remains illusive, in general. Two of the primary impediments inhibiting advance are the vast number of (1) degrees of freedom available to the system under control and (2) phase and/or amplitude parameters influencing the pulse that must be set. To appreciate the magnitude of the latter, for phase only shaping with just 128 spectral divisions each with say 700 possible steps between 0 and , there are permutations. Suggestions for reducing the set have ranged from limiting the choices to binary values (0 or ) to imposing a specific functional form (see Lozovoy et al. (2008); Efimov and Reitze (1998); Efimov et al. (1998), for example). In addition to reducing the search space, the ”right” choice – one natural to the physics of the problem – can be quite powerful, facilitating efficient genetic (GA) or evolutionary algorithm searches and, more importantly, enabling solutions to be deciphered physically. In this paper we demonstrate the power of a reduced set pulse shaping in a GA-mediated closed-loop control experiment designed to enhance bending of CO2 during strong-field Coulomb explosion at 800 nm. Specifically, we enhanced bending for the symmetric 6-electron channel, CO O2+ + C2+ + O2+, in which for C2+, is equal and opposite for O2+ and for C2+ is equal and opposite to the sum of for O2+, where is the momentum relative to the field of the light.
We chose CO2, which is linear in its ground state (, the deviation away from ), as our target because it is a nontrivial molecular system exhibiting modes common in larger systems – stretching and bending – and it is well known to bend significantly () during strong-field induced Coulomb explosion Cornaggia (1996); Hishikawa et al. (1999); Zhao et al. (2003). The large bending has also be the subject of theoretical studies, which suggest a physical explanation for the distortion Kono et al. (2001); Sato et al. (2003); Kono et al. (2006). The CO2 response to strong fields allows us to rely on Coulomb explosion imaging Zhao et al. (2001) to probe the connection between the optimal field solutions and the dynamics, where the strong field pulse is the protagonist, staring the control agent and the detector. Our goal was to verify the theoretical model experimentally by exploiting it to enhance the distortion.
In our experiment, 50 fs transform limited (TL) pulses from a Ti:sapphire laser system were shaped by a 128 element phase only liquid crystal spatial light modulator (SLM). Pulses were focused with a spherical mirror (f.l. 75 mm) to an m waist in a chamber containing Torr of CO2. The ions generated by the Coulomb explosion were detected with our image spectrometer Zhu and Hill (1997); Zhao et al. (2002). Microchannel plates backed by a phosphor generate visible images of 2-dimensional projections of 3-dimensional momentum distributions of the ions. Images were collected with an analog camera capable of streaming frames to disk at 15 Hz or a fast-frame digital camera with a frame-storage rate of Hz (see in Fig. 1). The laser rep rate was set to match the digital camera rate to ensure one shot per frame. Typically, the digital (analog) composite images contained () laser shots.
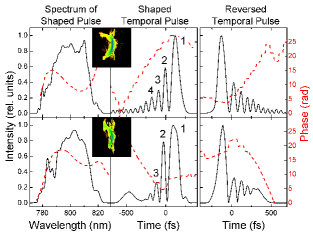
Searches were performed on analog images using the length of the C2+ lobe as the fitness parameter. This was possible since C2+ is constrained to motion to so larger produces longer lobes. The search space was reduced by restricting the phase mask such that the spectral phase was expressed as a 5th-order Taylor expansion Efimov and Reitze (1998); Efimov et al. (1998), , where . We ignored the first two terms of the series because they determine the “absolute” phase and group delay, neither of which is important here. Thus, the GA only varied four parameters, creating a phase mask by adjusting the pixels of the SLM collectively. It is clear from Fig. 2 that solutions are pulse trains that can be described in terms of even and odd spectral phase orders, giving us important insight into the pulse and, the dynamics it induces, as we discuss below. Characterization of the solution is critical for this study. A transient-grating FROG (Frequency-Resolved Optical Gating Trebino (2002)) was our primary tool for this purpose; Fig. 2 shows the FROG traces for the GA solutions as well. Consistency checks and calibration of the FROG phase retrieval were verified with a SPIDER (Spectral Phase Interferometry for Direct Electric-field Reconstruction Iaconis and Walmsley (1999)) and a SEA-TADPOLE (Spatial Encoded Arrangement for Temporal Analysis by Dispersing a Pair of Light E-fields Bowlan et al. (2006)) arrangements for several different pulse shapes.
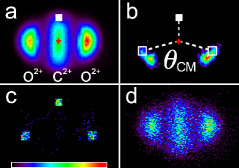
Once an optimal pulse was found, statistical correlation techniques – image labeling Zhao et al. (2001), selective averaging Zhao et al. (2003), and coincidence imaging Zhao and Hill (2005) – were run on digital images to identify collision partners and to measure relative yields vs. . Results are displayed in Fig. 3. To determine , we measured the far-field center of mass angle, , defined in Fig. 1b, from the locations of the correlated O2+ obeying momentum conservation (the hollow squares in Fig. 1b). The bond angle, , at the time of explosion was determined from numerically from the equations of motion assuming a pure Coulomb explosion. We point out that depends weakly on the value of Zhao et al. (2003), the explosion bond length, and the charge, , deviates by less than 1% for in the 2.3 to 4.1 atomic units (a.u.) range and between 1 to 2. Thus, any residual bonding and/or variation in will have little affect on the angles we report. Distributions similar to that shown in the inset of Fig. 3 for different angles were obtained by selecting different C2+ ions along the central lobe.
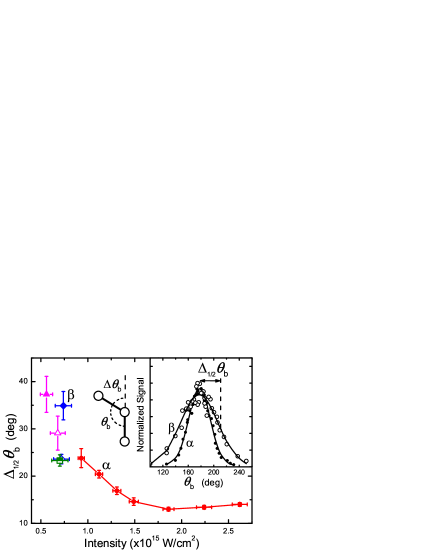
Our investigation was composed of three experiments to probe the explosion response to the field. To isolate the shaped-pulse effects from changes induced by merely varying the intensity or the duration of the pulse, we performed two experiments with TL pulses. First, we measured the distribution vs. for 50 fs pulses, the solid curve in Fig. 3. The half width of the distribution, , decreases monotonically with increasing , when W/cm2, increasing to at W/cm2, the lowest intensity at which we could analyze images due to lack of signal strength, a 71% enhancement. Second, we measured the distribution for a 100 fs TL pulse at an intensity commensurate with the shaped-pulse intensity ( W/cm2), the half filled square in Fig. 3. While the signal yield was considerably stronger with the longer pulse, the bending response did not improve over the best 50 fs pulse response. We note that decreased as increased for 100 fs pulses as well. Finally, we measured the distribution for two GA solutions, the filled triangle and diamond in Fig. 3. We plotted the GA solution at the intensity of the largest peak in the train. From the table of pulse train parameters (Table 1) the width of the largest peak is 100 (128) fs for the upper (lower) solution in Fig. 2. Clearly, the pulse train induces considerably more bending than does a TL pulse, providing an additional enhancement of 46 - 56% (compare the 100 fs TL pulse response with that of the two GA solutions).
We begin our discussion of the results by looking at the system response to TL fields. The sensitivity to depends on several factors. First, it is well known that enhanced ionization Seideman et al. (1995); Chelkowski and Bandrauk (1995); Zuo and Bandrauk (1995), mediated by over-the-barrier ionization, is the principal ionization mechanism responsible for Coulomb explosion for pulses longer than 30 fs Alnaser et al. (2004a, b). The critical bond length, , where the barrier is lowest, is system dependent, going as a.u. for linear tiatomics Yu et al. (1998) where is the atomic ionization potential. For CO2, is in the 3.5 to 5 a.u. range; we measured a.u. Zhao et al. (2003). Second, theoretical simulations suggest the first two electrons are removed from CO2 before the explosion Kono et al. (2001); Sato et al. (2003), which is consistent with our earlier measurements Zhao et al. (2003). Third, the same simulation shows CO is promoted to a bent excited state prior to Coulomb explosion. The theory focused on the first two adiabatic states for CO (), and , and found that was bent (Fig. 7 in Sato et al. (2003)) while the other five were not. The resonant frequency for the CO transition, , was calculated to close to 800 nm near Sato et al. (2003). When a system makes a transition from a linear state to a bent state it will be end up in a high vibrational level and vibrate with larger amplitude. Fourth, the field-dressed states are flatter in the coordinate than the field-free states (see Figs. 3, 6 and 9 in Kono et al. (2001)) and the dressed state is less bent, , than it is field-free, (compare Fig. 7 in Sato et al. (2003) with Fig. 17 in Kono et al. (2006)). Flatter potentials allow the system to stretch further making it easier to reach . Consequently, theory suggests that Coulomb explosions originating from will exhibit larger bending amplitude than those originating from . We expect less bending from when dressed with a stronger field because the transition could promote population to lower vibrational states in . This partially explains our observations. We point out, however, that with the observed increase in the bending for decreasing (Fig. 3), is a concomitant, monotonic decrease in kinetic energy release during the explosion, indicating . This well known saturation is a result of the threshold for over-the-barrier ionization increasing as decreases. For strong enough fields, over-the-barrier ionization and the explosion occur at . Thus, near Coulomb explosion is induced at lower , which again leads a larger bending for smaller .
| 1 | 2 | 3 | 4 | |
|---|---|---|---|---|
| 100/128 | 47/52 | 46/48 | 44/N.A. | |
| 120/127 | 87/87 | 87/N.A. | N.A./N.A. | |
| 0.63/0.57 | 0.17/0.19 | 0.08/0.06 | 0.06/N.A. | |
| 7.5/5.6 | 4.2/4/3 | 2.1/1.5 | 1.6/N.A. |
Turning to the GA solutions (Fig. 2), we notice that while the two pulse trains are not identical (see Table 1 for a summary of their characteristics), they do share two important features: (1) the last peak is larger and wider than the earlier peaks – a pulse width fs compared with fs for early pulses – and (2) the spectral phase is dominated by a negative odd (largely third) order (see the caption of Fig. 2 for the values). A pulse train preceding a larger peak is characteristic of a negative odd order spectral phase. In fact, all solutions shared these two features. All solutions showed bending enhancement over TL pulses, albeit, with some inducing significantly more bending than others. One advantage of this reduced parameter set is that we can change the sign of or turn off specific phase terms. To verify that the negative odd order spectral phase was in fact important, we reversed the sign of the terms to produce a pulse train with the first peak being largest (right panels in Fig. 2). The result was the enhancement virtually disappeared as shown by the hollow diamond and triangle in Fig. 3. The most likely reason the train of pulses enhances bending vibration is a combination of the fact that the state is populated by the early peaks more completely than with a single pulse and the field oscillates off and back on. As we pointed out earlier, atomic ions were essentially immeasurable for W/cm2. Even though Coulomb explosions were insignificant, this intensity was sufficient to produce both CO and CO ions. So, each of the early peaks help to populate the state. Simulations show that subsequent peaks do not transfer population back to the state Kon . Between pulses, when the field is off, the state relaxes to its more bent field-free condition causing CO to vibrate more. It is also interesting to note that the period between pulses is near the bending vibrational frequency of the ground state. Thus, the field could also provide a periodic kick, further enhancing the vibration. It is important to see that the GA enhancement does not come from a lowering of . The 100 fs TL and the two reversal solutions all show significantly less bending than the GA solutions but have about the same as that of the diamond solution. The kinetic energy release for the filled triangle and filled diamond are identical. The fact that the kinetic energy release for the GA solutions was identical suggest that any enhancement due to intensity and bond length at the time of explosion is probably minimal. We then conclude that the pulse train with a negative third (odd) order chirp plays a primary roll in enhancing the bending amplitude.
The results presented here coupled with our earlier studies Zhao et al. (2003) are consistent with the theoretical model of the CO2 explosion originating from a high vibrational level of a bent state in CO. For TL pulses, the bending amplitude decreases with increasing , in response to a straightening of the bent state for larger . A shaped pulse composed of a pulse train provides additional bending enhancement. The dressed-bent state is allowed to relax (become more bent) between peaks within the train amplifying the vibration, with the early peaks populating the state and final peak inducing the explosion. A judicious choice for the search space proved to be powerful in deciphering the optimal pulse. Vibration was the natural physical feature for this problem and restricting the phase mask to producing pulses forced the optimal pulse to reflect the primary dynamics.
We thank Prof. H. Kono for helpful discussions, Dr. G. M. Menkir for helpful discussions and technical support in the early stages of this work and S. Iacangelo (REU student), T. Avasthi and J. Sun for technical support. This work was supported by NSF grant PHY0555636.
References
- Weiner (2000) A. M. Weiner, Rev. Sci. Instrum. 71, 1929 (2000).
- Levis et al. (2001) R. J. Levis, G. M. Menkir, and H. Rabitz, Science 292, 709 (2001).
- Judson and Rabitz (1992) R. Judson and H. Rabitz, Phys. Rev. Lett. 68, 1500 (1992).
- Warren et al. (1993) W. S. Warren, H. Rabitz, and M. Dahleh, Science 259, 1581 (1993).
- Lozovoy et al. (2008) V. V. Lozovoy, X. Zhu, T. Gunaratne, D. Harris, J. Shane, and M. Dantus, J. Phys. Chem. A 112, 3789 (2008).
- Efimov and Reitze (1998) A. Efimov and D. H. Reitze, Opt. Lett 23, 1612 (1998).
- Efimov et al. (1998) A. Efimov, M. D. Moores, N. M. Beach, J. Krause, and D. H. Reitze, Opt. Lett 23, 1915 (1998).
- Cornaggia (1996) C. Cornaggia, Phys. Rev. A 54, R2555 (1996).
- Hishikawa et al. (1999) A. Hishikawa, A. Iwamae, and K. Yamanouchi, J. Chem. Phys. 111, 8871 (1999).
- Zhao et al. (2003) K. Zhao, G. Zhang, and W. T. Hill, III, Phys. Rev. A 68, 063408 (2003).
- Kono et al. (2001) H. Kono, S. Koseki, M. Shiota, and Y. Fujimura, J. Phys. Chem. A 105, 5627 (2001).
- Sato et al. (2003) Y. Sato, H. Kono, S. Koseki, and Y. Fujimura, J. Am. Chem. Soc 125, 8019 (2003).
- Kono et al. (2006) H. Kono, Y. Sato, M. Kanno, K. Nakai, and T. Kato, Bull. Chem. Soc. Jpn. 79, 196 (2006).
- Zhao et al. (2001) K. Zhao, G. Zhang, and W. T. Hill, III, Opt. Express 9, 42 (2001).
- Zhu and Hill (1997) J. Zhu and W. T. Hill, III, J. Opt. Soc. Amer. B 14, 2212 (1997).
- Zhao et al. (2002) K. Zhao, T. Colvin, Jr., W. T. Hill, III, and G. Zhang, Rev. Sci. Instrum. 73, 3044 (2002).
- Trebino (2002) R. Trebino, Frequency-Resolved Optical Gating: The measurement of ultrashort laser pulses (Kluwer Academic Publishers, Norwell, MA, 2002), ISBN 1-4020-7066-7.
- Iaconis and Walmsley (1999) C. Iaconis and I. A. Walmsley, IEEE J. Quantum Electron. 35, 501 (1999).
- Bowlan et al. (2006) P. Bowlan, P. Gabolde, A. Schreenath, K. McGresham, and R. Trebino, Opt. Express 14, 11892 (2006).
- Zhao and Hill (2005) K. Zhao and W. T. Hill, III, Phys. Rev. A 71, 013412 (2005).
- Seideman et al. (1995) T. Seideman, M. Y. Ivanov, and P. B. Corkum, Phys. Rev. Lett. 75, 2819 (1995).
- Chelkowski and Bandrauk (1995) S. Chelkowski and A. D. Bandrauk, J. Phys. B 28, L723 (1995).
- Zuo and Bandrauk (1995) T. Zuo and A. D. Bandrauk, Phys. Rev. A 52, R2511 (1995).
- Alnaser et al. (2004a) A. S. Alnaser, X. Tong, T. Osipov, S. Voss, C. M. P. Ranitovic, B. Ulrich, B. Shan, Z. Chang, C. D. Lin, and C. L. Cocke, Phys. Rev. Lett. 93, 183202 (2004a).
- Alnaser et al. (2004b) A. S. Alnaser, S. Voss, X. M. Tong, C. M. Maharjan, P. Ranitovic, B. Ulrich, T. Osipov, B. Shan, Z. Chang, and C. L. Cocke, Phys. Rev. Lett. 93, 113003 (2004b).
- Yu et al. (1998) H. Yu, T. Zuo, and A. D. Bandrauk, J. Phys. B 31, 1533 (1998).
- (27) H. Kono, private communication.