Detect overlapping and hierarchical community structure in networks
Abstract
Clustering and community structure is crucial for many network systems and the related dynamic processes. It has been shown that communities are usually overlapping and hierarchical. However, previous methods investigate these two properties of community structure separately. This paper proposes an algorithm (EAGLE) to detect both the overlapping and hierarchical properties of complex community structure together. This algorithm deals with the set of maximal cliques and adopts an agglomerative framework. The quality function of modularity is extended to evaluate the goodness of a cover. The examples of application to real world networks give excellent results.
pacs:
89.75.Hc, 05.10.-a, 87.23.Ge, 89.20.HhI Introduction
Many complex systems in nature and society can be described in terms of networks or graphs. Examples include the Internet, the world-wide-web, social and biological systems of various kinds, and many others Strogatz01 ; AB02 ; Newman03a . In the past decade, the theory of complex network has attracted much attention. Complex networks are usually characterized by several distinctive properties: power law degree distribution, short path length, clustering and community structure. The problem becomes important because complex system’s dynamics is actually determined by the interaction of many components and the topological properties of the network will affect the dynamics in a very fundamental way. Therefore, an efficient and sound approach that can capture the topological properties of network is needed.
Identifying the community structure is crucial to understand the structural and functional properties of the networks GN02 ; GA05 ; FLGC02 . Many methods have been proposed to identify the community structure of complex networks Newman06c ; PDFV05 ; NG04 ; Radicchi04 ; Newman04d ; Newman06e . One can refer to DDDA05 for reviews. These methods can be roughly classified into two categories in terms of their results, i.e., to form a partition or a cover of the network.
The first kind of methods produce a partition, i.e each vertex belongs to one and only one community and is regarded as equally important. Different from classical graph-partition problem, the number of communities and the size of each community are previously unknown. Newman et al. proposed a quality function , namely modularity, to evaluate the goodness of a partition NG04 . A high value of indicates a significant community structure. Several community detection methods have been proposed by optimizing modularity Newman04d ; CNM04 ; DA05 . Generally, this kind of methods are suitable to understand the entire structure of networks, especially for the networks with a small size. Recently, some authors FB07 ; KSKK07 have pointed out that the optimization of modularity has a fundamental drawback, i.e. the existence of a resolution limit.
The second kind of methods aim to discover the vertex sets (i.e. communities) with a high density of edges. In this case, overlapping is allowed, that is, some vertices may belong to more than one community. Meanwhile, some vertices may be neglected as subordinate vertices. Therefore, these methods result in an incomplete cover of the network. Numerous methods have been proposed, based on k-clique PDFV05 , k-dense SYK06 or other patterns. Unfortunately, there is no commonly accepted standard to evaluate the goodness of a cover up to now. Compared to the partition methods, this kind of methods are appropriate to find the cohesive regions in large-scale networks.
In real networks, communities are usually overlapping and hierarchical PDFV05 ; SGMA07 ; RSMOB02 ; P08 . Overlapping means that some vertices may belong to more than one community. Hierarchical means that communities may be further divided into sub-communities. The two kinds of existing methods, as mentioned above, investigate these two phenomena separately. The first kind of methods can be used to explore the hierarchical community structure, however, they are unable to deal with overlaps between communities. The second kind of methods can uncover overlapping community structure of networks, but they are incapable of finding the hierarchy of communities. Recently, several authors begin to detect the hierarchical and overlapping community structure LFK08 .
In this paper, a new algorithm EAGLE (agglomerativE hierarchicAl clusterinG based on maximaL cliquE) is presented to uncover both hierarchical and overlapping community structure of networks. This algorithm deals with the set of maximal cliques and adopts an agglomerative framework. The effectiveness is demonstrated by applications to two real-world networks, namely the word association network and the scientific collaboration network.
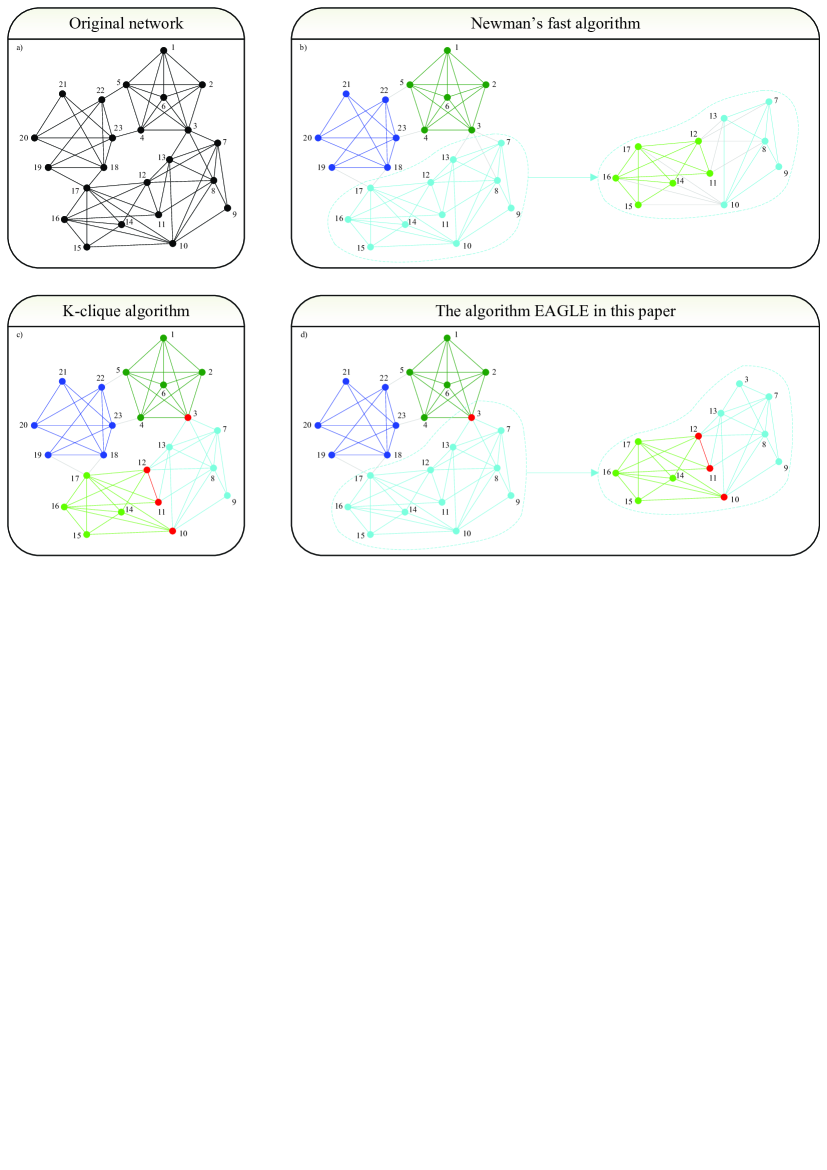
In Fig.1, we use a schematic network to illustrate what EAGLE can do and compare it with the two kinds of existing methods. Fig.1(a) depicts the schematic network. We construct this network according to the schematic network in PDFV05 , which has overlapped community structure. To construct the hierarchy of the overlapped communities, we remove the edge connecting vertices and and add two edges, one connecting and and the other one connecting and . Fig.1(b) shows the community structure found by Newman’s fast algorithm Newman04d . Three community are found when applying the algorithm to the schematic network. The hierarchy of communities can be revealed by applying the algorithm to each community further. For example, one of the three communities is divided into two sub-communities. Overlaps between communities are not allowed. Fig.1(c) demonstrates the overlapping community structure found by k-clique algorithm PDFV05 . Unfortunately, this algorithm can not reveal the hierarchy of community. Fig.1(d) shows the hierarchical and overlapping community structure found by our algorithm. EAGLE provides a possible way to investigate a more complete picture of the community structure.
II The algorithm: EAGLE
A community can be regarded as a vertex set within which the vertices are more likely connected to each other than to the rest of the network. This indicates that a community usually has relatively high link-density. Generally, the link-density of a clique is highest among all kinds of vertex subsets of a network. Dense-linked community usually contains a large clique, which could be regarded as the core of the community. Based on this observation, the algorithm EAGLE is proposed as an agglomerative hierarchical clustering algorithm to investigate the community structure. Different from traditional agglomerative algorithms Newman04d , our algorithm deals with the set of maximal cliques rather than the set of sole vertices.
A maximal clique is a clique which is not a subset of any other cliques. In the algorithm EAGLE, we need to firstly find out all the maximal cliques in the network. This can be done by many efficient parallel algorithms. Here we choose the well-known Bron-Kerbosch algorithm BK73 for its simplicity in implementation. Note that not all maximal cliques are taken into account. The maximal cliques, whose vertices are from some other larger maximal cliques, are called subordinate maximal cliques. For example, in Fig.1, vertex and forms a subordinate maximal clique. Because vertex is from another larger maximal clique {1, 2, 3, 4, 5, 6} and vertex is also from other larger maximal cliques, including {18, 20, 21, 23}, {18, 20, 22, 23} and {18, 19, 22, 23}. Subordinate maximal cliques may mislead our algorithm and should be discarded. Most subordinate maximal cliques have small sizes. Thus, we can discard them by setting a threshold and neglecting all the maximal cliques with the size smaller than . This simple tactic may also discard some non-subordinate maximal cliques. The higher the value of is, the more non-subordinate maximal cliques are discarded by mistake. On the other hand, the smaller the value of is, the more subordinate maximal cliques are remained. In real world networks, the threshold typically takes value between and . As to the network in Fig.1, both and are appropriate threshold values. As to the networks used in Sec.III, is demonstrated to be an appropriate threshold PDFV05 . After neglecting the maximal clique with the size smaller than the threshold , some vertices do not belong to any remaining maximal cliques. We call these vertices as subordinate vertices.
Our algorithm have two stages. In the first stage, a dendrogram is generated. In the second stage, we choose an appropriate cut which breaks the dendrogram into communities. The first stage of the algorithm EAGLE can be described as follows:
-
1.
Find out all maximal cliques in the network. Neglect subordinate maximal cliques. The remainders are taken as the initial communities. Each subordinate vertex is also taken as an initial community comprising the sole vertex. Calculate the similarity between each pair of communities.
-
2.
Select the pair of communities with the maximum similarity, incorporate them into a new one and calculate the similarity between the new community and other communities.
-
3.
Repeat step until only one community remains.
In the algorithm, the similarity between two communities and is defined as
| (1) |
Here, is the element of adjacency matrix of the network (We only consider undirected, unweighted networks in this paper). It takes value if there is an edge between vertex and vertex and otherwise. is the total number of edges in the network. is the degree of .
Similar to the fast algorithm in Newman04d , the process of our algorithm corresponds to a dendrogram, which shows the order of the amalgamations.Any cut through the dendrogram produces a cover of the network. As an illustration, Fig.2 shows the dendrogram generated by our algorithm when applied to the network in Fig.1.
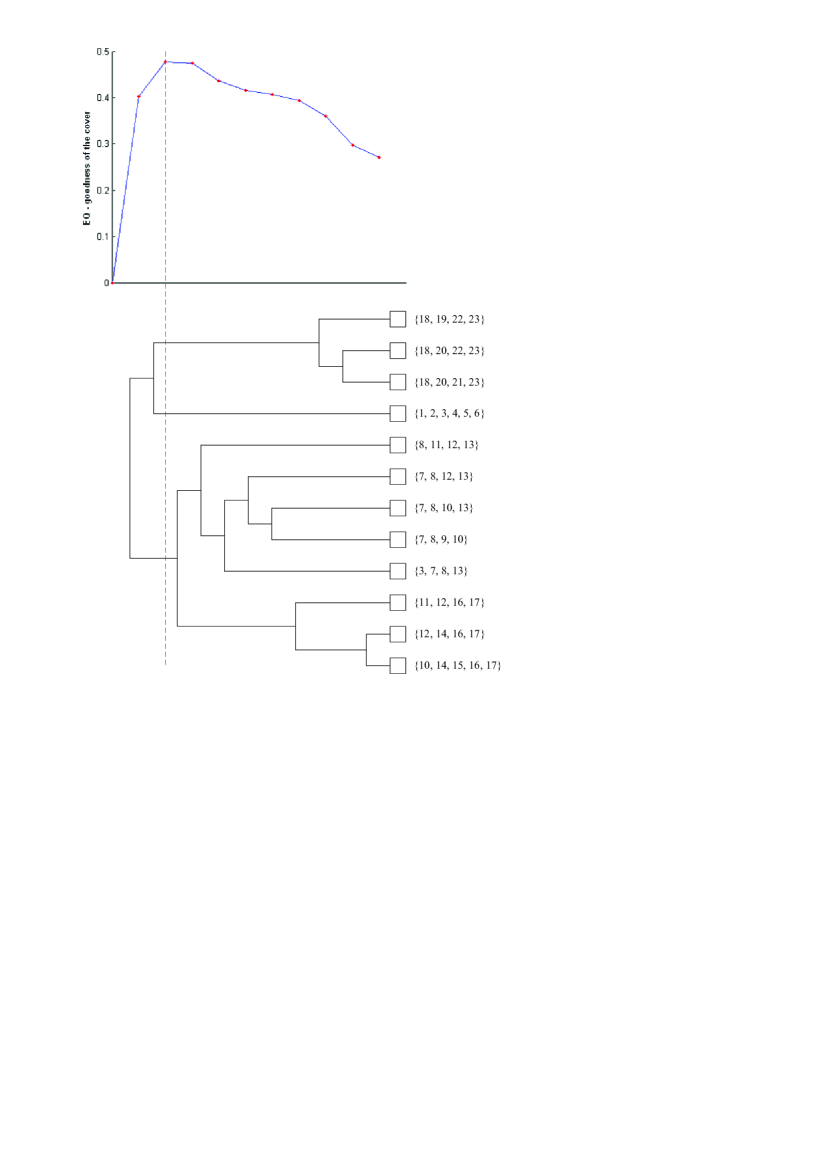
The task of the second stage of the algorithm EAGLE is to cut the dendrogram. To determine the place of the cut, a measurement is required to judge the quality of a cover. In NMCM08 , an extension of modularity is proposed to evaluate the goodness of overlapped community decomposition. In this paper, we propose another extension of modularity . As shown in Fig.2, the cut gives the best cover with the maximum value of . Given a cover of the network, let be the number of communities to which vertex belongs. The extended modularity is defined as
| (2) |
Note that reduces to in NG04 when each vertex belongs to only one community (Readers can refer to CNM04 for details), and is equal to when all nodes belong to the same community. In addition, it will be shown later in Sec.III, a high value of indicates a significant overlapping community structure.
Alike to modularity, the extended modularity suffers a resolution limit beyond which no modular structure can be detected even though these modules might have their own entity. As to EAGLE, however, these modules can be still detected by further applying the algorithm to each community found until none of them can be divided into smaller ones. Thus, we obtain a hierarchy of overlapping communities which reveals the community structure of network more completely.
Then we analyze the time complexity of the algorithm. Let be the number of vertices, be the number of maximal cliques in the initial state of the algorithm, and be the number of pair of maximal cliques which are neighbors (connected by edges or overlap with each other). We firstly consider the first stage of the algorithm. In step 1, operations are needed to calculate the similarity between each pair of initial communities. In step , we only consider the pairs of communities which are neighbors. Each selection costs operations and each time of join costs operations at most. Totally, we carry on a maximum of join operations. Thus the first stage of the algorithm takes at most operations. As to the second stage, we need to calculate the value of corresponding to each cover. In our implementation, we calculate the value of for the initial cover and update it after each join of two selected communities into a new one. Each time of update costs at most operations. Hence, the second state of the algorithm takes at most operations. In addition, we need to find out all the maximal cliques in the network. It is widely believed to be a non-polynomial problem. However, for real-world networks, finding all the maximal cliques is easy due to the spareness of these networks.
Compared to the Newman’s fast algorithm and the k-clique algorithm, the algorithm EAGLE is time-consuming. We leave it as a future work that how to improve the speed of EAGLE.
III Applications
In this section, we apply the algorithm EAGLE to two real-world complex networks, the word association network and the scientific collaboration network. The results show that EAGLE can discover new knowledge and insights underlying these networks.
The test data of the two networks are from the demo of the CFinder 111CFinder is a free software for finding overlapping dense groups of nodes in networks, based on the Clique Percolation Method (CPM) PDFV05 .. The two networks comprise nodes and edges, respectively. The average clustering coefficients WS98 are approximately and , which indicate that these networks have significant community structures in general.
The word association network is constructed from the South Florida Free Association norms list. The original network is directed and weighted. The weight of a directed link from one word to another indicates the frequency that the people in the survey associated the end point of the link with its start point. The directed links are replaced by undirected ones with a weight equal to the sum of the weights of the corresponding two oppositely directed links. Furthermore, the links with weight less than are deleted. The scientific collaboration network is from the co-authorship network of Los Alamos e-print archives. Each article in the archive between April 1998 and February 2004 contributes the value to the weight of the link between every pair of its authors. The link with weight less than is omitted.
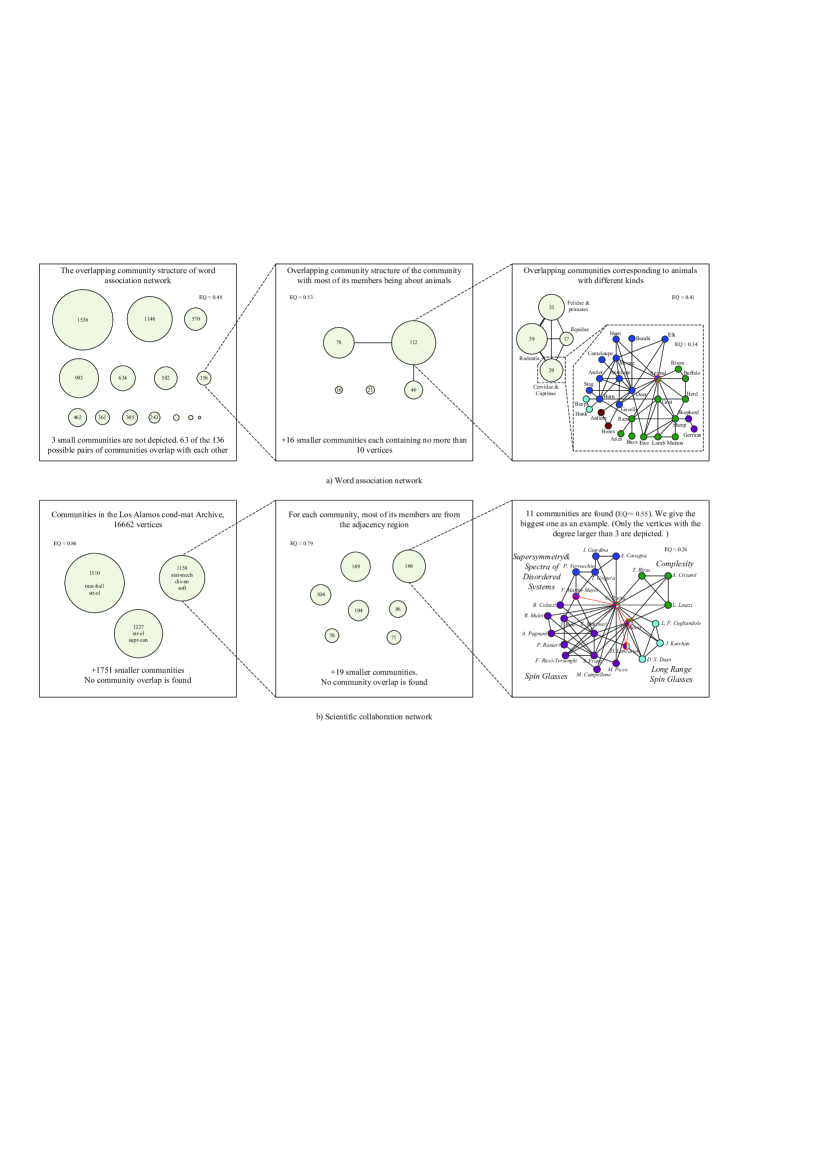
In the word association network, totally communities are found by our algorithm - see Fig.3(a), left panel. Among these communities, of possible pairs of communities overlap with each other. To investigate what is correlated to the community structure, we apply our algorithm to each of these communities again. The sub-community structure of one community is given in Fig.3(a), middle panel. Each of these sub-communities have certain correlation with the semantic meaning of words. For example, most of the words in the community with size are related to the family of animals in Africa. This community is explored further and four communities are found, shown in Fig.3(a), right panel. Each community is associated with animals from the same family, namely rodentia, felidae & primates, cervidae & caprinae, and equidae respectively. The details of one community are also illustrated in Fig.3(a), right panel. Two large communities correspond to words associated with animals from cervidae and caprinae respectively. The overlapped word Animal acts as a bridge between the two communities. Three small communities comprise peripheral words.
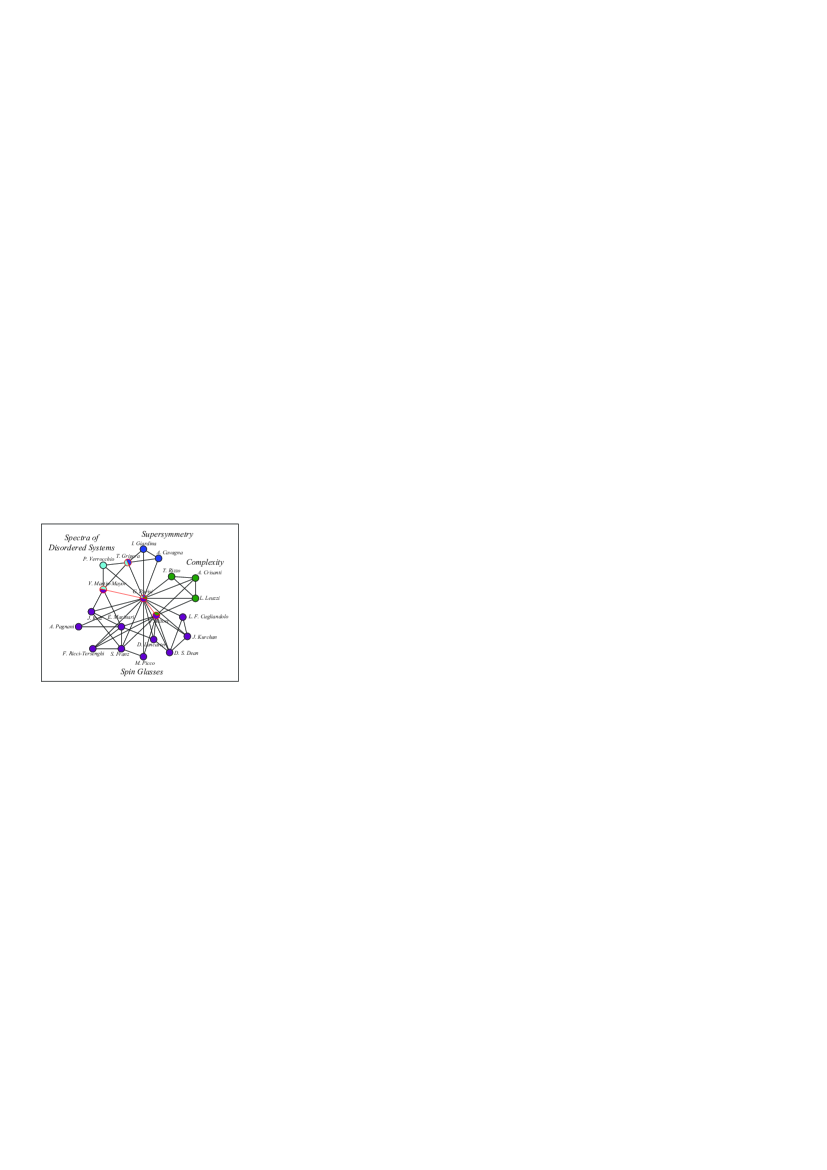
Applying our algorithm to the scientific collaboration network, we obtain totally communities - see Fig.3(b), left panel, with the corresponding high value of . Three large communities contains of all the vertices, while the others are relatively small. The three large communities correspond closely to subject subareas: the biggest one mainly to mes-hall and str-el, the second biggest one to str-el and supr-con, and the other to stat-mech, dis-nn and soft. We further apply the algorithm to one community and it is broken down into sub-communities - depicted in Fig.3(b), middle panel. There appears to be a correlation between the sub-community structure and the regional divisions of the scientific researchers. For example, most of the members of the community with size work in Europe. More specific regional information can be obtained when applying the algorithm to this community. The biggest one and its sub-community structure are given in Fig.3(b), right panel. We can see that the author G. Parisi (who is well known for having made significant contributions in different fields of physics) acts as a hub in the community. Different communities can be associated with his different fields of interest.
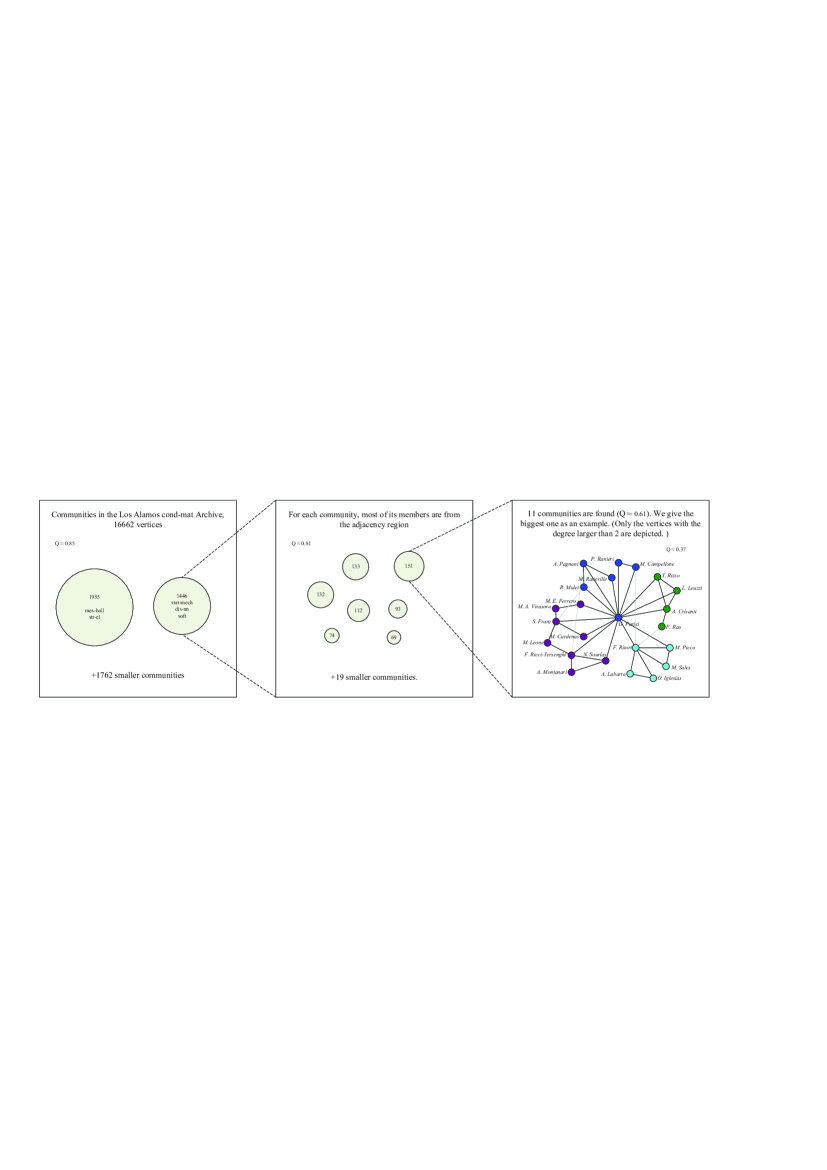
Now, we compare the algorithm EAGLE with Newman’s fast algorithm and the k-clique algorithm by applying them to the scientific collaboration network. Figure 4 shows that the hierarchical community structure found by Newman’s fast algorithm. The number of communities at each level of the hierarchy is almost identical to that found by the algorithm EAGLE although the size of each community is somewhat different. Compare the left panel of Fig.4 with that of Fig.3(b), one community disappears. Actually, it is divided into several other smaller communities, which are not depicted. As to the right panels, the details of communities were given. The node G. Parisi, acting as a hub in Fig.3, only appear in one community in Fig.4. The reason is that Newman’s algorithm gives rise to partitions of network, while the algorithm EAGLE allows overlaps between communities. Note that overlap between communities is a very common phenomenon in real networks and may contribute to the evolvement of communities and the dynamics of networks.
Figure 5 shows the overlapping community structure around the node G. Parisi in the scientific collaboration network. Compare to Fig.3, both the algorithm EAGLE and the k-clique algorithm can find the overlapping community structure, although the overlapped communities found by the two algorithm are somewhat different. However, the algorithm EAGLE can give the hierarchy of these overlapped communities compared to the k-clique algorithm. The hierarchy of communities is useful to understand the community structure of real world networks.
IV Conclusions and discussions
In this paper, we propose an algorithm, namely EAGLE, to uncover both the hierarchical and overlapping properties of community structure in complex networks. This algorithm deals with the set of maximal cliques and adopts an agglomerative framework. The effectiveness of this algorithm is demonstrated by applications to two real-world networks, namely the word association network and the scientific collaboration network. Results also show that the algorithm EAGLE provides a possible way to gain a more complete picture of the community structure of networks. Note that only un-weighted and undirected networks are considered in this paper. In our further work, EAGLE will be generalized to the weighted and/or directed networks. How to improve the e ciency of EAGLE will also be considered.
Our method can help to analyze the community structure of some very large networks. It can also shed some light on understanding the topological and dynamical behavior of some large technological, social and biological network systems.
Acknowledgements.
This work was funded by the National Basic Research Program of China under grant number and National Natural Science Foundation of China under grant number . The authors gratefully acknowledge S. Fortunato for helpful suggestions. The authors also thank Shi Zhou for enlightening discussions.References
- (1) S. H. Strogatz, Exploring complex networks. Nature 410, 268–276 (2001).
- (2) R. Albert and A.-L. Barabási, Statistical mechanics of complex networks. Rev. Mod. Phys. 74, 47–97 (2002).
- (3) M. E. J. Newman, The structure and function of complex networks. SIAM Review 45, 167–256 (2003).
- (4) M. Girvan and M. E. J. Newman, Community structure in social and biological networks. Proc. Natl. Acad. Sci. USA 99, 7821–7826 (2002).
- (5) R. Guimerà and L. A. N. Amaral, Functional cartography of complex metabolic networks. Nature 433, 895–900 (2005).
- (6) G. W. Flake, S. R. Lawrence, C. L. Giles, and F. M. Coetzee, Self-organization and identification of Web communities. IEEE Computer 35, 66–71 (2002).
- (7) M. E. J. Newman, Finding community structure in networks using the eigenvectors of matrices. Phys. Rev. E 74, 036104 (2006).
- (8) G. Palla, I. Derényi, I. Farkas, and T. Vicsek, Uncovering the overlapping community structure of complex networks in nature and society. Nature 435, 814–818 (2005).
- (9) M. E. J. Newman and M. Girvan, Finding and evaluating community structure in networks. Phys. Rev. E 69, 026113 (2004).
- (10) F. Radicchi, C. Castellano, F. Cecconi, V. Loreto, and D. Parisi, Defining and identifying communities in networks. Proc. Natl. Acad. Sci. USA 101, 2658–2663 (2004).
- (11) M. E. J. Newman, Fast algorithm for detecting community structure in networks. Phys. Rev. E 69, 066133 (2004).
- (12) M. E. J. Newman, Modularity and community structure in networks. Proc. Natl. Acad. Sci. USA 103, 8577–8522 (2006).
- (13) L. Danon, J. Duch, A. Diaz-Guilera, and A. Arenas, Comparing community structure identification. J. Stat. Mech. p. P09008 (2005).
- (14) A. Clauset, M. E. J. Newman, and C. Moore, Finding community structure in very large networks. Phys. Rev. E 70, 066111 (2004).
- (15) J. Duch and A. Arenas, Community detection in complex networks using extremal optimization. Phys. Rev. E 72, 027104 (2005).
- (16) D. J. Watts and S. H. Strogatz, Collective dynamics of ‘small-world’ networks. Nature 393, 440–442 (1998).
- (17) S. Fortunato and M. Barthélemy, Resolution limit in community detection. Proc. Natl. Acad. Sci. USA 104, 36–46 (2007).
- (18) J. M. Kumpula, J. Saramaki, K. Kaski, and J. Kertesz, Resolution limit in complex network community detection with Potts model approach. Eur. Phys. J. B 56 41–45 (2007).
- (19) E. Ravasz, A. L. Somera, D. A. Mongru, Z. N. Oltvai, and A.-L. Barabási, Hierarchical organization of modularity in metabolic networks. Science 297, 1551–1555 (2002).
- (20) M. Sales-Pardo, R. Guimerà, A. A. Moreira, and L. A. N. Amaral, Extracting the hierarchical organization of complex systems. Proc. Natl. Acad. Sci. USA 104, 15224–15229 (2007).
- (21) P. Pons, Post-processing hierarchical community structures: quality improvements and multi-scale view. arXiv:cs/0608050v1.
- (22) A. Lancichinetti, S. Fortunato, and J. Kertesz. Detecting the overlapping and hierarchical community structure of complex networks. arXiv:0802.1218v1.
- (23) V. Nicosia, G. Mangioni, V. Carchiolo, and M. Malgeri, Extending modularity definition for directed graphs with overlapping communities. arXiv:0801.1647v3.
- (24) C. Bron and J. Kerbosch, Finding all cliques in an undirected graph. Communications of the ACM 575–577 (1973).
- (25) K. Saito, T. Yamada, and K. Kazama, Extracting communities from complex networks by the k-dense method. Workshops Proceedings of the 6th IEEE International Conference on Data Mining, 300–304 (2006).