Stochastic dynamics of a sheared granular medium
Abstract
We experimentally investigate the response of a sheared granular medium in a Couette geometry. The apparatus exhibits the expected stick-slip motion and we probe it in the very intermittent regime resulting from low driving. Statistical analysis of the dynamic fluctuations reveals notable regularities. We observe a possible stability property for the torque distribution, reminiscent of the stability of Gaussian independent variables. In this case, however, the variables are correlated and the distribution is skewed. Moreover, the whole dynamical intermittent regime can be described with a simple stochastic model, finding good quantitative agreement with the experimental data. Interestingly, a similar model has been previously introduced in the study of magnetic domain wall motion, a source of Barkhausen noise. Our study suggests interesting connections between different complex phenomena and reveals some unexpected features that remain to be explained.
1 CNR-Istituto dei Sistemi Complessi, Via del Fosso del Cavaliere, 00133 Roma, Italy
2 Dipartimento di Fisica, Sapienza, Università di Roma, P.le A. Moro 2, 00185 Roma, Italy
3 CNR-INFM, SMC, Dipartimento di Fisica, Sapienza Università di Roma, P.le A. Moro 2, 00185 Roma, Italy
1 Introduction
The response of a granular material to shear stress has been widely investigated in the past. The first relevant report on the subject was perhaps that of Bagnold [1], pointing out a transition from sliding to stick-slip motion. Subsequent work (see e.g. references in [2]), was limited essentially to situations with more continuous or constant shear rate. However, we may observe that the response of a granular medium to an applied shear stress is often non-continuous, but takes place in the form of intermittent, erratic events, particularly when the applied shear rate is below some threshold. Despite the fact that this situation is frequently encountered in nature (earthquakes are a large-scale example), systematic investigation of the statistics of fluctuations seems limited. One recent step in this direction was taken by Nasuno and coworkers [4] who analyzed the stick-slip behavior of a sheared granular medium, but considering a highly periodic motion regime. Molecular dynamics simulations of a similar setup had been previously performed by Thompson and Grest [5]. The aperiodic regime was investigated by Dalton and Corcoran in a slightly different apparatus [3, 6], who presented the statistics of slip amplitudes, durations and energy dissipation, hinting at the possible presence of scale free distributions. In this paper we report on some results from our study of the stick-slip regime of a sheared granular medium, when deviations from peridic motion are strong. We describe the experimental apparatus in Sec. 2, from which we extract the statistics of the reaction force (Sec. 3), the distribution of which has some notable features (Sec. 4). Section 5 discusses the statistics of velocity fluctuations and compares with the stochastic model and Sec. 6 contains a brief summary.
2 The experiment
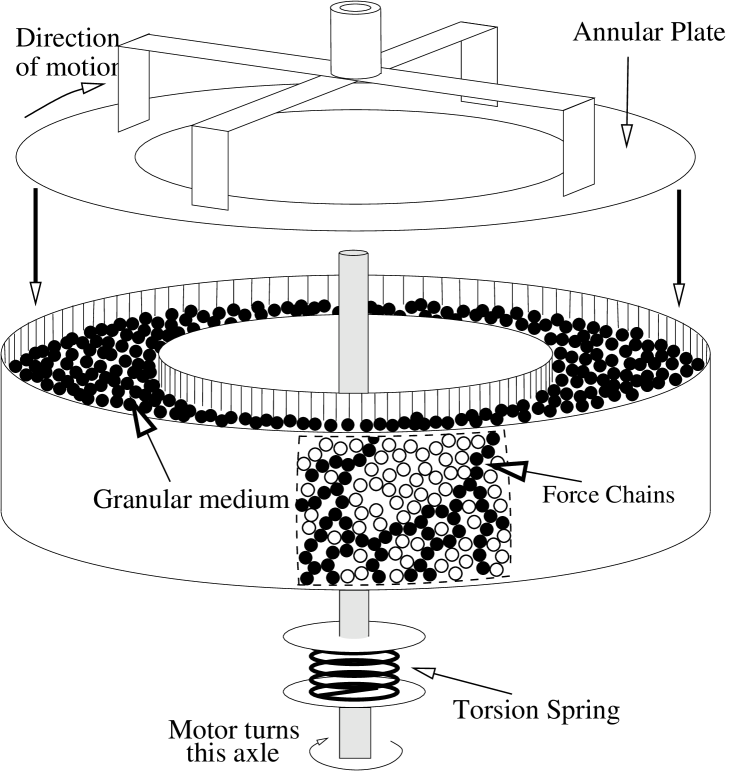
In order to investigate the stick-slip response of a granular medium to an external shear rate we devised and realized a circular channel in which a granular medium is sheared by an overhead rotating annulus which bears on the medium (Fig. 1). The plate is driven by a motor via a torsion spring, and is free to move vertically. As the motor turns the springs loads and the annular plate is initiallly retarded by static friction with the granulate. As soon as the force is sufficient to destroy the granular structure (i.e. force chains in the medium, see schematic in Fig. 1), the plates starts to slip, unloading the spring, and slows to a stop when the friction force overcomes the spring force. Two optical encoders measure the angular difference between the motor and the plate, and this signal is stored in a pc as a function of time. The resolution on the angle is rad, and up to s in time (though signals are typically smoothed and interpolated to 10 ms or 1 mrad, in order to reduce instrumental noise). The bed of glass beads is combed before each series of experiments in order to minimize ageing effects and also to remove any possible crystal structures present. This preparation procedure allows for an acceptable reproducibility of the results. More details on the experimental set-up can be found in [2].
3 Statistics of the reaction torque
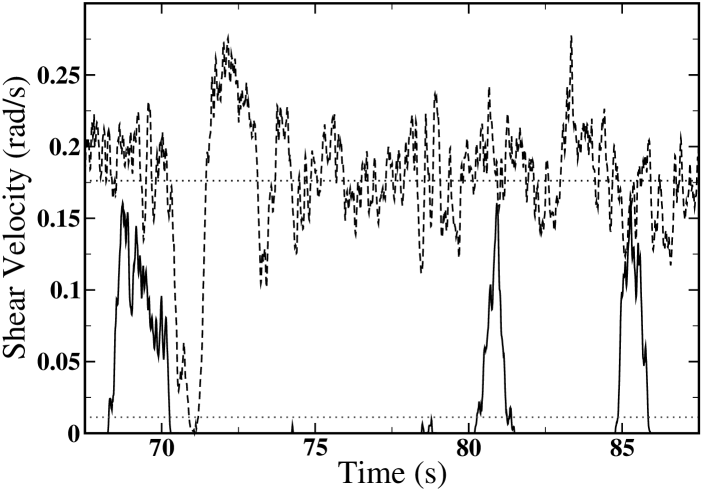
By measuring the instantaneous angle, several quantities can be derived. For instance, a sample of the resulting angular velocity time series of the plate and driving motor is given in Fig. 2. The two curves with clearly distinct features correspond to the stick slip and to the sliding regimes.
The reaction torque of the granular medium can be derived as a functon of time:
| (1) |
where is the spring constant and the total inertia of the plate and annexes. The torque may also be more usefully expressed as a function of the angle: . Experiments were performed at various driving velocities and springs constants, the variation range of which is illustrated in Tab. 1.
The time series exemplified in Fig. 2 have been exploited to extract important information on the statistical properties of the torque . In particular we have constructed the Probability Density Function (PDF) and the Auto-Correlation Function (ACF). For each of the experiments, we have considered the following values of : at the detachment (static), at stationary points of velocity (when ), and globally. The resulting PDF’s are shown in [2] and are virtually identical. Their most notable feature, the asymmetry, is clearly evident. Different functional forms can be used to reasonably fit the curves (e.g. Gumbel, Lognormal, Gamma etc.) but none seem to offer any insight into any possible underlying physical process [2].
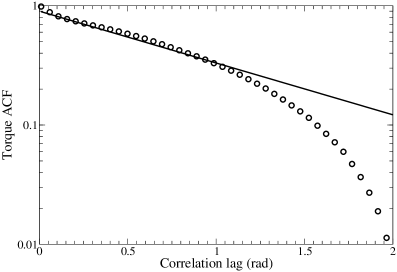
The ACF is calculated on the torque signal as a function of angular displacement, and in shown in Fig. 3 for a single experiment. The straight line is an exponential decay of angular constant radian (corresponding to 30,000 times the system’s angular resolution, or roughly 100 particle diameters). This observation suggests that a model for the granular friction force should take explicitly into account the correlations present in the granular medium.
4 Stability and universality
Non-symmetric distributions appear in many natural phenomena, and are usually deemed to be an indication of the presence of correlations. In recent years some authors [7] have suggested the idea that in many cases most, if not all, of these distributions pertain to a simple universal kind of PDF, which would take the place of the Gaussian distribution when the variables are strongly correlated.
Actually, by virtue of the central limit theorem, the PDF for the sum of a large number of independent variable converges to the Gaussian distribution. In Ref. [7] and related work, it is proposed that the observed non-symmetric distributions may be limit distributions for sums of strongly correlated variables.
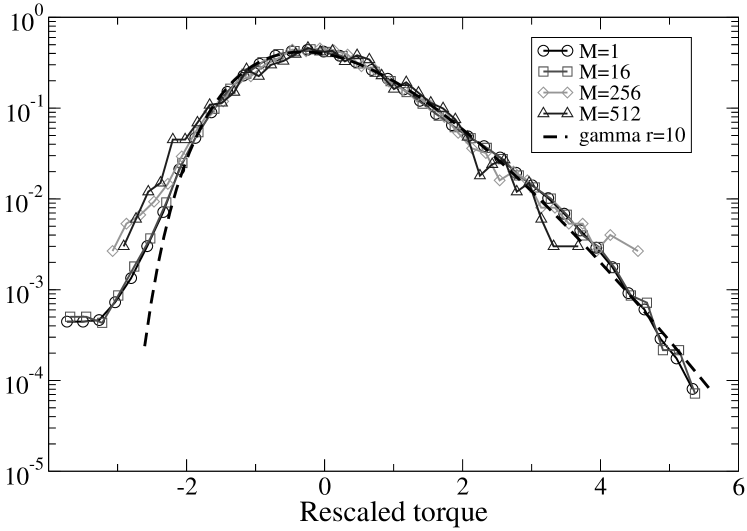
The distribution of the torque shows a very similar behavior, with a pronounced asymmetry. This is shown in Fig.4, where the torque distribution is the curve denoted by (see below).
In order to test if the torque PDF is compatible, at least in principle, with such a limit distribution, we have computed the PDF of the sum variable
where , and we compare the distribution for several values of M. In our data mrad. In figure 4 we report the distributions for , , , and (i.e. corresponding to mrad). The distributions are rescaled in order to have zero mean and unit variance.
Recalling the analysis of the torque distribution, if we assume that the variables are Gamma distributed, i.e. according to:
then for any the rescaled variable should be distributed as
Fitting our measures for the torque distribution with a Gamma distribution, we find that . Note also that the variables are not independent: their correlation coefficient decays exponentially as: . A comparison with the measured autocorrelation function gives
Accordingly with previous mathematical studies [8, 9], the distribution of can itself be approximated with a gamma distribution with parameter:
| (2) |
(the scale parameter is unnecessary if we compare the rescaled variables). Considering our value of , the variation of from to is between and . In Fig. 4 we compare the measured rescaled ditribution of with the rescaled gamma distribution ().
5 The equation of motion
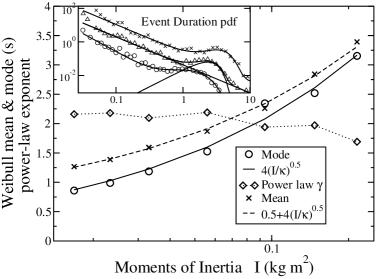
The work by Dalton and Corcoran [3, 6], performed at constant volume, revealed the presence of self similar PDFs for the duration and extension of the slip events, and for the velocity. Our experiment confirmed the presence of such distributions, although in this case the medium can dilate and a peak at large duration appears [12] (inset to Fig. 5); this peak was ascribed to the inertial properties of the plate. Figure 5 shows the peak position as a function of the moments of inertia of the top plate. It is clear that the peak displaces as which is to be expected considering the top plate as a harmonic oscillator with frequency . In the same article [12], we also presented a stochastic model quantitatively describing the dynamics of the stick-slip motion.
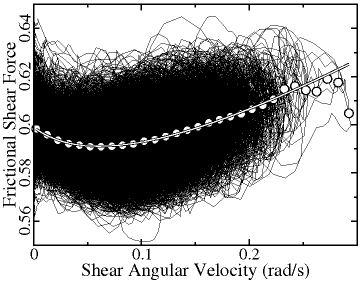
In order to find an effective description of the dynamics, an extensive analysis of the reaction torque has been carried out. Figure 6 shows the reaction torque as a function of the velocity for a set of slip events, apparently showing a completely irregular behaviour. If an average is performed however, then it is possible to identify a statistically regular behaviour. Not surprisingly it is characterized by the usual dynamic instability which is common to solid-on-solid friction and which is at the origin of stick-slip motion. An adequate fit for the curve is (Fig. 6):
| (3) |
What is important is that it contains just two parameters, the high-velocity viscosity and , the location of minimum friction, both of which show little dependence on the experiment parameters , and .
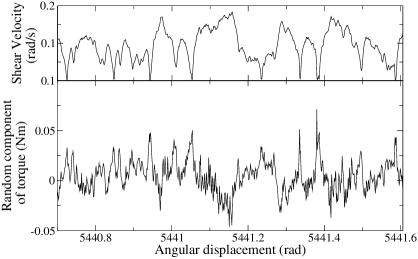
Once the deterministic part of the shear stress has been taken into account by the friction law, depending only on the angular velocity, one remains with only the stochastic part of the torque (which generally behaves as shown in Fig 7). Analysis of the correlation and of the spectral properties of suggests that, with good approximation, it performs a bounded random walk in [12]:
| (4) |
being a unit white noise and and measured from the power spectrum which should have the form
With these few assumptions (Eqs. (3), (1), (4)) we are in a position to simulate the motion of the top plate. The results have been outlined in [12] and the model shows excellent agreement with experimental data such as the slip durations and sizes, and the velocity distributions.
Notably, it is quite interesting that an almost identical model as that described here has been used to explain the origin of Barkhausen noise in magnetic hysteresis cycles [13], where magnetic domain walls respond intermittently to a varying external field. Furthermore, through the use of this simple model, chaotic granular stick-slip systems, heretofore notoriously intractable, have been opened to analysis and characterisation.
6 Summary and conclusions
| 0.12 (0.36) | (0.005) |
|---|---|
| 0.99 | 60 (1) |
The stick slip regime of a granular medium subject to shear can be statistically well characterized in terms of the probablity distribution of stress (torque), velocities, slips durations and extensions, etc.
We measure the torque distribution, which is a physically relevant observable, and we observe non Gaussian, asymmetric fluctuations. This distribution is similar to those encountered in many different phenomena involving correlated variables and has been proposed as a sort of ’universal’ distribution for sums of correlated variables. We show that our results seem to exhibit some degree of stability of the sum variable. However, this result can be explained by simply hypothesizing Gamma-distributed torque values, and so a true universal limit distribution is not implied, particularly given the absence of a favourable convincing theoretical argument.
In our work we show that, despite the complexity of the mesoscopic interactions between the grains, the statistics of fluctuations is quantitatively reproduced by a minimal model, based essentially on the Brownian nature of the frictional granular forces, accounting for the spatial correlation of the friction.
Both the experiment and the model exhibit broad slip duration distributions which feature a characteristic peak. In this work we present an analysis of this peak and show, as expected, that its position is specified by the resonant frequency of the plate and spring.
This work was supported by the Italian FIRB project RBAZ01883Z and the EU project ”TRIGS”, c.n. 043386, COFIN 2005.
References
- [1] R. A. Bagnold, Proc. R. Soc. A 295, (1966) 219-232.
- [2] F. Dalton, F. Farrelly, A. Petri, L. Pietronero, L. Pitolli and G. Pontuale, Phys. Rev. Lett. 95, (2005) 138001-1-4.
- [3] F. Dalton and D. Corcoran, Phys Rev. E 63, (2001) 61312-1-4
- [4] S. Nasuno, A. Kudrolli, A. Bak and J. P. Gollub, Phys. Rev. E 58, (1998) 2161-2171. frictional granular forces, accounting for the spatial correlation of the friction.
- [5] P. A. Thompson and G. Grest, Phys. Rev. Lett. 67, (1991) 1751-1754.
- [6] F. Dalton and D. Corcoran, Phys Rev. E 65, (2002) 31310-1-5
- [7] See e.g. Europhys. Lett. 57 (2002) 310-314 and references therein
- [8] S. Kotz, J. Neumann, J.Geophys.Res. 68, 3635-3641 (1963).
- [9] S. Kotz and J. W. Adams, The Annals of Mathematical Statistics, 35, 277-283, 1964.
- [10] A. Rényi, Calcul des probabilités (Dunod, Paris 1966) 327-331.
- [11] I. M. Jánosi and J. A. C. Gallas, Physica A 271 (1999) 448-457. We are grateful to the authors for sharing with us their data.
- [12] A. Baldassarri, F. Dalton, A. Petri, S. Zapperi, G.Pontuale and L. Pietronero, Phys. Rev. Lett. 96, 118002 (2006) 118002-5.
- [13] S. Zapperi, P. Cizeau, G. Durin, and H. E. Stanley, Phys. Rev. B 58, 6353 (1998); B. Alessandro, C. Beatrice, G. Bertotti, and Ate. Montorsi, J. Appl. Phys. 68, 2901 (1990).