Dust Extinction in High z Galaxies with GRB Afterglow Spectroscopy - The 2175 Å Feature at ††thanks: Based on observations collected under progs. ID 079.D-0429(B) and 177.D-0591(P,Q), using the FORS2 instrument installed at the Cassegrain focus of the Very Large Telescope (VLT), Unit 1 - Antu, operated by the European Southern Observatory (ESO) on Cerro Paranal, Chile.
Abstract
We report the clear detection of the 2175 Å dust absorption feature in the optical afterglow spectrum of the gamma-ray burst (GRB) GRB 070802 at a redshift of . This is the highest redshift for a detected 2175 Å dust bump to date, and it is the first clear detection of the 2175 Å bump in a GRB host galaxy, while several tens of optical afterglow spectra without the bump have been recorded in the past decade. The derived extinction curve gives – depending on the assumed intrinsic slope. Of the three local extinction laws, an LMC type extinction gives the best fit to the extinction curve of the host of GRB 070802. Besides the 2175 Å bump we find that the spectrum of GRB 070802 is characterized by unusually strong low-ionization metal lines and possibly a high metallicity for a GRB sightline ([Si/H, [Zn/H). In particular, the spectrum of GRB 070802 is unique for a GRB spectrum in that it shows clear C I absorption features, leading us to propose a correlation between the presence of the bump and C I. The gas to dust ratio for the host galaxy is found to be significantly lower than that of other GRB hosts with N(H I) cm-2 mag-1, which lies between typical MW and LMC values. Our results are in agreement with the tentative conclusion reached by Gordon et al. (2003) that the shape of the extinction curve, in particular the presence of the bump, is affected by the UV flux density in the environment of the dust.
Subject headings:
dust, extinction – galaxies: ISM – gamma rays: bursts – galaxies: abundances – galaxies: distances and redshifts1. Introduction
Dust extinction curves quantify as a function of wavelength the amount of light ‘lost’ due to scattering and absorption of the light by dust particles along the line of sight from an object to the observer. In the Milky Way (MW), the extinction curve has been extensively mapped and has been shown to follow an empirical single-parameter function for almost all lines of sight (Cardelli et al. 1989). The most characteristic feature of this function is a broad ‘bump’ (i.e., excess extinction) centered at Å first discovered by Stecher (1965). Today, more than 40 years after its discovery, the origin of the feature remains unknown although several candidates have been suggested (see § 1.2).
As outlined below (in § 1.3), a promising method for studying extinction curves in distant galaxies is to use the spectra of the afterglows of gamma-ray bursts (GRBs) as the backlight against which the extinction curve can be inferred. The intrinsic spectral energy distributions (SEDs) of GRB afterglows are very simple, consisting of a single or a broken power-law from the X-ray band to the infrared (IR) and hence it is relatively easy to infer the shape of the extinction curve by measuring the curvature of the optical spectrum, the deviation of the afterglow spectrum extending from the X-ray extrapolation, or from the X-ray–IR interpolation.
In this paper we present the detection of the Å bump in a GRB absorption system at . The detection was briefly reported by Fynbo et al. (2007), but this paper gives the detailed analysis of our detection. The detection of the bump has also subsequently been confirmed based on photometry alone (Krühler et al. 2008). This is the first time that a clear signature of the 2175 Å feature has been observed in a GRB host galaxy and the highest redshift detection of the bump to date.
The paper is organized as follows: In the remainder of this section we discuss the nature and previous detections of the 2175 Å feature (§ 1.2) and the use of GRBs to infer extinction curves (§ 1.3) in more detail. In § 2 we present the observations and data analysis. We discuss the properties of the derived extinction curve in § 3. The results and possible tracers of the bump are presented in § 4 and finally we summarize our conclusions in § 5.
1.1. Extragalactic extinction curves
The study of extinction curves outside the Milky Way is a challenging task and has mostly been limited to galaxies in the Local Group. While the M31 extinction curve resembles that of the Milky Way (Bianchi et al. 1996), the extinction curves of the Large and Small Magellanic Clouds (LMC and SMC) show significant variation. Lines of sight in the LMC can be broadly put into two categories, one having extinction curves similar to that of the Milky Way (”LMC average”) and the other showing extinction curves with a much less prominent bump and a steeper rise into the UV (”LMC2 supershell” Nandy et al. 1981; Misselt et al. 1999; Gordon et al. 2003). While the phrase ”LMC type of extinction” refers to extinction curves of the second type (i.e. less prominent bump and a steep UV rise), it should be kept in mind that Milky Way sightlines also exist in the LMC. Similarly, for the SMC, the canonical SMC extinction curve shows no evidence for a bump and an even steeper rise into the UV (Prevot et al. 1984; Gordon et al. 2003) although one out of five lines of sight shows the 2175 Å bump (Lequeux et al. 1982). It is also worth noting that there are a few known lines of sight in the Milky Way with LMC type of extinction (Clayton et al. 2000) and a single line of sight with a measured SMC type of extinction (Valencic et al. 2003).
Relatively little is known about dust extinction outside the Local Group as the method of measuring extinction curves by comparing the spectra of single stars is not applicable at larger distances. Several methods have been attempted, including studying statistical samples of reddened and standard quasars (Pei et al. 1999; Vladilo et al. 2008), studying individual supernova (SN) Ia lightcurves and using gravitationally lensed quasars. A recent overview of these studies and their results can be found in Elíasdóttir et al. (2006). The SEDs of GRBs may also be used, as discussed in § 1.3. These studies have found varying types of extinction which can deviate significantly from MW-type extinction, leaving open the question of how common MW type dust is. In particular, prior to the present study there have only been three robust detections of the Å bump in individual extragalactic systems beyond the local group. The first is in a lensing galaxy at a redshift of (Motta et al. 2002). The second is from a damped Ly system at (Junkkarinen et al. 2004). The third is in an intervening absorber at toward GRB 060418 (Ellison et al. 2006).
Extinction curves are the prime diagnostic tool available to study dust in the optical/UV regime. They depend sensitively on the composition of the dust (Henning et al. 2004), allowing estimates to be made of the nature and the origin of dust and its dependence on cosmic time, metallicity, etc. Furthermore, in studies of distant objects, e.g., using SNe Ia as standard candles or determining flux ratios of strongly lensed QSOs, it has become increasingly important to accurately determine the amount and wavelength dependence of the dust extinction.
1.2. The nature and origin of the 2175 Å extinction feature
Fitzpatrick & Massa (1986) studied the 2175 Å interstellar extinction bump in the direction of 45 reddened stars in the Milky Way, and found that it displays a peak whose central wavelength is remarkably constant with extreme deviation of only Å from the mean position of Å. As this is significantly larger than the measurement uncertainty it seems to indicate a real, but small, variation of the peak position. The full width at half maximum (FWHM) of the bump has a larger range of intrinsic values, from to Å. There seems to be no correlation between the width and the central wavelength of the bump.
The fact that the 2175 Å feature becomes progressively fainter in the MW, LMC and SMC has been attributed to the progressively lower metal abundances of the LMC and SMC (Fitzpatrick 2004) or to differences in the radiative environment (Gordon et al. 1997; Clayton et al. 2000; Mattsson et al. 2008). Gordon et al. (2003) studied the differences in the extinction of the MW, SMC and LMC finding tentative evidence that the bump strength correlates with dust-to-gas ratio.
Noll et al. (2007) found in their study of 108 massive, UV-luminous galaxies at that there is a correlation between heavy reddening and the presence of a 2175 Å feature. The least reddened objects have SEDs consistent with the average featureless and steep extinction curve of the SMC. For their objects at a significant UV bump is present in galaxies that appear disk-like and which host a rather large fraction of intermediate-age stars (i.e., from 0.2 to 1–2 Gyr old). More clumpy and irregular objects seem to have extinction curves resembling those of nearby starburst galaxies.
Several candidates have been proposed as the dust particles responsible for the bump ranging from iron-poor silicate grains (Steel & Duley 1987) to carbonaceous materials such as carbon-onions (Henrard et al. 1997), graphite grains (Stecher & Donn 1965; Draine 1989) or the polycyclic aromatic hydrocarbons (PAHs) believed also to be responsible for the prominent broad emission features found in the mid-infrared (Duley & Seahra 1998; Duley 2006; Cecchi-Pestellini et al. 2008).
Graphite has been considered a very promising, though contentious, candidate for explaining the 2175 Å bump (e.g., Stecher & Donn 1965; Fitzpatrick & Massa 1986; Mathis 1994; Voshchinnikov 1990; Sorrell 1990; Draine & Malhotra 1993; Rouleau et al. 1997; Will & Aannestad 1999; Andersen et al. 2003; Clayton et al. 2003). In an extensive investigation, Draine & Malhotra (1993) conclude that if graphite particles are the carriers of the 2175 Å peak, a variation in their optical properties must be present, e.g., as a result of varying amounts of impurities, variations in crystallinity, or changes in its electronic structure due to surface effects. The observed lack of correlation between the central wavelength and the FWHM of the peak is therefore a challenge for the hypothesis that graphite particles are the source of this peak.
Large PAH molecules are expected to at least contribute to the 2175 Å feature as the interior carbon atoms have electronic orbitals closely resembling those in graphene and an oscillator strength for each C expected to be close to the value for graphite (Draine 2003). Joblin et al. (1992) have suggested that PAHs could be entirely responsible for the feature, which has been questioned by Mathis (1994) due to the lack of an absorption feature at about 3000 Å in the spectra of PAHs. Another argument against the PAHs as the main contributers is that the constancy in wavelength along with a rather wide variation in the width, seems surprising if the bump is caused by a mixture of widely varying materials. Such properties are more likely to occur as a result of coating (or surface hydrogenation) of carbon grains (Mathis 1994; Draine & Li 2007; Cecchi-Pestellini et al. 2008).
Finally, iron-poor silicates in the form of partially hydrogenated amorphous Mg2SiO4 particles have been suggested as the carriers of the 2175 Å peak (Steel & Duley 1987). The absorption is observed in silicates of greatly differing composition and under a wide range of different sample preparations and outgasing conditions. However, Mathis (1996) indicated that the silicates may be problematic as carriers.
1.3. GRB afterglows and extinction
GRB afterglows have very simple intrinsic synchrotron spectra which are essentially featureless power laws () across the wavelength range of interest for measuring extinction curves (e.g., Galama et al. 1998; Granot & Sari 2002; Sari et al. 1998). This is a significant advantage over using QSOs or galaxies as background objects. In cases where the GRB physics places the cooling frequency between the optical and X-ray regime (at the time of observation) there will be a cooling break in the spectrum leading to a change in spectral slope of (softer spectrum in the X-rays). The X-ray slope is usually around 1.0–1.2 (see e.g., Liang et al. 2007) and so the intrinsic optical slope is typically between 0.5 and 1.2. Moreover, the optical-NIR range is typically well-described by a single power-law segment.
Reichart (1998) first attempted to constrain the extinction towards GRB 970508 (see also Reichart 2001). Several subsequent studies confirmed that a simple SMC-type/linear extinction model provided good fits to observations of several GRB afterglows (Bloom et al. 1998; Castro-Tirado et al. 1999; Jensen et al. 2001; Fynbo et al. 2001a; Price et al. 2001; Savaglio & Fall 2004; Jakobsson et al. 2004b; Kann et al. 2006). Findings of a low dust-to-gas ratios in GRB afterglows exhibiting damped Ly absorption in the GRB host galaxy supports the apparent prevalence of SMC-type dust in GRB environments (Jensen et al. 2001; Hjorth et al. 2003; Vreeswijk et al. 2004).
Gray (wavelength-independent) extinction laws (Galama et al. 2003; Stratta et al. 2007; Perley et al. 2008; Nardini et al. 2008) or MW dust (Kann et al. 2006; Schady et al. 2007) have been suggested in rare instances for GRB environments although it should be noted that these claims are somewhat model dependent (gray dust) or statistically insignificant (MW-type dust). The 2175 Å feature itself has been searched for and ruled out in GRB 050401 (Watson et al. 2006). In GRB 000926 (Fynbo et al. 2001a) and GRB 020124 (Hjorth et al. 2003) SMC-type extinction was preferred although the existence of a 2175 Å bump was not sampled by the broad-band observations. Vreeswijk et al. (2006) found a bump in the spectrum of GRB 991216 but at 2360 Å if at the redshift of the GRB (). To be consistent with restframe 2175 Å it would have to be due to an even more distant absorber at which was however not detected as an absorption system in the afterglow spectrum. The first (and thus far, only) clear detection of the 2175 Å bump in the foreground of a GRB, consistent with a detected intervening Mg II absorber (), was reported by Ellison et al. (2006).
A significant fraction of GRB afterglows are optically ‘dark’ (Fynbo et al. 2001b; Jakobsson et al. 2004a; Rol et al. 2005). It is likely that a large fraction of these afterglows go undetected in the optical because of extinction (e.g., Djorgovski et al. 2001). Recently Jaunsen et al. (2008) and Tanvir et al. (2008) demonstrated the validity of this dust obscuration hypothesis by detecting two highly reddened systems. These studies highlight the difficulty in probing systems with significant extinction at high redshift: GRBs with high extinction are generally not accurately localized (because of the lack of an optical afterglow position) and there are no detailed constraints on their extinction laws, particularly in the UV, for systems with of order . Such selection effects must be kept in mind before making statistical inferences from extinction laws of GRB afterglows.
Studies using the X-ray extrapolation to set limits on the total extinction (Vreeswijk et al. 1999) or using the optical spectral curvature to determine the reddening (Ramaprakash et al. 1998) have now been carried out for nearly a decade. These studies may be further improved if one obtains the largely extinction-free IR flux, typically needing observations in the mid-IR, and is the subject of our ongoing Spitzer campaign (see also Heng et al. 2008).
2. Observations and data analysis
2.1. VLT imaging, spectroscopy and redshift of GRB 070802
GRB 070802 (Barthelmy et al. 2007) was detected by Swift (Gehrels et al. 2004) on 2007 Aug 2.29682 UT. The ESO VLT started observations about one hour after the burst in Rapid Response Mode, starting with a photometric sequence spanning from the -band through , , and to the -band in excellent seeing conditions ( arcsec) and at low airmass (). We detected the source previously detected by Berger & Murphy (2007) in all bands (see Table 1). The source was very red and classifies as a dark burst according to the definition of Jakobsson et al. (2004a). Based on 5 R-band points taken from about 1 to 3 hours after the trigger we infer a decay slope of 0.620.05 consistent with the measurement in Krühler et al. (2008) at the same time. We infer a celestial position of , (calibrated against USNO-B1.0). Following the afterglow detection, spectroscopy was immediately started, using the FORS2 instrument equipped with the grism 300V ( Å FWHM spectral resolution). A total of 5400 s of exposure were acquired, split into three exposures, with mean epoch of Aug 2.38935 UT (2.2 hours after the burst). The spectra were obtained in excellent seeing conditions (about ) and a relatively small airmass of 1.2. We used a slit and therefore slitloss should be neglicible. The spectra were flux calibrated using a spectrum of the spectrophotometric standard star LTT1020 obtained on the same night.
| Mean epoch | Time since | Exposure | Filter | Mag. |
|---|---|---|---|---|
| (2007 Aug. UT) | trigger (hr) | times (s) | (Vega) | |
| 2.33589 | 0.94 | 60 | 20.390.05 | |
| 2.33753 | 0.98 | 40 | 21.360.10 | |
| 2.33443 | 0.90 | 30 | 21.860.06 | |
| 2.34353 | 1.12 | 30 | 22.030.06 | |
| 2.34451 | 1.14 | 60 | 22.180.06 | |
| 2.35186 | 1.32 | 60 | 22.260.05 | |
| 2.42306 | 3.03 | 60 | 22.720.05 | |
| 2.33881 | 1.01 | 40 | 22.690.15 | |
| 2.34066 | 1.05 | 150 | 23.990.28 |
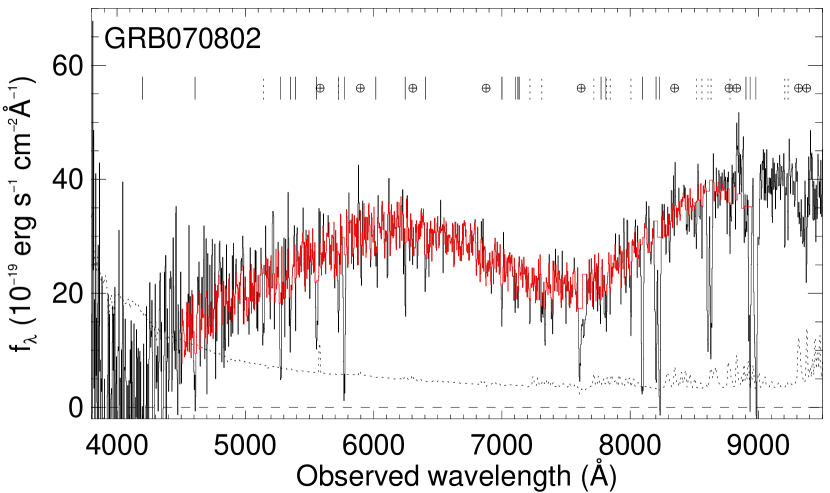
The optical spectrum of the afterglow is shown in Fig. 1. The afterglow spectrum is characterized by a red continuum with a broad dip centered at Å. There is a break in the spectrum at Å blueward of which little residual flux, if any, is detected. We identify the latter feature as the imprint of the Ly forest of absorption lines at . Numerous narrow absorption lines are detected throughout the spectrum (see Table 2). The highest redshift absorber is a strong metal line system at , which we adopt as the GRB host galaxy redshift. In addition we detect two intervening Mg II absorption systems at and . The system at is very strong with a restframe equivalent width of the 2796 Å line of Å.
| [Å] | [Å] | Feature | [Å] | |
|---|---|---|---|---|
| 4200.0 | 1215.7 | 2.455 | Ly | |
| 4607.9 | 1335.3 | 2.4529 | C ii / C ii* | 166 |
| 5273.9 | 1526.7 | 2.4544 | Si ii | 102 |
| 5350.9 | 1548.2/1550.8 | 2.4533 | C iv | 7.31.8 |
| 5390.7 | 1560.3 | 2.4549 | C iaaThe line is blended with C I∗ and C I∗∗ | 2.41.2 |
| 5556.4 | 1608.4 | 2.4546 | Fe ii | 10.51.6 |
| 5724.5 | 1656.9 | 2.4550 | C i | 4.71.1 |
| 5771.2 | 1670.7 | 2.4544 | Al ii | 14.31.2 |
| 6246.5 | 1808.8 | 2.4549 | Si ii | 3.91.0 |
| 6404.9 | 1854.7 | 2.4533 | Al iii | 2.41.0 |
| 7000.1 | 2026.1 | 2.4550 | Zn ii | 4.21.0 |
| 7000.1 | 2026.5 | 2.4553 | Mg i | |
| 7104.1 | 2056.3 | 2.4548 | Cr ii | 2.00.9 |
| 7124.8 | 2062.2 | 2.4545 | Cr ii | 2.530.9 |
| 7126.3 | 2062.7 | 2.4545 | Zn ii | |
| 7810.7 | 2260.8 | 2.4549 | Fe ii | 6.61.0 |
| 8094.1 | 2344.2 | 2.4515 | Fe ii | 16.52.0 |
| 8200.5 | 2374.5 | 2.4536 | Fe ii | 12.71.5 |
| 8228.0 | 2382.8 | 2.4531 | Fe ii | 18.81.5 |
| 8277.1 | 2396.4 | 2.4540 | Fe ii* | 2.91.4 |
| 8308.7 | 2405.6 | 2.4539 | Fe ii** | 2.81.4 |
| 8902.8 | 2576.9 | 2.4549 | Mn ii | 5.01.2 |
| 8934.4 | 2586.7 | 2.4538 | Fe ii | 19.51.3 |
| 8979.5 | 2600.2 | 2.4534 | Fe ii | 29.01.3 |
| 8515.5 | 2586.7 | 2.2920 | Fe ii | 2.30.6 |
| 8560.6 | 2600.2 | 2.2923 | Fe ii | 2.20.6 |
| 9208.6 | 2796.3 | 2.2931 | Mg ii | 1.80.6 |
| 9226.5 | 2803.5 | 2.2911 | Mg ii | 1.40.6 |
| 5141.4 | 1670.7 | 2.0774 | Al ii | 6.01.7 |
| 7218.7 | 2344.2 | 2.0794 | Fe ii | 3.41.0 |
| 7311.4 | 2374.5 | 2.0791 | Fe ii | 4.51.0 |
| 7335.7 | 2382.8 | 2.0786 | Fe ii | 4.91.0 |
| 8005.9 | 2600.2 | 2.0790 | Fe ii | 4.71.1 |
| 8607.0 | 2796.3 | 2.0780 | Mg ii | 11.30.6 |
| 8631.0 | 2803.5 | 2.0787 | Mg ii | 11.50.6 |
| 8780.1 | 2853.0 | 2.0775 | Mg i | 2.71.1 |
Note. — The equivalent widths are given in the observer frame, .
2.1.1 H I content and metal lines
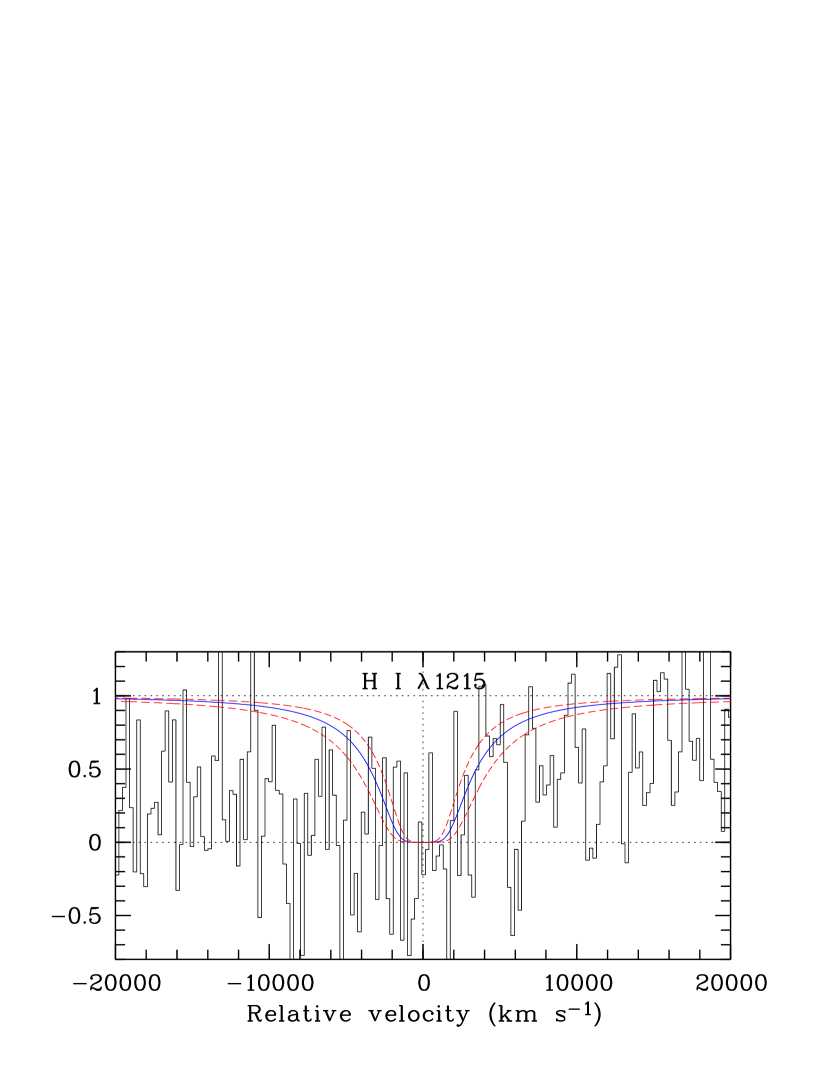
We measured the total neutral hydrogen column density (in units of cm-2 throughout) of the absorber at the GRB redshift by fitting a damped Ly absorption line profile fixed at the redshift of the detected metal lines. Both the saturated core and the red damped wing of the Ly line are constrained by the residual flux at Å. We derived H I (see Fig. 2).
As listed in Table 2, a large number of metal species are identified at the GRB redshift. The detected lines from singly ionized elements are very strong compared to other GRB- or QSO-DLA sightlines. For instance, Å for Si II is larger than for any LBG/GRB/QSO-DLA observed to date, hinting at a high metallicity (Prochaska et al. 2008). The restframe equivalent width of Si II , Å is also the largest ever detected in any extragalactic sightline. Assuming the latter line is located on the linear part of the curve of growth implies that Si II. This is a very conservative lower limit to the actual column density and translates into a conservative lower limit on the metallicity of [Si/H. Note also that Si could be depleted onto dust grains (Petitjean et al. 2002).
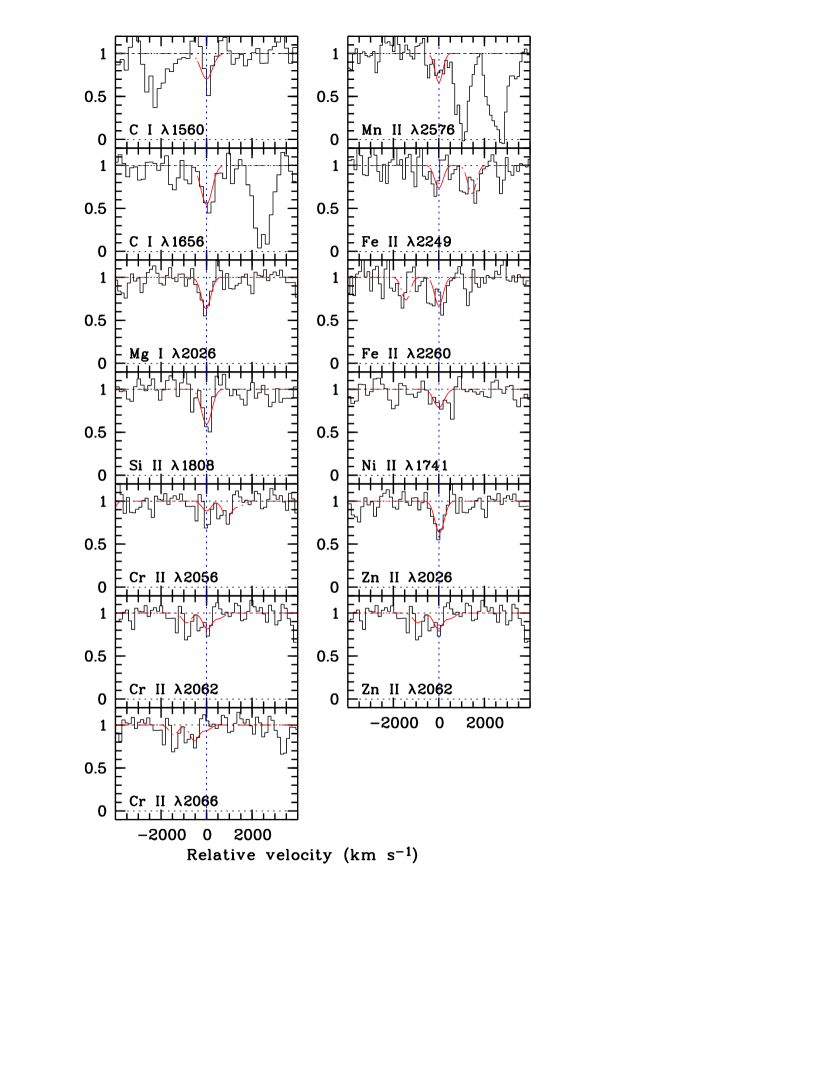
We further performed Voigt-profile fitting (see Table 3) using some of the weakest (least saturated) metal lines (see Fig. 3). The absorption line at Å is likely to be a blend of Zn II and Mg I 2026 with possibly similar strengths. It is therefore important to fit both transitions simultaneously. The other Zn II (2062) line is also blended (with one of the Cr II triplet lines). Therefore, the best line to estimate the metallicity remains Si II 1808. All lines were simultaneously fitted with a single component constraining their redshifts as well as their broadening parameter (assumed to be purely turbulent) to have identical values. We find [Si/H and also consistently get [Zn/H. Assuming the Zn II 2026 line is located on the linear part of the curve-of-growth implies that [Zn/H]¿-0.35 but the actual metallicity could be lower than that due to the unknown contribution of the Mg I 2026 line to the observed feature (see above).
| Ion | Transition lines used | |
| (Å) | (cm-2) | |
| Si II | 1808 | 16.6(0)0.3(2) |
| Zn II | 2026; 2062 | 13.6(7)0.6(5) |
| Mg I | 2026 | 14.4(1)0.6(4) |
| C I | 1560; 1656 | 14.9(5)0.2(5) |
| Fe II | 2249; 2260aaEven though the FeII2249 and CrII2066 lines are not individually detected above 2 in the spectrum we still use the appropriate regions in the spectrum to constrain the fits. | 16.1(6)0.1(8) |
| Cr II | 2056; 2060; 2066aaEven though the FeII2249 and CrII2066 lines are not individually detected above 2 in the spectrum we still use the appropriate regions in the spectrum to constrain the fits. | 14.0(4)0.4(0) |
| Ni II | 1741 | 14.8(9)0.2(8) |
| Mn II | 2576 | 13.8(9)0.1(8) |
The large error bars on the measured column densities are mainly a consequence of the large uncertainty on the broadening parameter which we find to be: km s-1. One might argue that could be significantly smaller (e.g., km s-1) in which case the column densities would be much larger than found in our best fit. However, it has been shown that the width of metal line profiles in DLAs is larger at higher metallicities (Ledoux et al. 2006; Prochaska et al. 2008). Therefore, a large value is consistent with the relatively high metallicity inferred, which is among the highest measured for any GRB (Fynbo et al. 2006).
The measured abundance ratios are consistent with what is seen in other GRB- or QSO-DLAs. We find that the mean depletion of Fe-peak elements (Fe, Cr and Mn) compared to Si is dex. This is not particularly high, but yet significant implying that dust is present in this system. According to our best fit, the Si metallicity could be as large as solar. This in fact is quite likely taking into account that Si is affected by dust depletion (Petitjean et al. 2002).
2.1.2 Neutral species
In the afterglow spectrum, we clearly identify neutral carbon lines, namely C I 1560,1656 (blended with C I⋆ and C I⋆⋆; see Fig. 3). These are the first ever clear detections of C I in a GRB-DLA which typically have very low C IC II ratios (Prochaska et al. 2007). The two features are very strong. We measured Å at Å which is dominated by C I 1656 absorption. Using the above fit results, we get log NC ISi II. This can be compared to QSO-DLAs from Fig. 10 of Srianand et al. (2005) showing that H2 is most likely present as well in this system, although this can not be verified as it falls too much in the blue into the Ly forest, and because of low signal to noise and spectral resolution. On the other hand, the strength of the detected C IV doublet line is only modest and similar to most other GRB sight-lines.
2.1.3 Non detection of Fe II⋆ in GRB 070802.
Over the past few years, excited lines of Fe II have been detected along several GRB sightlines (e.g., Savaglio & Fall 2004; Chen et al. 2005), which have been shown to be due to indirect excitation by UV photons produced by the GRB afterglow (Prochaska et al. 2006; Dessauges-Zavadsky et al. 2006; Vreeswijk et al. 2007). For two specific GRBs, modeling of the afterglow flux exciting a cloud of Fe II and/or Ni II atoms has led to an estimate of the distance between the GRB and the bulk of the neutral absorption material (responsible for low-ionization lines from ions such as C I, O I, Fe II, Cr II, Mn II, Si II, Zn II, Ni II): 2 kpc for GRB 060418 (Vreeswijk et al. 2007), and 0.5 kpc for GRB 050730 (Ledoux et al. 2009, submitted). For the GRB 070802 sightline we detect consistent features at the expected positions of the Fe II2396 and Fe II2405 lines at z=2.455 but, since the lines are likely to be at the same time slightly saturated and blended, we cannot infer from them secure column densities. Based on the distance estimates in previous GRBs we note that the bulk of the neutral material, which likely corresponds to the region where the extinction bump is originating, is probably at least 0.5 kpc away from GRB 070802.
2.1.4 Constraints on the foreground absorber extinction
The foreground absorption system at exhibits strong Mg II ( Å) and Fe II lines with equivalent width ratio . Additionally the detected Mg I 2852 line has Å. These characteristics make this absorber very likely a DLA (see, e.g., Rao et al. 2006, their fig. 11). We note that such a strong Mg II absorber is very rare for QSO sightlines, but it has been suggested that GRB sightlines may have stronger absorbers although the reason for this is still unknown (Prochter et al. 2006) .
To constrain from the foreground absorber we look at the metal lines as metallicities and dust depletion factors (and hence the dust content) correlate in DLAs (Ledoux et al. 2003). The non-detection of Zn II 2026 leads to an upper limit on the zinc column density. Unfortunately, the constraint we can derive from the spectrum, Zn II at the level, is fairly weak because there is an absorption feature immediately bluewards of the expected position of the Zn II line. Moreover, we cannot use Si II instead of Zn II because the expected position of the Si II 1808 line at is blended with Fe II 1608 from the GRB host galaxy absorber at . The best constraint on therefore comes from the observed Fe II lines at . The ratio of the weakest detected Fe II line, i.e., Fe II 2374, at to that at is 4.3. Because of saturation effects, this value is a lower limit on the ratio of the Fe II column densities. Altogether, the weaker Fe II lines at and the non-detection of Zn II 2026 at are an indication of lower metallicity because in DLAs the dust depletion factor is only a slowly decreasing function of metallicity (e.g., Ledoux et al. 2003; Noterdaeme et al. 2008). A factor of leads to Zn II and therefore (Vladilo & Péroux 2005, their fig. 1).
An alternative way to estimate the contribution of the foreground absorber is to us the relation reported by Ménard et al. (2008, their eq. (18)) which uses the equivalent width of the Mg II line to estimate . Assuming a standard MW extinction law, with , this translates into which is well below the limit derived above.
2.2. X-ray observations
The X-ray telescope onboard Swift observed the afterglow of GRB 070802 beginning observations in photon counting mode at 147 s after the trigger time ( 07:07:26 on 2 August 2007). The data were extracted and reduced in a standard way using the HEAsoft software (version 6.2) and the most recent calibration files. The X-ray spectrum (with a total exposure time of 3419 s in the interval – s) was extracted and fit with a power-law with absorption fixed at the Galactic level ( cm-2) (Dickey & Lockman 1990) and freely variable absorption at the redshift of the host galaxy. The best fit resulted in a power-law with a photon spectral index (, confidence level) and an equivalent absorbing hydrogen column density of cm-2 at assuming solar abundances. To produce the X-ray segment of the near-infrared to X-ray spectral energy distribution (SED), this X-ray spectrum was normalized to the flux level obtained from the X-ray lightcurve at the SED time ( s) and corrected for both absorptions. No significant evidence (above the level) was found for spectral variations over the period of the spectrum, by comparing the first 400 s and the remainder of the observation.
2.3. The host galaxy
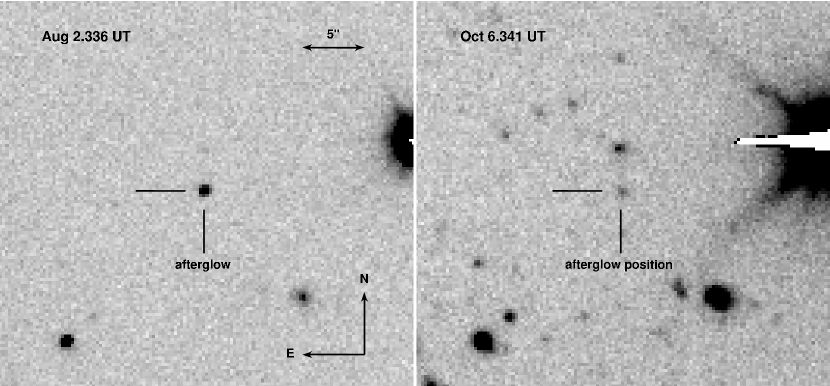
- and -band observations of the host galaxy of GRB 070802 were obtained with the ESO VLT during the nights of 27 September 2007 and 5 October 2007 (57 and 65 days after the GRB). At the afterglow position, a source is clearly detected with (Fig. 4). A faint source is also visible in , with magnitude . The centroid of the host is offset by arcsec with respect to the afterglow position (1.2 kpc at ). From the observed magnitude (rest frame 6270 Å), and assuming a power-law spectrum consistent with the color (), we can estimate the absolute -band magnitude of the host to be (uncorrected for extinction) which is fairly luminous for a GRB host (Fruchter et al. 2006; Savaglio et al. 2009).
3. The extinction curve
The spectrum shows strong extinction features, with a clear detection of a bump near Å in the restframe of the host (Fig. 1). To extract the continuum part of the spectrum to use for the extinction curve fitting we start by selecting the wavelength range –Å. We then remove emission and absorption lines by recursively fitting the spectrum to an 8th order polynomial removing parts which deviate by more than (see Fig. 1).
The intrinsic flux of the afterglow is modeled as
| (1) |
(where is frequency, the intrinsic slope and is the flux at ) but is partially extinguished due to dust along the line of sight. The observed flux is therefore given by
| (2) | |||||
| (3) |
where the total extinction is , is the extragalactic extinction along the line of sight as a function of the wavelength and is the extinction in the Milky Way. The extragalactic extinction can be caused by both extinction in the host of the GRB and in foreground objects, i.e. . The observed flux is corrected for extinction in the Milky Way using the maps of Schlegel et al. (1998, , ), leaving
| (4) |
which is the intrinsic flux of the burst affected only by extragalactic extinction along the line of sight. Solving for the extinction, we find
| (5) | |||||
| (6) |
where is the wavenumber. The absolute extinction along the line of sight can therefore be determined if the underlying spectral slope and the normalization at are known.
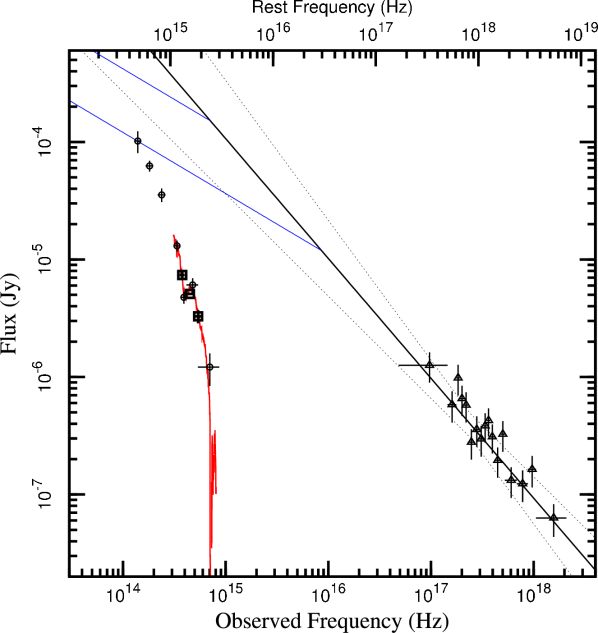
The simple shape of the intrinsic spectra of GRB afterglows (see § 1.3) allows us to constrain both and the normalization. Assuming that there is no cooling break in the intrinsic spectrum, one may use the slope and normalization derived from the X-ray data, i.e. . Alternatively, assuming that there is a cooling break in the spectrum, the slope must be while the normalization depends on the location of the cooling break. These two possibilities will both be addressed here and are depicted in Fig. 5. In addition, we will start by assuming that all the extinction is caused by dust in the host galaxy of GRB 070802, i.e. that
| (7) |
The possible contribution from the foreground Mg II absorption systems (§ 2.1.4) will be addressed in § 3.3.
We fit the derived extinction curves to four types of extinction laws, i.e. MW type extinction as parametrized by Cardelli et al. (1989), LMC and SMC type extinction as parametrized by Pei (1992) and the modified parametrization for the UV of Fitzpatrick & Massa (2007, FM). A description of these extinction laws and how the Pei (1992) parametrization compares to the Gordon et al. (2003) SMC and LMC extinction curves is given in Appendix A. The parametrization of Fitzpatrick & Massa (2007) does not directly tie the slope to the bump, but keeps the parameters of each independent. It therefore has much greater freedom in fitting the curve and is able to accurately trace the derived extinction. The parametrization however assumes that and have been independently derived from the optical extinction. As our data do not reach into the restframe optical, we have opted to fix and allow to vary while fitting the UV. We also tested choosing and and find that it leads to a change in and (one of the parameters of the FM extinction law, see App. A) of around but does not significantly affect the other parameters.
We compare the extrapolation of our fits to the infrared photometric points of Krühler et al. (2008). We used the spectral energy distribution (SED) from GROND created by citetkruhler08 to derive the near-infrared data we show here simply by extrapolating the mean SED time of Krühler et al. (2008) to our mean SED time using our estimate of the optical decay rate. We note that these points are not used in constraining the fits.
3.1. The extinction assuming no cooling break
If there is no cooling break between the X-ray and optical regimes, clearly the X-ray and optical emission lie on the same power-law. Under this assumption, the intrinsic slope and normalisation in the optical can therefore be derived from a simple extrapolation of the X-ray data. Any discrepancy between the observed optical flux and the extrapolation is then interpreted as extinction along the line of sight. A slight complication is introduced by the non-simultaneity of the observations in different bands, since the flux decays with time. However the uncertainty introduced by this correction is not large, since the optical photometry mean times are s, s and is interpolated between observations at s and s, and the X-ray flux is derived from a lightcurve that covers this time period.
Fig. 5 shows the X-ray spectrum (scaled to the SED time, ) and its extrapolation into the optical. The fluxed optical spectrum (mean time hours) was scaled to the -band data point. It is worth noting that the scaled optical spectrum agrees with the observed and photometric data, indicating that the small temporal extrapolations are correct and that there is no significant spectral change in the optical in this period. The extinction curve, shown in the top panel of Fig. 6, is then derived from the difference between the spectrum and the extrapolated slope.
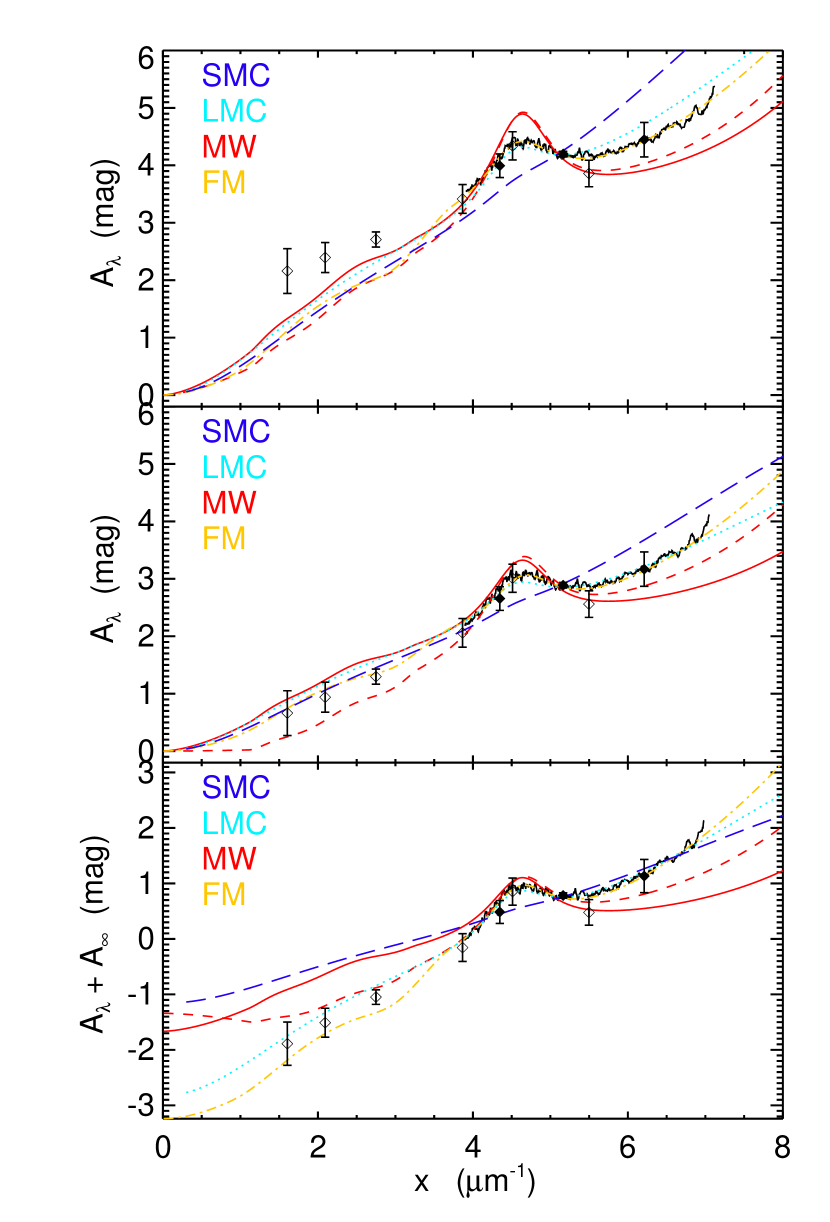
To study the properties of the extinction curve, we fit it to the four previously mentioned extinction laws with the additional constraint that the extinction must go to zero for infinite wavelengths. The derived extinction and the fits are shown in the top panel of Fig. 6 and the parameters of the fit are given in Tables 4 and 5. The freedom of the FM parametrization allows for a good fit (), the LMC also provides a reasonable fit (), while the SMC and MW fail to reproduce the extinction curve. However, the infrared photometry points of Krühler et al. (2008) clearly do not agree with any of the fits and require the extinction curve to take a very sharp break in its steepness at m-1 which would suggest that the host of GRB 070802 has a very strange form of extinction law. However, a more plausible explanation is that the assumed intrinsic slope is wrong, either due to the extrapolation or because of the presence of a cooling break in the spectrum (see § 3.2).
| Type | / | dof | ||||
|---|---|---|---|---|---|---|
| 1.02 | MW | 0.870.03 | 1.80.1 | / | ||
| 1.02 | MW | 1.5330.002 | 3.1 | / | ||
| 1.02 | FM | 1.3410.002 | 3.1 | / | ||
| 1.02 | LMC | 1.4740.002 | / | |||
| 1.02 | SMC | 1.2690.002 | / | |||
| 1.02 | MW+SMC | 3.1 | / | |||
| 1.02 | LMC+SMC | / | ||||
| 1.19 | MW | 1.920.03 | 2.90.1 | / | ||
| 1.19 | MW | 2.0520.002 | 3.1 | / | ||
| 1.19 | FM | 1.8200.002 | 3.1 | / | ||
| 1.19 | LMC | 1.9760.002 | / | |||
| 1.19 | SMC | 1.7050.002 | / | |||
| 1.19 | MW+SMC | 3.1 | / | |||
| 1.19 | LMC+SMC | / | ||||
| 0.87 | MW | 0.320.03 | 0.90.1 | / | ||
| 0.87 | MW | 1.0520.002 | 3.1 | / | ||
| 0.87 | FM | 0.9050.002 | 3.1 | / | ||
| 0.87 | LMC | 1.0180.002 | / | |||
| 0.87 | SMC | 0.8830.002 | / | |||
| 0.87 | MW+SMC | 3.1 | / | |||
| 0.87 | LMC+SMC | / |
| 1.02 | |||||||
|---|---|---|---|---|---|---|---|
| 1.19 | |||||||
| 0.87 | |||||||
| 0.52 | |||||||
| 0.69 | |||||||
| 0.37 |
From Fig. 5 we see that due to the several order of magnitudes extrapolation, the 1 difference in translates into a difference of 1 magnitude in the optical. While going towards steeper slopes will make the apparent ’break’ in the extinction curve greater, a shallower slope will act to reduce it as seen in Fig. 6. Redoing the analysis for a shallower slope corresponding to 1 deviation (i.e. ) results in the extinction curve shown in the middle panel of Fig. 6. The parameters of the fit, for both 1 deviations are given in Tables 4 and 5. The goodness of fit for the MW, SMC and LMC is improved for the shallower slope, while the effect on the FM fit is minimal. The fits are also more consistent with the additional photometric points in the infrared of Krühler et al. (2008). We note however that most GRBs have (see e.g., Liang et al. 2007, their fig. 3, with ).
3.2. The extinction curve assuming a cooling break
A cooling break in the intrinsic spectrum occurring between the X-ray and the optical data, i.e. , would result in an intrinsic spectrum at optical wavelengths of the form
| (8) |
where the normalization depends on the location of the cooling break, , by
| (9) |
The absolute extinction is then given by
| (10) | |||||
| (11) |
The first term of the sum can be determined as before from the X-ray data, while the second part of the sum
| (12) |
is an additional unknown to be added to the fits. Its effect is to shift the extinction curve up or down (i.e., the value of at is ). Constraining the break to occur between the optical and X-ray regimes translates into constraints on the allowed values of corresponding to setting to be the upper of the optical data and the lower of the X-ray data. An additional requirement is that the extinction remains positive.
We fit the three local extinction laws (MW, SMC and LMC) to the curve in addition to the FM parametrization. Again we find that of the three local extinction laws the LMC provides the best fit (), but the FM parametrization still gives the best overall fit (). In this instance, the infrared photometric points of Krühler et al. (2008) agree with the extrapolated LMC and FM fits.
3.3. Possible contribution from a foreground object
The MW extinction law provides a poor fit to the observed extinction, in part because the observed bump is shallower than the predicted MW bump and the rise into the UV is steeper (see e.g. Fig. 6). However, as Fig. 7 shows, such effects can be caused if part of the extinction is due to a foreground object without a bump.

The spectrum of GRB 070802 shows two intervening Mg II absorption systems which might also cause part of the reddening. Neither foreground system shows any signs of a Å bump. If the foreground absorber had a Å bump in its restframe, it would act to broaden and shift the peak of the observed bump in the restframe of the host, which is inconsistent with the data. Therefore, the most straightforward way to model them is with an SMC type extinction law. As this extinction law is roughly linear, there is no way of separating the effect of two systems without additional constraints on the dust content of the two systems. As the absorber at has much weaker absorption lines, and therefore by assumption much weaker extinction, we will only look at the possible contribution from the system at .
We will therefore limit ourselves to studying the possibility of the extinction being of the form
| (13) |
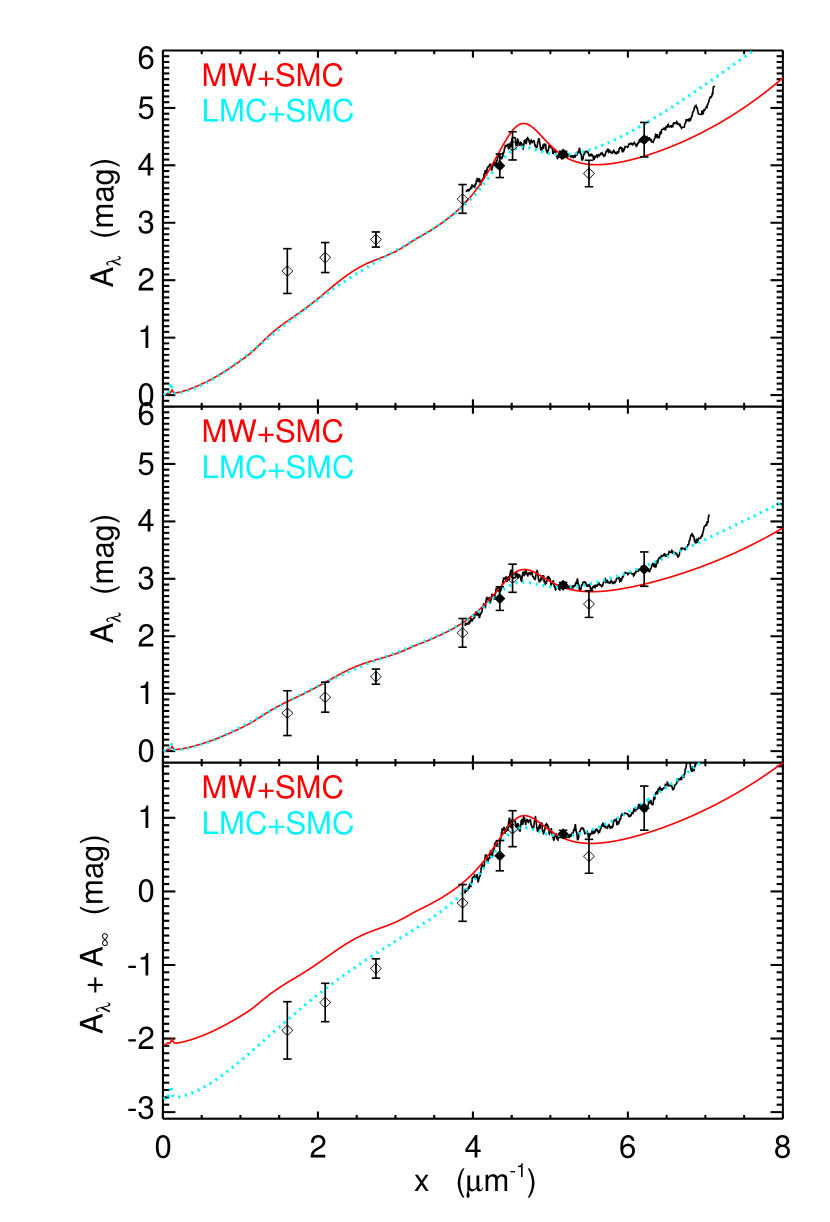
where is the extinction in the host galaxy and is the extinction in the foreground Mg II absorber. We have already seen that the extinction curve is poorly fit by an SMC type extinction, as it lacks the characteristic bump. We will therefore parametrize the extinction of the host galaxy of GRB 070802 as either a MW (with fixed ) or an LMC type, while the foreground absorber will be parametrized as an SMC type. In addition, we place the limit for the foreground absorber based on the discussion in § 2.1.4.
The results are shown in Fig. 8 and tabulated in Tables 4 and 6. We find that for the LMC, the addition of the foreground contributor does not improve the fits and the best fits are found by setting to be zero. For the MW, the fits are improved and the best fit is found by setting to its maximum value of . The MW fits are still worse than the LMC leading us to conclude that the extinction of GRB 070802 is not well fitted by a MW type extinction.
| Type | / | dof | |||||
|---|---|---|---|---|---|---|---|
| 0.52 | MW | (0) | 0.04 | 00.003 | / | ||
| 0.52 | MW | 0.680.02 | 0.06 | 3.1 | / | ||
| 0.52 | FM | 1.2590.002 | () | 3.1 | / | ||
| 0.52 | LMC | 1.270.02 | 0.07 | / | |||
| 0.52 | SMC | 0.520.01 | 0.04 | / | |||
| 0.52 | MW+SMC | 3.1 | (0.25) | 1030/ | 973 | ||
| 0.52 | LMC+SMC | (0) | 311/ | 973 | |||
| 0.69 | MW | (0) | () | 00.01 | / | ||
| 0.69 | MW | 0.9640.002 | () | 3.1 | / | ||
| 0.69 | FM | 1.250.03 | 0.08 | 3.1 | / | ||
| 0.69 | LMC | 1.170.02 | 0.06 | / | |||
| 0.69 | SMC | 0.8070.002 | () | / | |||
| 0.69 | MW+SMC | () | 3.1 | (0.25) | 784/ | 973 | |
| 0.69 | LMC+SMC | (0) | 307/ | 973 | |||
| 0.37 | MW | (0) | 0.04 | / | |||
| 0.37 | MW | 0.730.02 | 0.06 | 3.1 | / | ||
| 0.37 | FM | 0.8070.002 | () | 3.1 | / | ||
| 0.37 | LMC | 0.9370.002 | () | / | |||
| 0.37 | SMC | 0.580.01 | 0.04 | / | |||
| 0.37 | MW+SMC | 3.1 | (0.25) | 1184/ | 973 | ||
| 0.37 | LMC+SMC | () | 512/ | 973 |
3.4. Summary of the extinction curve properties
Fig. 9 shows the scaled extinction curve for GRB 070802 for . We clearly detect the 2175 Å bump in the extinction curve of GRB 070802. The data sample the bump very well and its detection does not depend on whether we assume cooling breaks or not in the spectrum of the GRB. It is one of the most robust detections of the bump in extragalactic environments to date and currently the highest redshift detection at z=2.45 (corresponding to 2.5 Gyr assuming a flat universe with , and km s-1 Mpc-1).
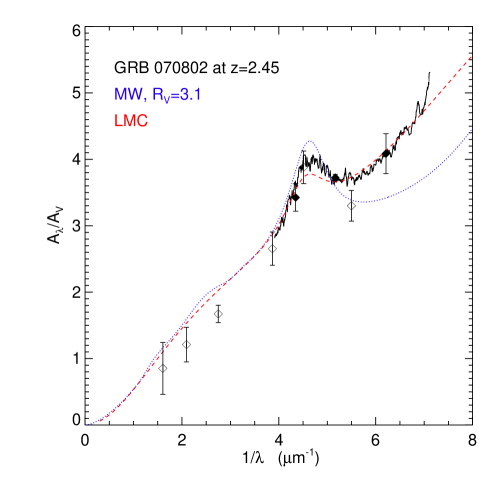
For the three local extinction laws, the LMC provides the best fit (i.e., it has the lowest per degree of freedom (d.o.f.)) to the shape of the derived extinction curve, regardless of whether we assume there is a cooling break or not between the X-rays and the optical, and whether we take into account a possible contribution from the foreground absorbers or not (see Tables 4 and 6). The SMC clearly provides a poor fit in all cases as the bump is completely missing, while the bump of the MW extinction law is too strong and the rise into the UV not steep enough. A foreground absorber with SMC type extinction could make the bump shallower and the UV rise steeper (see Fig. 7), however, the absorption would need to be larger than the upper limits placed on in § 2.1.4.
The best fits are obtained using the FM parametrization. This is not surprising, as it has more freedom in tracing the shape of the curve (see Appendix A). The three parameters giving the shape of the bump are only weakly dependent on the assumed and whether we assume a cooling break or not (Table 5). The bump is found to be centered at m-1, the width of the bump is found to be m-1 while the ’strength’ (i.e. its height above the linear extinction, see Appendix A) is . Therefore, both the area of the bump and its maximum height above the linear extinction are well defined. The relative strength of the bump (as defined by Gordon et al. 2003) is also well defined, although here the uncertainty is dominated by the uncertainty in (or equivalently ). We note that the value of is the same as the average that Gordon et al. (2003) find for the LMC average sample while the width is a bit wider compared to their m-1 (although it is still within their scatter). The value of is however higher than Gordon et al. (2003) find for the LMC2 sample () although it is within the scatter.
We estimate the amount of dust extinction to be for and for given the FM parametrization. The LMC fits correspondingly give for and for . Taking into account the possible deviation of the slope (excluding steeper slopes than , as this would be in strong disagreement with the photometric points of Krühler et al. 2008), we estimate – in the host along the line of sight to GRB 070802.
4. Discussion
The nature of the interstellar extinction peak at 2175 Å remains poorly understood more than 40 years after its discovery by Stecher (1965). As its detection has been limited to the Milky Way with only a few exceptions it has proven hard to search for correlations between the dust environment and the detection or non-detection of the bump. The detection of the bump in the spectrum of GRB 070802 is interesting in itself for two reasons, i.e., as being the highest redshift detection of the bump and as being the first robust detection of the bump in a GRB host galaxy. It shows that the carrier of the 2175 Å bump, which is characteristic for Milky Way type dust, was in place 2.6 Gyr after the Big Bang (when the Universe was only 20 % of its current age). It also shows that the conditions for both forming and not destroying the 2175 Å were satisfied in a GRB host galaxy – surprising in view of the fact that most GRB host galaxies are faint, blue, young, low-metallicity galaxies (Le Floc’h et al. 2003; Christensen et al. 2004; Fruchter et al. 2006) in contrast to the massive, evolved and chemically enriched Milky Way.
Moreover, the detection of 2175 Å as well as a very rich spectrum of redshifted UV metal absorption lines allows us to explore various hypotheses for the origin of the bump – an experiment that cannot easily be done along lines of sight in the Milky Way. Below we explore whether there are any other properties of the galaxy which are correlated with the presence of the bump. We discuss what separates GRB 070802 from other GRBs with reddening but no detected bump and compare the properties of the host galaxy with other galaxies for which the extinction curve has been determined.
4.1. Metallicity
As mentioned in § 1.2, based on evidence from the MW, LMC and SMC, the simplest hypothesis would be that the strength of the 2175 Å bump is simply controlled by the metallicity. However, Savaglio et al. (2003) infer a metallicity of [Zn/H] for GRB 000926 (compared to [Zn/H] we derive for GRB 070802) and the H I column density for GRB 000926 is similar to that of GRB 070802. This would indicate that the extinction curve of GRB 000926 should also have a bump if metallicity was its only driver. However, the extinction curve derived for GRB 000926 is inconsistent with those of the MW and LMC and fully consistent with that of the SMC, i.e., without a 2175 Å bump (Fynbo et al. 2001a).
4.2. Gas to dust ratio
Gordon et al. (2003) suggested that the average extinction properties of the SMC, LMC and MW were described by the same underlying extinction law, which could be described by the parameter of the MW extinction and one additional parameter characterizing the strength of the bump and the UV slope. They suggested the gas to dust ratio as the second parameter and showed that for the LMC and SMC there is a correlation between the gas to dust ratio and the UV slope (i.e. ) and an anti-correlation between the gas to dust ratio and the strength of the bump (i.e. ), albeit with a large scatter.
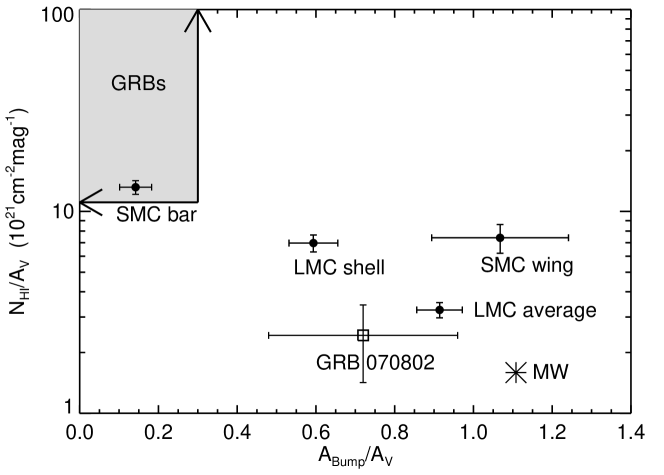
GRBs typically originate in host galaxies with low dust to gas ratios (i.e. high gas to dust ratios Hjorth et al. 2003; Jakobsson et al. 2004c; Vreeswijk et al. 2004; Kann et al. 2006; Prochaska et al. 2007; Schady et al. 2007). While the column density, , of the host of GRB 070802 is not exceptionally large, it does have a very large , leading to a low gas to dust. This is shown in Fig. 10, where we have plotted vs. the strength of the bump for the SMC, LMC, MW and GRB 070802. Also plotted is the region where GRBs for which an extinction curve analysis exists in the literature lie. The plot shows that the anti-correlation between the bump strength and the gas to dust ratio found by Gordon et al. (2003) for the SMC and the LMC also holds for the GRBs, and GRB 070802 in particular, although with large uncertainties in the values.
| Name | (H I) | References | ||
|---|---|---|---|---|
| GRB 000301C | 2.040 | 1 | ||
| GRB 000926 | 2.038 | 2,3 | ||
| GRB 020124 | 3.198 | 4 | ||
| GRB 030323 | 3.372 | 5 | ||
| GRB 030429 | 2.658 | 6 | ||
| GRB 050401 | 2.899 | 7 | ||
| GRB 070802 | 2.455 | 8 |
4.3. Detection of C I and the UV radiation field
GRB 070802 is to our knowledge the first GRB to date to show prominent C I in its afterglow spectrum and also the first GRB to show the 2175 Å feature, which is suggestive of a link between these two components. Should such a link be established by further observations it constitutes a constraint on the environment in which the 2175 Å feature occurs. The ionization potential of neutral carbon is lower than that of hydrogen (11.3 vs. 13.6 eV) and neutral carbon is therefore only expected in regions without intense UV radiation. This would be consistent with the general lack of the 2175 Å feature in GRB host galaxies, as GRBs arise predominantly from star-forming regions where the UV radiation is expected to be strong (Fruchter et al. 2006; Chen et al. 2009).
To test whether this suggested correlation holds in general, we have looked at the other three robust detections of the 2175 Å bump in individual systems beyond the local group. For the lensing galaxy reported by Motta et al. (2002) and the intervening absorber towards GRB 060418 reported by Ellison et al. (2006), the existing data do not cover the wavelength range where one would see the C I absorption line if present. However, for the intervening damped Lyman- system toward AO 0235+164 reported by Junkkarinen et al. (2004) we see tentative evidence for the C I 1656 absorption line. The regions around C I 1560,1656 are shown in Fig. 11 for GRB 070802 and AO 0235+164. For comparison we also show the same region in the afterglow spectrum of the high metallicity burst GRB 000926 which shows no significant evidence for the C I absorption features (and no bump in its extinction curve).
It would be of interest to further check whether the sightlines to the MW, LMC and SMC for which extinction curve analysis exist are consistent with this correlation. Such a study is beyond the scope of this current work, but we note that a quick and incomplete search of the literature resulted in two more lines of sight consistent with this correlation. The first is a detection of C I in the line of sight towards HD 185418 in the MW by Sonnentrucker et al. (2003). This line of sight is included in the sample of Fitzpatrick & Massa (1986) and has the 2175 Å bump in its extinction curve. The second is a line of sight towards the SMC, which has C I detected in the MW but only as an upper limit in the SMC (Welty et al. 1997). Although this sightline does not have an extinction curve analysis, it is consistent with our prediction that most lines of sight in the SMC should not show significant C I absorption.
The presence of the C I absorption feature in GRB 070802 suggests that the UV radiation field is weaker than in typical GRB environments (see § 4.3). Gordon et al. (2003) reached the tentative conclusion that the shape of the extinction curve is affected by the UV flux density in the environment of the dust. In particular, a weaker UV flux density is found to correlate with the presence of the bump. Continuing our comparison to the bump-less GRB 000926 host, we find evidence that GRB 070802 does indeed have a weaker UV radiation field: i) the GRB 000926 absorption system has stronger high ionization lines and much weaker lines from neutral species (e.g., C I, see Fig. 11) than the GRB 070802 system. ii) the host galaxy of GRB 000926 appears to have a stronger UV flux density as illustrated by the very strong Lyman- emission line (Fynbo et al. 2002b). For GRB 070802 we can exclude the presence of such a strong Lyman- emission line (Fig. 1 and Milvang-Jensen et al., in preparation). This supports the conclusion reached by Gordon et al. (2003).
It is not immediately clear what the physical significance of the possible correlation of strong C I and the 2175 Å bump is. Given that the bump is generally believed to be carried by carbonaceous material, and that carbonaceous grain growth and formation requires free, neutral carbon and molecules (Henning & Salama 1998), it would not be surprising to find both observed properties in the same environments. The simultaneous presence of C I and the 2175 Å bump as well as the lower overall ionization state of the gas, relatively (though not exceptionally) high metallicity, and large dust-to-gas ratio may be explained in a scenario in which the dust column is strongly enriched by the presence of asymptotic giant branch (AGB) stars.
For massive stars to move onto the AGB requires at least 600 Myr and typically much longer for a large population (Maeder 1992). The star-forming environment at such an age will be intrinsically relatively benign, with a softer UV field, and one in which a large amount of dust and molecular and free carbon is produced (Andersen et al. 2003; Gautschy-Loidl et al. 2004). Furthermore the interstellar medium (ISM) is likely to be reasonably metal-rich and dust-rich. These properties are in contrast to the normal environments of GRB hosts which are typically metal-poor. However some GRB hosts may be fairly metal-enriched (Fynbo et al. 2006) but still have hard radiation fields and young stellar populations (Le Floc’h et al. 2003; Christensen et al. 2004; Prochaska et al. 2004) and in particular, low dust-to-gas ratios (Fynbo et al. 2006; Jakobsson et al. 2006; Watson et al. 2007). This is consistent with the above scenario since the metal-enrichment timescale could well be much shorter than the yr required to have a reasonable number of AGB stars producing dust (Schneider et al. 2004). Such a scenario is then also consistent with the fact that GRB 070802 is the only GRB host galaxy so far discovered with a 2175 Å bump. It should also be noted that the host galaxy of GRB 070802 is fairly luminous and red for a GRB host (Savaglio et al. 2009), suggesting that it is a massive, evolved system, which would be in agreement with the claim of Noll et al. (2007) that the presence of the bump requires an evolved population.

5. Conclusions
We have presented VLT observations of the afterglow of GRB 070802. In a low resolution spectroscopy of the optical afterglow we detect a large number of strong metal lines from absorption systems at , and . The highest redshift system is remarkable in showing very strong metal lines, e.g. with higher for the Si II lines at 1526 and 1808 Å than for any other known absorption system we are aware of. We also detect strong absorption from C I implying that the gas is shielded from strong UV radiation. The spectrum shows a red wing of a Ly line from which we derive a H I column density of H I0.20. Imaging of the field revealed a fairly bright and red host, detected both in and bands, suggesting that it is an evolved, massive galaxy.
The spectrum is also remarkable in that the extinction curve of the line of sight towards GRB 070802 shows a clear signature of the so called Milky Way or Å bump. At a redshift of , it is by far the highest redshift detection of the Å bump to date. It shows that the conditions for the creation and non-destruction of the carrier of the bump must already have been in place early in the universe. This is the first clear detection of the bump in the host of a GRB, with the SMC being the typical type of extinction for GRB sightlines. This makes GRB 070802 an ideal candidate to study the environment needed for the creation and/or non-annihilation of bump, by comparing it to other bump-less GRBs.
To accurately derive the properties of the extinction curve in the UV and the bump we fit it to the parametrization of Fitzpatrick & Massa (2007). The bump is found to be centered at m-1 (or Å), the width of the bump is found to be m-1 while the ’strength’ is (taking into account the uncertainty in the intrinsic spectral slope ). The value of is the same as the average that Gordon et al. (2003) find for the LMC average sample () but higher than for the LMC2 sample () although it is within the scatter. The width is a bit wider compared to their m-1 forethe LMC average and for LMC2 (although it is still within the scatter of both samples). The amount of extinction is , but when taking into account deviations in , – for the FM and LMC fits.
In the Local Group, the MW bump is a characteristic feature of the MW extinction curve. It is also observed in the LMC, although it is usually weaker and followed by a steeper rise in the UV, while it is not observed in four out of five curves measured for the SMC (see 1.1 for more details and exceptions). Of these three ’local type extinction laws’ we find that the extinction of GRB 070802 most closely resembles that of the LMC. We find that this result is robust, even taking into account a possible contribution to the extinction from the strong foreground Mg II absorber. It has been suggested, based on the difference in the SMC, LMC and MW, that the strength of the bump correlates with metallicity. However, Gordon et al. (1997) found that although starburst galaxies can have varying metallicities, their extinction curves all lack the 2175 Å bump. By comparing GRB 070802 to another high metallicity GRB sightline which does not show any sign of a bump in its extinction curve, we similarly conclude that metallicity is not the only driver of the 2175 Å bump.
Another special feature in the spectrum of GRB 070802 is the detection of a strong C I absorption. This is to our knowledge the first GRB spectrum to contain C I absorption and we propose that there may be a correlation between its detection and the presence of the bump. We have checked this suggested correlation for a few other lines of sight, and found all of them to be in agreement. This prediction has also been checked by Prochaska et al. (2009) who find a C I absorption line and a 2175 Å bump (based on photometric data) in GRB 080607. We also find a high dust-to-gas ratio, which is consistent with a proposed correlation by Gordon et al. (2003), suggesting that the strength of the bump is related to the dust-to-gas ratio. Extending their correlation plot to include the MW, GRB 070802 and other GRBs from the literature with extinction analysis, we find that they all follow the proposed correlation. Finally, the presence of the C I absorption feature in GRB 070802 suggests that the UV radiation field is weaker than in typical GRB environments. This is in agreement with the tentative conclusion of Gordon et al. (2003) that a weaker UV flux density is found to correlate with the presence of the bump.
The simultaneous presence of C I and the 2175 Å bump as well as the lower overall ionization state of the gas, relatively (though not exceptionally) high metallicity, and large dust-to-gas ratio may be explained in a scenario in which the dust column is strongly enriched by the presence of asymptotic giant branch (AGB) stars. This would be consistent with the conclusion that the host of GRB 070802 is a massive evolved galaxy, and supports the conclusions of Noll et al. (2007) that the presence of the bump requires an evolved population.
References
- Andersen et al. (2003) Andersen, A. C., Höfner, S., & Gautschy-Loidl, R. 2003, A&A, 400, 981
- Barthelmy et al. (2007) Barthelmy, S. D., et al. 2007, GRB Coordinates Network, 6692, 1
- Berger & Murphy (2007) Berger, E. & Murphy, D. 2007, GRB Coordinates Network, 6695, 1
- Bianchi et al. (1996) Bianchi, L., Clayton, G. C., Bohlin, R. C., Hutchings, J. B., & Massey, P. 1996, ApJ, 471, 203
- Bloom et al. (1998) Bloom, J. S., et al. 1998, ApJ, 508, L21
- Cardelli et al. (1989) Cardelli, J. A., Clayton, G. C., & Mathis, J. S. 1989, ApJ, 345, 245
- Castro-Tirado et al. (1999) Castro-Tirado, A. J., et al. 1999, ApJ, 511, L85
- Cecchi-Pestellini et al. (2008) Cecchi-Pestellini, C., Malloci, G., Mulas, G., Joblin, C., & Williams, D. A. 2008, ArXiv e-prints, 804
- Chen et al. (2009) Chen, H.-W., et al. 2009, ApJ, 691, 152
- Chen et al. (2005) Chen, H.-W., Prochaska, J. X., Bloom, J. S., & Thompson, I. B. 2005, ApJ, 634, L25
- Christensen et al. (2004) Christensen, L., Hjorth, J., & Gorosabel, J. 2004, A&A, 425, 913
- Clayton et al. (2003) Clayton, G. C., et al. 2003, ApJ, 592, 947
- Clayton et al. (2000) Clayton, G. C., Gordon, K. D., & Wolff, M. J. 2000, ApJS, 129, 147
- Dessauges-Zavadsky et al. (2006) Dessauges-Zavadsky, M., Chen, H.-W., Prochaska, J. X., Bloom, J. S., & Barth, A. J. 2006, ApJ, 648, L89
- Dickey & Lockman (1990) Dickey, J. M. & Lockman, F. J. 1990, ARA&A, 28, 215
- Diplas & Savage (1994) Diplas, A. & Savage, B. D. 1994, ApJ, 427, 274
- Djorgovski et al. (2001) Djorgovski, S. G., Frail, D. A., Kulkarni, S. R., Bloom, J. S., Odewahn, S. C., & Diercks, A. 2001, ApJ, 562, 654
- Draine (1989) Draine, B. 1989, in IAU Symposium, Vol. 135, Interstellar Dust, ed. L. J. Allamandola & A. G. G. M. Tielens, 313–+
- Draine (2003) Draine, B. T. 2003, ARA&A, 41, 241
- Draine & Li (2007) Draine, B. T. & Li, A. 2007, ApJ, 657, 810
- Draine & Malhotra (1993) Draine, B. T. & Malhotra, S. 1993, ApJ, 414, 632
- Duley (2006) Duley, W. W. 2006, ApJ, 639, L59
- Duley & Seahra (1998) Duley, W. W. & Seahra, S. 1998, ApJ, 507, 874
- Elíasdóttir et al. (2006) Elíasdóttir, Á., Hjorth, J., Toft, S., Burud, I., & Paraficz, D. 2006, ApJS, 166, 443
- Ellison et al. (2006) Ellison, S. L., et al. 2006, MNRAS, 372, L38
- Fitzpatrick (2004) Fitzpatrick, E. L. 2004, in Astronomical Society of the Pacific Conference Series, Vol. 309, Astrophysics of Dust, ed. A. N. Witt, G. C. Clayton, & B. T. Draine, 33–+
- Fitzpatrick & Massa (1986) Fitzpatrick, E. L. & Massa, D. 1986, ApJ, 307, 286
- Fitzpatrick & Massa (1990) —. 1990, ApJS, 72, 163
- Fitzpatrick & Massa (2007) —. 2007, ApJ, 663, 320
- Fruchter et al. (2006) Fruchter, A. S., et al. 2006, Nature, 441, 463
- Fynbo et al. (2007) Fynbo, J., et al. 2007, The Messenger, 130, 43
- Fynbo et al. (2002a) Fynbo, J. P. U., et al. 2002a, in Lighthouses of the Universe: The Most Luminous Celestial Objects and Their Use for Cosmology, ed. M. Gilfanov, R. Sunyeav, & E. Churazov, 187–+
- Fynbo et al. (2002b) Fynbo, J. P. U., et al. 2002b, A&A, 388, 425
- Fynbo et al. (2006) Fynbo, J. P. U., et al. 2006, A&A, 451, L47
- Fynbo et al. (2001a) Fynbo, J. U., et al. 2001a, A&A, 373, 796
- Fynbo et al. (2001b) Fynbo, J. U., et al. 2001b, A&A, 369, 373
- Galama et al. (2003) Galama, T. J., et al. 2003, ApJ, 587, 135
- Galama et al. (1998) Galama, T. J., Wijers, R. A. M. J., Bremer, M., Groot, P. J., Strom, R. G., Kouveliotou, C., & van Paradijs, J. 1998, ApJ, 500, L97+
- Gautschy-Loidl et al. (2004) Gautschy-Loidl, R., Höfner, S., Jørgensen, U. G., & Hron, J. 2004, A&A, 422, 289
- Gehrels et al. (2004) Gehrels, N., et al. 2004, ApJ, 611, 1005
- Gordon et al. (1997) Gordon, K. D., Calzetti, D., & Witt, A. N. 1997, ApJ, 487, 625
- Gordon et al. (2003) Gordon, K. D., Clayton, G. C., Misselt, K. A., Landolt, A. U., & Wolff, M. J. 2003, ApJ, 594, 279
- Granot & Sari (2002) Granot, J. & Sari, R. 2002, ApJ, 568, 820
- Heng et al. (2008) Heng, K., Lazzati, D., Perna, R., Garnavich, P., Noriega-Crespo, A., Bersier, D., Matheson, T., & Pahre, M. 2008, ArXiv e-prints, 803
- Henning et al. (2004) Henning, T., Jäger, C., & Mutschke, H. 2004, in Astronomical Society of the Pacific Conference Series, Vol. 309, Astrophysics of Dust, ed. A. N. Witt, G. C. Clayton, & B. T. Draine, 603–+
- Henning & Salama (1998) Henning, T. & Salama, F. 1998, Science, 282, 2204
- Henrard et al. (1997) Henrard, L., Lambin, P., & Lucas, A. A. 1997, ApJ, 487, 719
- Hjorth et al. (2003) Hjorth, J., et al. 2003, ApJ, 597, 699
- Jakobsson et al. (2006) Jakobsson, P., et al. 2006, A&A, 460, L13
- Jakobsson et al. (2004a) Jakobsson, P., Hjorth, J., Fynbo, J. P. U., Watson, D., Pedersen, K., Björnsson, G., & Gorosabel, J. 2004a, ApJ, 617, L21
- Jakobsson et al. (2004b) Jakobsson, P., et al. 2004b, A&A, 427, 785
- Jakobsson et al. (2004c) —. 2004c, A&A, 427, 785
- Jaunsen et al. (2008) Jaunsen, A. O., et al. 2008, ApJ, 681, 453
- Jensen et al. (2001) Jensen, B. L., et al. 2001, A&A, 370, 909
- Joblin et al. (1992) Joblin, C., Leger, A., & Martin, P. 1992, ApJ, 393, L79
- Junkkarinen et al. (2004) Junkkarinen, V. T., Cohen, R. D., Beaver, E. A., Burbidge, E. M., Lyons, R. W., & Madejski, G. 2004, ApJ, 614, 658
- Kann et al. (2006) Kann, D. A., Klose, S., & Zeh, A. 2006, ApJ, 641, 993
- Krühler et al. (2008) Krühler, T., et al. 2008, ApJ, 685, 376
- Le Floc’h et al. (2003) Le Floc’h, E., et al. 2003, A&A, 400, 499
- Ledoux et al. (2006) Ledoux, C., Petitjean, P., Fynbo, J. P. U., Møller, P., & Srianand, R. 2006, A&A, 457, 71
- Ledoux et al. (2003) Ledoux, C., Petitjean, P., & Srianand, R. 2003, MNRAS, 346, 209
- Lequeux et al. (1982) Lequeux, J., Maurice, E., Prevot-Burnichon, M.-L., Prevot, L., & Rocca-Volmerange, B. 1982, A&A, 113, L15
- Liang et al. (2007) Liang, E.-W., Zhang, B.-B., & Zhang, B. 2007, ApJ, 670, 565
- Maeder (1992) Maeder, A. 1992, A&A, 264, 105
- Mathis (1994) Mathis, J. S. 1994, ApJ, 422, 176
- Mathis (1996) —. 1996, ApJ, 472, 643
- Mattsson et al. (2008) Mattsson, L., Wahlin, R., Höfner, S., & Eriksson, K. 2008, A&A, 484, L5
- Ménard et al. (2008) Ménard, B., Nestor, D., Turnshek, D., Quider, A., Richards, G., Chelouche, D., & Rao, S. 2008, MNRAS, 385, 1053
- Misselt et al. (1999) Misselt, K. A., Clayton, G. C., & Gordon, K. D. 1999, ApJ, 515, 128
- Motta et al. (2002) Motta, V., et al. 2002, ApJ, 574, 719
- Nandy et al. (1981) Nandy, K., Morgan, D. H., Willis, A. J., Wilson, R., & Gondhalekar, P. M. 1981, MNRAS, 196, 955
- Nardini et al. (2008) Nardini, M., Ghisellini, G., & Ghirlanda, G. 2008, MNRAS, 386, L87
- Noll et al. (2007) Noll, S., Pierini, D., Pannella, M., & Savaglio, S. 2007, A&A, 472, 455
- Noterdaeme et al. (2008) Noterdaeme, P., Ledoux, C., Petitjean, P., & Srianand, R. 2008, A&A, 481, 327
- Pei (1992) Pei, Y. C. 1992, ApJ, 395, 130
- Pei et al. (1999) Pei, Y. C., Fall, S. M., & Hauser, M. G. 1999, ApJ, 522, 604
- Perley et al. (2008) Perley, D. A., et al. 2008, ApJ, 672, 449
- Petitjean et al. (2002) Petitjean, P., Srianand, R., & Ledoux, C. 2002, MNRAS, 332, 383
- Prevot et al. (1984) Prevot, M. L., Lequeux, J., Prevot, L., Maurice, E., & Rocca-Volmerange, B. 1984, A&A, 132, 389
- Price et al. (2001) Price, P. A., et al. 2001, ApJ, 549, L7
- Prochaska et al. (2004) Prochaska, J. X., et al. 2004, ApJ, 611, 200
- Prochaska et al. (2006) Prochaska, J. X., Chen, H.-W., & Bloom, J. S. 2006, ApJ, 648, 95
- Prochaska et al. (2007) Prochaska, J. X., Chen, H.-W., Dessauges-Zavadsky, M., & Bloom, J. S. 2007, ApJ, 666, 267
- Prochaska et al. (2008) Prochaska, J. X., Chen, H.-W., Wolfe, A. M., Dessauges-Zavadsky, M., & Bloom, J. S. 2008, ApJ, 672, 59
- Prochaska et al. (2009) Prochaska, J. X., et al. 2009, ApJ, 691, L27
- Prochter et al. (2006) Prochter, G. E., et al. 2006, ApJ, 648, L93
- Ramaprakash et al. (1998) Ramaprakash, A. N., et al. 1998, Nature, 393, 43
- Rao et al. (2006) Rao, S. M., Turnshek, D. A., & Nestor, D. B. 2006, ApJ, 636, 610
- Reichart (1998) Reichart, D. E. 1998, ApJ, 495, L99+
- Reichart (2001) —. 2001, ApJ, 553, 235
- Rol et al. (2005) Rol, E., Wijers, R. A. M. J., Kouveliotou, C., Kaper, L., & Kaneko, Y. 2005, ApJ, 624, 868
- Rouleau et al. (1997) Rouleau, F., Henning, T., & Stognienko, R. 1997, A&A, 322, 633
- Sari et al. (1998) Sari, R., Piran, T., & Narayan, R. 1998, ApJ, 497, L17+
- Savaglio & Fall (2004) Savaglio, S. & Fall, S. M. 2004, ApJ, 614, 293
- Savaglio et al. (2003) Savaglio, S., Fall, S. M., & Fiore, F. 2003, ApJ, 585, 638
- Savaglio et al. (2009) Savaglio, S., Glazebrook, K., & LeBorgne, D. 2009, ApJ, 691, 182
- Schady et al. (2007) Schady, P., et al. 2007, MNRAS, 377, 273
- Schlegel et al. (1998) Schlegel, D. J., Finkbeiner, D. P., & Davis, M. 1998, ApJ, 500, 525
- Schneider et al. (2004) Schneider, R., Ferrara, A., & Salvaterra, R. 2004, MNRAS, 351, 1379
- Sonnentrucker et al. (2003) Sonnentrucker, P., Friedman, S. D., Welty, D. E., York, D. G., & Snow, T. P. 2003, ApJ, 596, 350
- Sorrell (1990) Sorrell, W. H. 1990, MNRAS, 243, 570
- Srianand et al. (2005) Srianand, R., Petitjean, P., Ledoux, C., Ferland, G., & Shaw, G. 2005, MNRAS, 362, 549
- Stecher (1965) Stecher, T. P. 1965, ApJ, 142, 1683
- Stecher & Donn (1965) Stecher, T. P. & Donn, B. 1965, ApJ, 142, 1681
- Steel & Duley (1987) Steel, T. M. & Duley, W. W. 1987, ApJ, 315, 337
- Stratta et al. (2007) Stratta, G., Maiolino, R., Fiore, F., & D’Elia, V. 2007, ApJ, 661, L9
- Tanvir et al. (2008) Tanvir, N. R., et al. 2008, MNRAS, 388, 1743
- Valencic et al. (2003) Valencic, L. A., Clayton, G. C., Gordon, K. D., & Smith, T. L. 2003, ApJ, 598, 369
- Vladilo & Péroux (2005) Vladilo, G. & Péroux, C. 2005, A&A, 444, 461
- Vladilo et al. (2008) Vladilo, G., Prochaska, J. X., & Wolfe, A. M. 2008, A&A, 478, 701
- Voshchinnikov (1990) Voshchinnikov, N. V. 1990, Soviet Astronomy Letters, 16, 215
- Vreeswijk et al. (2004) Vreeswijk, P. M., et al. 2004, A&A, 419, 927
- Vreeswijk et al. (1999) Vreeswijk, P. M., et al. 1999, ApJ, 523, 171
- Vreeswijk et al. (2007) Vreeswijk, P. M., et al. 2007, A&A, 468, 83
- Vreeswijk et al. (2006) Vreeswijk, P. M., et al. 2006, A&A, 447, 145
- Watson et al. (2006) Watson, D., et al. 2006, ApJ, 652, 1011
- Watson et al. (2007) Watson, D., Hjorth, J., Fynbo, J. P. U., Jakobsson, P., Foley, S., Sollerman, J., & Wijers, R. A. M. J. 2007, ApJ, 660, L101
- Welty et al. (1997) Welty, D. E., Lauroesch, J. T., Blades, J. C., Hobbs, L. M., & York, D. G. 1997, ApJ, 489, 672
- Will & Aannestad (1999) Will, L. M. & Aannestad, P. A. 1999, ApJ, 526, 242
Appendix A Parametric extinction laws
In this Appendix we describe the parametrizations we have used to model the extinction curves.
A.1. The Pei parametrization for the SMC and the LMC
This parametrization was introduced by Pei (1992) and is given by:
| (A1) |
where the six terms are all positive and represent different parts of the extinction curve. The parameters can be found in Pei (1992). The five terms with are equivalent to Drude profiles with a peak at . The only free variable in the fit is the overall amount of extinction. The original Pei (1992) paper scales it to but we choose to scale it to to be consistent with the other parametrizations. Note that the Pei (1992) law can also be used to describe Milky Way type of extinction.
Gordon et al. (2003) present new and updated average extinction curves for the SMC and LMC extinction curves. Their analysis is based on using the Fitzpatrick & Massa (1990) parametrization which differs from the updated FM parametrization we use (see below) in keeping fixed. The Gordon et al. (2003) analysis presents a more nuanced picture of the extinction in the SMC and LMC with lines of sight showing different type of extinction (see 1.1). However, we find that their ”LMC2” average extinction curve and their ”SMC Bar” extinction curves are very similar to the LMC and SMC extinction curves of Pei (1992, see Fig. 12), thus justifying our use of the commonly used Pei (1992) parametrization.
A.2. The CCM parametrization for Milky Way type of extinction
This parametrization of the Milky Way extinction law was proposed by Cardelli et al. (1989). It depends on only two parameters, and which is the ratio of total to selective extinction. It is given by
where is the total extinction at wavelength , and are polynomials and . The advantage of this parametrization over the one of Pei (1992) for the Milky Way is that it allows for a varying .
A.3. The FM parametrization
The parametrisation for the UV (i.e. valid for m-1) is given by
| (A3) | |||||
| (A4) |
where
| (A7) |
and
| (A8) |
The parameters and define the linear component underlying the entire UV range, , and give the Å bump (although its central wavelength is not fixed in the parametrization) and and give a far-UV curvature component. The extinction properties in the infrared and optical are not parametrized in the FM2007 description but are derived using spline interpolation (see Fitzpatrick & Massa 2007, for details). As our dataset does not reach into these regions in the restframe, we do not constrain the extinction curve in this region. Therefore, for display purposes, we have chosen to set these parameters to ’typical’ values found by Fitzpatrick & Massa (2007), to create ’normal’ smooth continuation of the curve towards . We note that the choice of these parameters does in no way affect our fits for the UV parameters and, vice versa, that the FM fits do not constrain this part of the curve.
As explained in Fitzpatrick & Massa (2007), additional useful quantities can be defined using the UV parameters. The first one (1) gives the value of the far-UV curvature term at Å and measures the strength of the far-UV curvature; (2) is the area of the bump and (3) is the maximum height of the bump above the linear extinction.