Gamma-Ray Burst afterglows : luminosity clustering at infrared wavelengths ?
Abstract
Context. Clustering in the luminosity of the afterglows of gamma-ray burst has been reported in the optical and X-ray.
Aims. We investigate the possibility that a clustering in the luminosity of the afterglows of gamma-ray burst exists in the near infrared (J, H, K bands). We use observations of events from 1997 to the end of 2007.
Methods. We correct the gamma-ray burst afterglow light curve for distance effects and time dilation, and rescale all light curves to a common distance of . We used only observations of signals emitted in the near infrared (in the burst frame).
Results. We observe a clustering identical to the one observed in the optical and similar to the one observed in X-rays. We thus confirm previous work made in optical wavelengths and set a constraint on the total energy of the fireball.
Key Words.:
gamma-ray:bursts – cosmology – infrared:standard1 Introduction
Long Gamma-Ray Bursts (GRBs) are located at cosmological distances (Metzger et al. 1997). These events are associated with supernovae (e.g. Hjorth et al. 2003; Stanek et al. 2003) and derive from the endpoint of the stellar evolution of massive stars. It is thus tempting to hypothesize a standard candle behavior as for type Ia-supernovae. Indeed, several empirical correlations between observable quantities have been discovered (Amati et al. 2002; Ghirlanda et al. 2004), triggering the search for a standard candle based on GRBs (see e.g. Ghirlanda et al. 2006). This could have a very high impact on studies of the cosmology in the redshift range 1-15 (for a review, see Meszaros 2006). However, the use of GRBs for such studies requires the establishment of a robust indicator of their distance based on their intrinsic properties. This, in turn, implies that we must fully understand the properties of GRBs and their luminosity function.
During the BeppoSAX era, we discovered a clustering of the X-ray luminosities of GRB afterglows (Boër & Gendre 2000). This clustering was confirmed later (Gendre & Boër 2005), and was also observed in the optical (Nardini et al. 2006; Kann et al. 2006; Liang & Zhang 2006). To date, GRBs cluster in three different groups according to their optical and X-ray luminosities; however, 10 % of nearby outliers are apparently underluminous and do not cluster (Gendre et al. 2008). Because of selection effects, this population of underluminous afterglows could be the tip of the iceberg of a more numerous undetected population.
The physical reason for the clustering in luminosity is still unknown. It has been proposed that the microphysical parameters of the fireball (which fix the afterglow properties) can take on only a few possible values (Gendre et al. 2008). To confirm this hypothesis, we must investigate the luminosity clustering at longer wavelengths (compared to optical bands), so that the fireball parameters can be constrained. In this Letter, we present our findings obtained using infrared observations. They are interesting because :
-
•
infrared observations are numerous and can be used as a statistically significant sample to estimate the positions of characteristic breaks within the afterglow broad-band spectrum, such as the injection frequency ;
- •
2 Data reduction and analysis
2.1 Sample selection and definition
| GRB | Redshift | Observation band | Reference |
|---|---|---|---|
| GRB 970228 | 0.70 | H,K | 111Galama et al. (1997), Fruchter et al. (1999), Galama et al. (2000) |
| GRB 980703 | 0.97 | H,K | 222Vreeswijk et al. (1999), Castro-Tirado et al. (2001), Bloom et al. (1998) |
| GRB 990123 | 1.60 | K’ | 333Kulkarni et al. (1999), Holland et al. (2004) |
| GRB 991208 | 0.71 | K | 444Sagar et al. (2000), Castro-Tirado et al. (2001) |
| GRB 991216 | 1.02 | H,K | 555Halpern et al. (2000), Berger et al. (2001), Sagar et al. (2000) |
| GRB 000418 | 1.12 | K,Ks,K’ | 666Klose et al. (2000), Gorosabel et al. (2003) |
| GRB 000911 | 1.06 | H,Ks | 777Lazzati et al (2001), Masetti et al. (2005) |
| GRB 010921 | 0.45 | J,H,Ks | 888Price et al. (2002a) |
| GRB 011121 | 0.36 | J,H,K,Ks | 999Price et al. (2002b), Greiner et al. (2003) |
| GRB 020405 | 0.69 | H,K | 101010Price et al. (2003), Stratta et al. (2005) |
| GRB 021211 | 1.01 | H,K | 111111Holland et al. (2004) |
| GRB 030329 | 0.17 | J,H | 121212Bloom et al. (2004) |
| GRB 030528 | 0.78 | H,K,Ks | 131313Rau et al. (2004), Rau et al. (2005) |
| GRB 031203 | 0.11 | J,H,K | 141414Gal-Yam et al. (2004), Malesani et al. (2004) |
| GRB 050126 | 1.29 | Ks | 151515Berger et al. (2005) |
| GRB 050408 | 1.24 | K | 161616Foley et al. (2006) |
| GRB 060614 | 0.125 | J | 171717Della Valle et al. (2006), Cobb et al. (2006) |
| GRB 070125 | 1.55 | Ks | 181818Chandra et al. (2008) |
| GRB 070306 | 1.50 | K | 191919Jaunsen et al. (2008) |
| GRB 071010A | 0.98 | H,K | 202020Covino et al. (2008) |
We selected our sample from all long GRB afterglows observed from Earth in the near infrared (J, H, K bands) between 1997 and the first of January 2008. As pointed out by Klotz et al. (2008), some discrepancies may occur between publications of data in GCN circulars (Barthelmy 1998) and in refereed journals. Because the latter are more reliable, we considered only data extracted from refereed journals and discarded data from other works. The advantage of near infrared (compared to optical wavelengths) is that extinction is less important (Pei 1992). We thus reduced the sample to bursts in which the observed afterglow emission was produced (in the burst frame) in the near infrared. This is easily done by computing the emission band using the observation band and the burst redshift. However this last constraint implies a selection bias based on the redshift (see discussion). This reduced sample is listed in Table 1.
This sample of light curves was then corrected for the extinction due to the Milky Way. We used the work of Schlegel et al. (1998) for this purpose. Because the extinction due to the host is more uncertain (see e.g. Li et al. 2008) we have not corrected the host extinction.
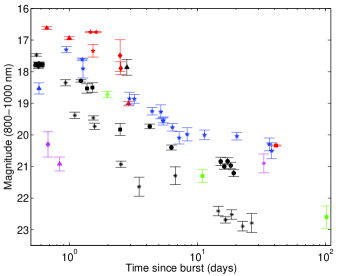
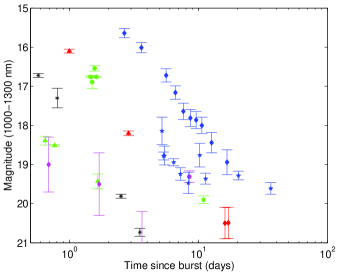
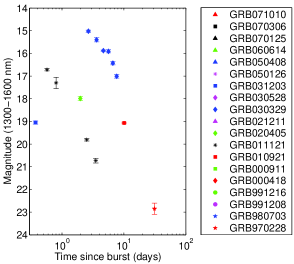
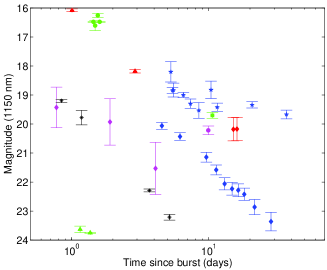
Finally, the sample was distributed into three bands, based on the rest frame emission wavelength: emission within the Å range, the Å range, and the Å range. These bands do not correspond to any photometric filter used for observations. We defined them so that they are broad enough to include several afterglows within each band. We used three bands instead of a single large one because this reduces the flux interpolation needed to obtain a final value at a single wavelength (see next section). In the case of GRB 030528, we corrected the flux for the presence of a bright host galaxy (Rau et al. 2004). Note however that the host galaxy luminosity is not strongly constrained, thus the error bars on the corrected flux are large. Lastly, we removed from all data the initial part of the afterglow (see Sec. 3). These light curves without further corrections are presented in Fig. 1.
2.2 Distance corrections
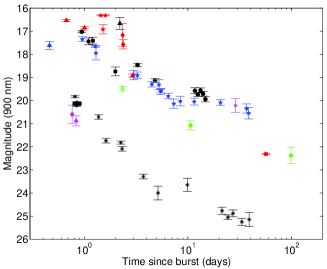
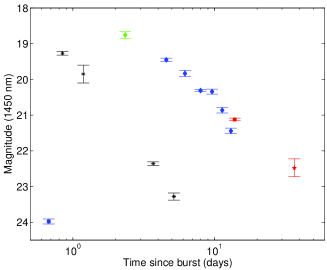
We used the method presented in Gendre & Boër (2005) to take into account distance and cosmological effects. This method rescales all light curves to a common redshift of , and thus does not require knowledge of the value of H0. We used a standard flat universe with for the distance correction. Since we already took into account the energy shift due to the cosmological effects by computing the emission band, we we do not need to rescale the observed frequency to a theoretical frequency (as was done previously in the X-rays, and as e.g. Nardini et al. 2006, did in the R band). We computed the monochromatic flux at the central frequency of each band, normalizing the fluxes by taking into account the spectral shape of the afterglow (using published spectral indexes or a value of 1.0 in the case of an unknown value). The corrected light curves are presented in Fig. 2.
3 Results and discussion
3.1 Results
As one can clearly see in Fig. 2, we observe a hint of clustering of luminosity into two groups. From the sample of 19 events, 14 belong to a group of bright events, 3 to a group of dim events, and 2 are isolated. In the following, we will use the notation of Gendre et al. (2008) : bright events in X-ray (x) or optical (o) are labeled with a I, and dim events are labeled with a II. A burst bright in the optical and dim in X-rays may thus be labeled as xII-oI. Outliers are labeled with a III. We note that the infrared groups are identical to the ones observed by Kann et al. (2006); Liang & Zhang (2006); Nardini et al. (2006) : we will thus not introduce the label ir but use the label o to discuss the infrared luminosity clustering. This reinforce the hypothesis that the clustering of infrared luminosity is not spurious. The flux difference between the two group is 3 magnitudes one day after the burst. We observe that GRB 031203, which does not cluster with the other bursts in the X-ray, seems also not to cluster in the near infrared data (see Fig. 2, right panel). GRB 060614, another nearby and peculiar burst (see e.g. Mangano et al. 2007) also does not cluster in luminosity. We discuss these results in the following sections.
3.2 Selection effects
As pointed out by Gendre et al. (2008), the clustering is only apparent in the afterglow data, and the value of Willingale et al. (2007) can be used to discriminate between early and late light curves. However, most of the afterglows of our sample were observed before the launch of Swift, and the value is unknown. To be conservative, and at the expense of the sample size, we removed the data taken before 30 000 s after the trigger. This value is larger than most of the values listed in Willingale et al. (2007). To avoid possible bias near this temporal cut-off, we will discuss in the following values obtained one day after the burst.
The use of three bands instead of a single one is motivated by the reduction of uncertainties resulting from flux interpolations when correcting our sample : an error of in the spectral index leads to less than 1.2% error in flux (compared to 5% in the case of a single large band). This has no incidence on the observed clustering, but reduces the sample size within each band.
A last and most critical selection effect can be seen in Table 1 : we selected only nearby events (compared to the mean Swift redshift). The bright events group (oI) has a mean redshift of 1.1. Most of our sample is composed of BeppoSAX events, it is thus not surprising that this low mean redshift is comparable to the BeppoSAX result. However, Swift has shown that the true redshift distribution of GRBs was different (Jakobsson et al. 2006). This redshift bias is due to our light curve selection. Removing all events emitted below the I band (but observed in infrared) implies that we remove all events above a redshift of 2.5. Thus, we cannot retain the majority of Swift bursts within our sample. However, this should not affect our results strongly. As discussed by Gendre et al. (2008), there are no strong differences in the afterglow properties of very distant and less distant bursts : this bias does not impact our results. However, a possible way to solve this bias is to add further observations within the far infrared bands.
3.3 Expectations from the model
The difference between the fluxes of group I and II is 3 magnitudes one day after the burst; the optical and infrared groups are identical. This makes us confident that this clustering in luminosity is not spurious despite our small sample. In the following, we will use the results for the optical luminosity clustering given by Nardini et al. (2006). These authors reported a flux ratio between group I and group II of 26. Assuming no spectral variation between optical and near infrared wavelengths, this translate into a difference in magnitude of 3.2, consistent with the observed separation. This implies that the clustering continues towards lower wavelengths than optical bands.
Previous works have shown from spectral energy distributions of GRB afterglows that optical and near-infrared data can be fit using single power laws (see e.g. Starling 2008, for one example of such works), or in other terms, that the injection frequency is lower compared to the infrared bands. We thus have :
| (1) |
with Hz. In Gendre et al. (2008), we expressed several constraints on the fireball parameters. Using these constraints and Equation 1, we can express a constraint on the total energy of the fireball (the constants C are listed in Table 2) :
| (2) |
Clearly, the constraint indicated in Eq. 2 is not relevant in the case of normal GRBs : even in the case of a wind environment with a very low density (says ) for a burst of the group xI-oI, we have . As one can clearly see in Eq. 2, in order to set a better constraint on this value, we need to observe at frequencies of the order of Hz, but still above the injection frequency.
3.4 Impact on the distance estimation
In Gendre et al. (2008), we proposed a method to estimate the distance based on the afterglow flux observed one day after the burst in the keV band. However, this method has a degeneracy, because of the existence of several groups. This degeneracy cannot be resolved by optical observations. To clear this problem, we might have used infrared information. However, the fact that we observe exactly the same groups in optical and near infrared makes it clear that we should use longer wavelengths:
| (3) |
We express in Eq. 3 the position of (Sari et al. 1998) for the different groups (the constants C are listed in Table 2). As one can see, the position of this frequency is different for each group. This implies that at a frequency below the value of group xII-oI (the lowest one), we should observe three distinct groups. Observations at such frequencies could be performed by the IRAM observatory or the future ALMA observatory.
4 Conclusions
We investigated the clustering in luminosity of Gamma-Ray Burst afterglows using near infrared (J, H, K band) observations of events observed between 1997 and the end of 2007. We corrected the gamma-ray burst afterglow light curve for distance effects and time dilation, and rescaled all light curves to a common distance of . We only used observations emitted in the near infrared in the burst frame. We observed a clustering of luminosities and a flux ratio identical to the ones observed in the optical. This implies that the injection frequency is located below the near infrared bands. We confirmed previous works on the clustering of afterglow light curves.
Such a clustering has no clear theoretical explanation yet. In order to explain it, we need to set a strong constraint on the two remaining parameters of the fireball, namely the total energy and the density of the surrounding medium. For the latter, radio observations can be used to impose constraints (see e.g. Frail et al. 2006). For the former, observations from about 100 GhZ to Hz could help. However, this observational window has not been widely used for afterglow observations. It may be interesting to obtain several observations at microwave and millimeter wavelengths that can be coupled with Swift and robotic telescopes to perform broadband spetro-temporal fitting of the afterglow.
Finally, the constraints on the fireball parameters may be related to the progenitor properties or to other conditions (such as the central engine properties) that would imply a clustering. In order to check the influence of the progenitor, one may add short GRBs (whose progenitor is thought to be a compact object binary) to the current study, that is based only on long GRBs (strongly suspected to be caused by massive stars). A clustering within the same groups would support a physical explanation not related to the progenitor but rather to the central engine of the burst.
Acknowledgements.
BG acknowledges a postdoctoral grant from the French CNES. We would like to thank the anonymous referee for a very constructive report that improved the quality of the paper, and Roger Malina for a careful reading of a draft of this Letter.References
- Amati et al. (2002) Amati, L., Frontera, F., Tavani, M., et al., 2002, A&A, 390, 81
- Barthelmy (1998) Barthelmy, S., 1998, AIP Conf. Proc. 428, 99, ed. C. Meegan & R. Preece
- Berger et al. (2001) Berger, E., Diercks, A., Frail, D. A., et al., 2001, ApJ, 556, 556
- Berger et al. (2005) Berger, E., Fox, D. B., Kulkarni, S. R., et al., 2005, ApJ, 629, 328
- Bloom et al. (1998) Bloom, J.S., Frail, D. A., Kulkarni, S. R., et al.,1998, ApJ, 508, L21
- Bloom et al. (2004) Bloom, J.S., Van Dokkum, P.G., Bailyn, C.D., et al., 2004, AJ, 127, 252
- Boër & Gendre (2000) Boër, M. & Gendre, B. 2000, A&A, 361, L21
- Castro-Tirado et al. (2001) Castro-Tirado, A.J., Sokolov, V. V., Gorosabel, J., et al., 2001, A&A, 370, 398
- Chandra et al. (2008) Chandra, P., Cenko, S.B., Frail, D., et al., 2008, ApJ, in press, arXiv:0802.2748
- Cobb et al. (2006) Cobb, B.E., Bailyn, C.D., Van Dokkum, P.G., et al., 2006, ApJ, 651, L85
- Covino et al. (2008) Covino, S., D’Avanzo, P., Klotz, A., et al., 2008, MNRAS, 288, 347
- Della Valle et al. (2006) Della Valle, M., Chincarini, G., Panagia, N., et al., 2006, Nature, 444, 1050
- Foley et al. (2006) Foley, R.J., Perley, D. A., Pooley, D., et al., 2006, ApJ, 645, 450
- Frail et al. (2006) Frail, D.A., Cameron, P.B., Kasliwal, M., et al., ApJ, 2006, 646, L99
- Fruchter et al. (1999) Fruchter, A.S., Pian, E., Thorsett, S.E., et al, 1999, ApJ, 516, 683
- Galama et al. (1997) Galama, T.J., Groot, P. J., Vanparadijs, J., et al., 1997, Nature 387, 479
- Galama et al. (2000) Galama, T.J., Tanvir, N., Vreeswijk, P. M., et al., 2000, ApJ, 536, 185
- Gal-Yam et al. (2004) Gal-Yam, A., Moon, D.S., Fox, D. B., et al., 2004, ApJ, 609, L59
- Gendre & Boër (2005) Gendre, B., & Boër, M., 2005, A&A , 430, 465
- Gendre & Boër (2006) Gendre, B., & Boër, M., 2006 AIPC, 836, 558
- Gendre et al. (2008) Gendre, B., Galli, A., & Boër, M., 2008, ApJ, 683, 620
- Ghirlanda et al. (2004) Ghirlanda, G., Ghisellini, G., & Lazzati, D., 2004, ApJ, 616, 331
- Ghirlanda et al. (2006) Ghirlanda, G., Ghisellini, G., & Firmani, C. , 2006, New Journal of Physics, 8, 123
- Gorosabel et al. (2003) Gorosabel, J., Klose, S., Christensen, L., et al., 2003, A&A, 409, 123
- Greiner et al. (2003) Greiner, J., Klose, S., Salvato, M., et al., 2003, ApJ, 599, 1223
- Halpern et al. (2000) Halpern, J.P., Uglesich, R., Mirabal, N., et al., 2000, ApJ, 543, 697
- Hjorth et al. (2003) Hjorth, J., Sollerman, J., Møller, P., et al. 2003, Nature, 423, 847
- Holland et al. (2004) Holland, S.T., Bersier, D., Bloom, J. S., et al., 2004, AJ, 128, 1955
- Jakobsson et al. (2006) Jakobsson, P., Levan, A., Fynbo, J. P. U., et al., 2006, A&A, 447, 897
- Jaunsen et al. (2008) Jaunsen, A.O., Rol, E., Watson, D.J., et al., 2008, A&A, 681, 453
- Kann et al. (2006) Kann, D.A, Klose, S., & Zeh, A., 2006, ApJ, 641, 993
- Klose et al. (2000) Klose, S., Stecklum, B., Masetti, N., et al., 2000, ApJ, 545, 271
- Klotz et al. (2008) Klotz, A., Boër, M., Atteia, J.L., & Gendre, B., 2008, AJ, submitted
- Kulkarni et al. (1999) Kulkarni, S.R., Djorgovski, S. G., Odewahn, S. C., et al., 1999, Nature, 398, 389
- Lazzati et al (2001) Lazzati, D., Covino, S., Ghisellini, G., et al., 2001, A&A, 378, 996
- Li et al. (2008) Li, A., Liang, S.L., Kann, D.A., et al., 2008, ApJ, in press, arXiv:0808.4115
- Liang & Zhang (2006) Liang, E. & Zhang, B., 2006, ApJ, 638, L67
- Malesani et al. (2004) Malesani, D., Tagliaferri, G., Chincarini, G., et al., 2004, ApJ, 609, L5
- Mangano et al. (2007) Mangano, V., Holland, S.T., Malesani, D., et al., 2007, A&A, 470, 105
- Masetti et al. (2005) Masetti, N., Palazzi, E., Pian, E., et al, 2005, A&A, 438, 841
- Metzger et al. (1997) Metzger, M.R., Djorgovski, S.G., Kulkarni, S.R., et al., 1997, Nature, 387, 879
- Meszaros (2006) Meszaros, P, 2006, Rep. Prog. Phys., 69, 2259
- Nardini et al. (2006) Nardini, M., Ghisellini, G., Ghirlanda, G., et al., 2006, A&A, 451, 821
- Pei (1992) Pei, Y.C., 1992, ApJ, 395, 130
- Price et al. (2002a) Price, P.A., Kulkarni, S. R., Berger, E., et al., 2002a, ApJ, 571, L121
- Price et al. (2002b) Price, P.A., Berger, E., Reichart, D. E., et al., 2002b, ApJ, 572, L51
- Price et al. (2003) Price, P.A., Kulkarni, S. R., Berger, E., et al., 2003, ApJ, 589, 838
- Rau et al. (2004) Rau, A., Greiner, J., Klose, S., et al., 2004, A&A, 427, 815
- Rau et al. (2005) Rau, A., Salvato, M., Greiner, J., et al., 2005, A&A, 444, 425
- Sagar et al. (2000) Sagar, R., Mohan, V., Pandey, A.K., et al 2000, BASI, 28, 15
- Sari et al. (1998) Sari, R., Piran, T., & Narayan, R. 1998, ApJ, 497, L17
- Schlegel et al. (1998) Schlegel, D.J., Finkbeiner, D.P., & Davis, M., 1998, ApJ, 500, 525
- Stanek et al. (2003) Stanek, K. Z., Matheson, T., Garnavich, P. M., et al., 2003, ApJ, 591, L17
- Starling (2008) Starling, R.L.C., 2008, A&A, in press, arXiv:0807.4144
- Stratta et al. (2004) Stratta, G., Fiore, F., Antonelli, L.A., Piro, L., & De Pasquale, M., 2004, ApJ, 608, 846
- Stratta et al. (2005) Stratta, G., Perna, R., Lazzati, D., et al., 2005, A&A, 441, 83
- Vreeswijk et al. (1999) Vreeswijk, P.M., Galama, T. J., Owens, A., et al., 1999, ApJ, 523, 171
- Willingale et al. (2007) Willingale, R., O’Brien, P. T., Osborne, J. P., et al., 2007, ApJ, 662, 1093