Measurements of Single-Top Quark Production at the Tevatron
Abstract
The latest measurements of the cross sections for singly-produced top quarks at the Fermilab Tevatron are presented. The small expected signals and the large, uncertain backgrounds require careful event selection, sophisticated methods for separating signal events from background events, and data-based background predictions and fits. Both the CDF and D0 collaborations have solid evidence of single top production, using 2.7 fb-1 and 0.9 fb-1 of data, respectively. Both collaborations perform several analyses to measure the total single-top cross section , as well as and separately.
I INTRODUCTION
The observation and precision measurement of the cross sections for single top quark production have very high priorities at the two Tevatron collaborations, CDF and D0. Top quarks are expected to be produced singly via the weak interaction, through -channel or -channel boson exchange, with a total cross section of pb stxs , assuming a top quark mass of 175 GeV. The discovery of the top quark topdisc was in production via the strong interaction since this mode has a more distinct final state (two massive top quarks instead of just one), and it has a higher cross section. The strong interaction production processes are fairly well understood, and it appears from them that the top quark is the spin-1/2 SU(2) partner of the bottom quark. Nonetheless, the top quark’s weak interactions are less well constrained by measurements. A precise measurement of single top quark production can be interpreted directly in terms of . Furthermore, nonstandard production mechanisms for single top may enhance or suppress the separate cross sections and taityuan . The simplest such model is one in which a fourth generation of quarks raises the rank of the CKM matrix from three to four, thus removing the unitarity constraint which provides, along with precise measurements of other CKM matrix elements, nearly all of our knowledge of . If a fourth generation of quarks exists, could be measurably lower than unity maltoni . On the other hand, an enhancement in is possible if a fourth generation is present, although this is increasingly well constrained by precision measurements pdg . Other models including such particles as extra singlet quarks, stop quarks, bosons, and flavor-changing neutral currents mediated by gluons would have profound, measurable effects on the single-top quark production cross sections.
Observation and measurement of singly-produced top quarks is also important from a purely technical standpoint. Because of the small size of the signal compared with not only the backgrounds but the systematic uncertainties on the backgrounds, the observation of single top quarks must be done with sophisticated multivariate techniques. These techniques have been in use in HEP for many years but continuously undergo further development, and the single top searches at CDF and D0 use the latest innovations, described here. These techniques will also be needed at the LHC, as the signal-to-background ratios for many interesting physics processes is very small. Furthermore, the dominant final state used for searching for single top production is also an important final state for searching for a Standard Model Higgs boson with a mass between 114 and 140 GeV.
II DATA, MONTE CARLO, and ANALYSIS TECHNIQUES
The CDF data sample size for the measurements presented here is 2.7 fb-1 CDF , and the D0 data sample size is 0.9 fb-1 d0prd . Both collaborations select events with an isolated, energetic lepton, two or more jets, at least one of which is b-tagged, and a large missing transverse energy. The selection requirements differ somewhat between the collaborations due to differences in the detectors and the choice of operating points. CDF requires leptons to have GeV, while D0 requires GeV. The requirement is also looser for D0: 15 GeV as compared to CDF’s 25 GeV. A feature of the -channel signal is that the top quark often recoils against a light-flavored jet which is preferentially located at high pseudorapidity, . In order to maximize the sensitivity to such events, the collaborations extend their jet coverage to (CDF) and (D0). The channels are separated by the number of jets and the number of b-tags, and the results are combined statistically at the end.
The background levels are quite high, with approximately 80% coming from +jets final states in the 2-jet sample, and 47% from +jets final states in the 3-jet sample, with most of the remainder coming from events. Only about half of the selected +jets background events have hadrons in them, even though they are -tagged. In order to provide further separation of the and signal events from , and light-flavored-jets events, a neural network flavor separator kfs is used by CDF as a continuous input variable to all of the multivariate analyses. The multivariate analyses described below are critical in order to obtain sufficient sensitivity to test for the presence of single top production.
The single top signal is characterized by several prominent features which can be exploited to separate it from the background. The mass of the top quark is already precisely measured, and signal events contain just one top quark. Hence, , where the momentum is obtained from the missing transverse energy and an constraint, is a powerful variable. Another variable is , the charge of the lepton times the pseudorapidity of the untagged jet cpyuan . This variable is powerful because -channel single top production involves radiation of a boson from a valence quark of the proton or antiproton; the quark then collides with a sea quark in the other beam to make a single top quark. The recoiling valence quark is usually a light-flavored quark which has a large momentum component along the beam axis in its original direction of motion. The charge of the lepton from decay from the top quark decay is strongly correlated with whether the original beam quark radiating the was in the proton or the antiproton. These correlations do not exist for background +jets events or events, and the jet distributions for background events are more central. Furthermore, top quarks produced singly are expected to be produced nearly 100% polarized mahlonparke . Variables taking advantage of the resulting correlations between the directions of the leptons and the jets in these events are used. Not every variable needs to key on a particular feature of the signal prediction. The variable , the invariant mass of the two jets in +two-jet events, has a more distinct distribution for the backgrounds, peaked at low masses, than for the signal, which has a broader distribution.
The collaborations use several techniques for extracting the signal from the backgrounds – boosted decision trees (BDT), matrix elements (ME), neural networks (NN) and likelihoods (LF). The same events are analyzed by each discriminant, and the input variables to the discriminants are very similar from one discriminant to another. Boosted decision trees have the advantage that the addition of variables that do not carry useful information does not adversely impact the sensitivity. D0 uses Bayesian Neural Networks bnn which are highly optimal and resistant to overtraining, and CDF uses NeuroBayes program neurobayes which has a sophisticated variable preprocessing step which also improves sensitivity while reducing the possibility of overtraining.
The matrix element technique involves integrating posterior probability densities computed with leading-order matrix elements squared for each known process, integrated over possible true values of the parton momenta, using a transfer function to express the probability density of observing a particular kinematic configuration after reconstruction, as a function of the kinematic configuration of the underlying partons. In this sense it is different from the other techniques in that the variables input to the boosted decision trees and the neural networks are the best estimates of the parton momenta, while the matrix element integrates over all possible parton momenta. CDF also has an analysis using a projective likelihood technique CDF commonly used at LEP.
The different techniques bring sensitivity to different features of the signal and the backgrounds. In order to obtain the most sensitivity to the signal, combinations of the several analyses’ results are performed within each collaboration to produce combined cross sections and significance levels.
Estimations of the systematic uncertainty are quite mature in the single top analyses. Because the background rates are so large and uncertain, the constraints from the data using the histograms of the discriminant outputs are particularly important. Sources of uncertainty like the jet energy scale (which affects and quite strongly), initial- and final-state radiation, PDF’s and variable mismodeling introduce effects both on the predicted signal and background acceptances, and also the shapes of their contributions in the final discriminant histograms. All sources of uncertainty are included with their proper correlations.
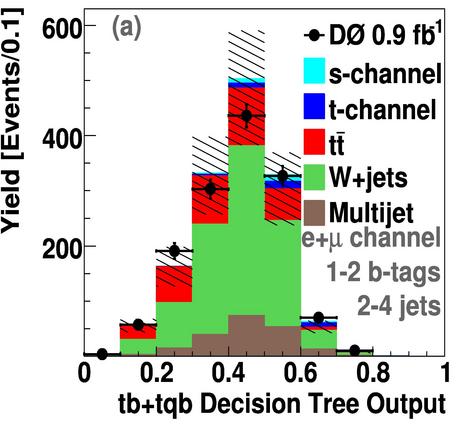
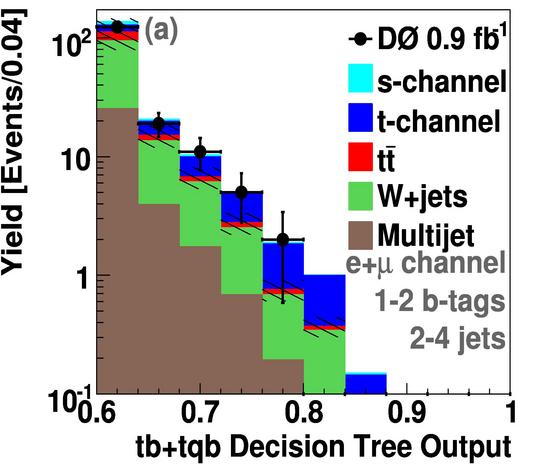
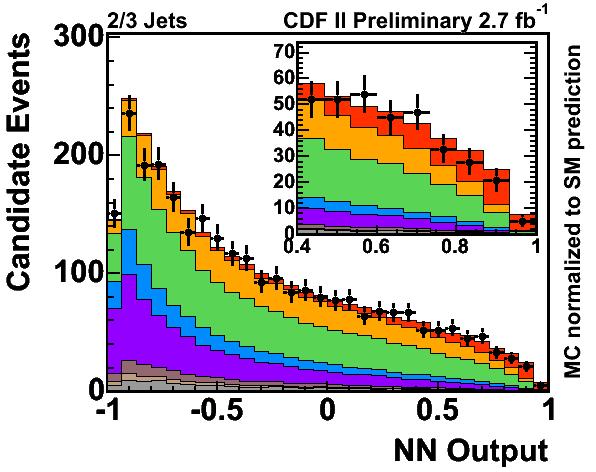
Figure 1 shows the resulting discriminant distributions of two representative analyses; the BDT analysis of D0 and the NN analysis of CDF.
III CROSS SECTION RESULTS AND SIGNAL SIGNIFICANCE
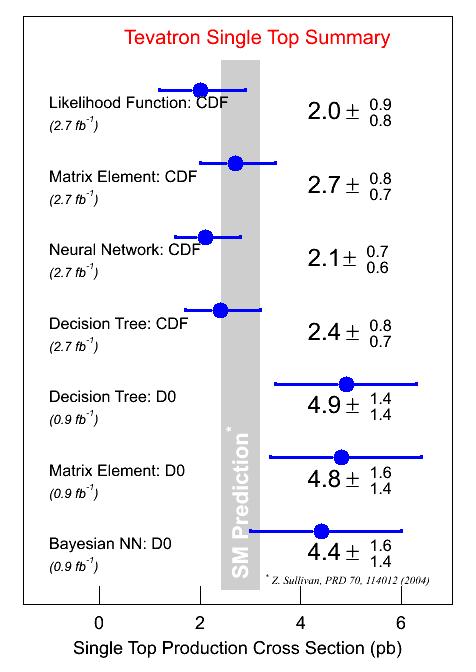
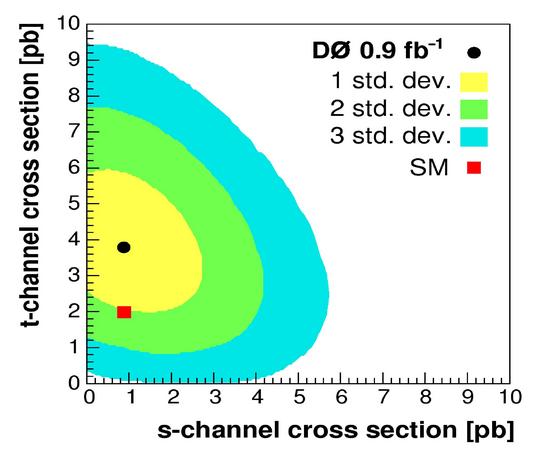
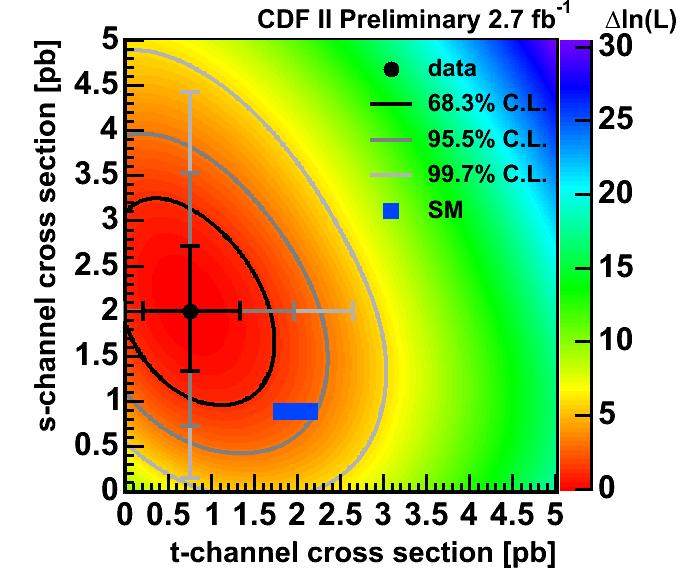
Both collaborations use a Bayesian technique to extract cross sections, integrating over systematic uncertainties pdg , using flat priors in the cross section . The measurements for each channel are summarized in Figure 2. Two-dimensional extractions of , the -channel cross section vs. , the -channel cross section, are also obtained by both experiments, separately for each analysis channel. Two examples are shown in Figure 2, for the BDT analysis of D0, and for the NN analysis of CDF.
D0 combines results using the best linear unbiased estimator technique blue , and obtains the value pb. CDF also combines its measurements in this way, but CDF in addition forms a super-discriminant out of the discriminants from the contributing analyses in order to make a single super-analysis which is more sensitive than any of the contributing ones. CDF’s super-discriminant is built using an evolutionary neural network neat CDF , which is trained to optimize the expected discovery significance, instead of the usual classification error function. CDF’s combinations were performed for the 2.2 fb-1 results, but were not finished for the 2.7 fb-1 results.
The two collaborations take similar approaches to estimate the significance of the excess of data over the background predictions. D0 computed the combined cross section in a large sample of background-only Monte Carlo pseudoexperiments and computed the -value to the the fraction of pseudoexperiments with a measured cross section greater than or equal to the observed one. D0 obtains a -value of 0.00014, which corresponds to a excess, with a median expected -value of , assuming the SM cross section for single-top production. CDF calculates -values using the likelihood ratio test statistic pearson , again using a large sample of background-only pseudoexperiments. CDF expected to see a excess in the median signal-like outcome, and observed a excess.
IV SUMMARY
Significant progress has been made by the CDF and D0 collaborations to observe single top production and to measure its total cross section, and also the two cross sections and separately. The goal is to observe the production at the level of significance or greater, and to measure the cross sections with the highest possible precision. These measurements help constrain models of new physics affecting the weak interactions of top quarks, and also models in which exotic particles contribute to the selected single-top quark sample.
References
-
(1)
B. W. Harris et al., Phys. Rev. D 66, 054024 (2002);
Z. Sullivan, Phys. ReV. D 70, 114012 (2004). -
(2)
F. Abe et al. (CDF Collaboration), Phys. Rev. Lett.
74, 2626 (2005);
S. Abachi it al. (D0 Collaboration), Phys. Rev. Lett. 74, 2632 (1995). - (3) T. Tait and C.-P. Yuan, Phys. Rev. D 63, 014018 (2001).
- (4) J. Alwall et al., Eur. Phys. J. C 49, 791 (2007).
- (5) C. Amsler et al., Physics Letters B 667, 1 (2008).
-
(6)
CDF Collaboration, conference notes 9479, 9451, 9464, 9445, and 9460 (2008);
CDF Collaboration, T. Aaltonen et al., ArXiv:0809.2581 [hep-ex] (2008), submitted to Phys. Rev. Lett. -
(7)
V. M. Abazov et al. [D0 Collaboration],
Phys. Rev. Lett. 98, 181802 (2007);
V. M. Abazov et al. [D0 Collaboration], Phys. Rev. D 78, 012005 (2008). - (8) S. Richter, Ph.D. thesis, University of Karlsruhe (2007).
- (9) C.-P. Yuan, Phys. Rev. D 41, 42 (1990).
- (10) G. Mahlon and S. J. Parke, Phys. Rev. D 55, 7249 (1997).
-
(11)
R. M. Neal, Bayesian Learning of Neural Networks
(Springer-Verlag, New York, 1996);
P. C. Bhat and H. B. Prosper, in Statistical problems in Particle Physics, Astrophysics and Cosmology, edited by L. Lyons and M. K. Ünel (Imperial College Press, London, England, 2006), p. 151. - (12) M. Feindt and U. Kerzel, Nucl. Instrum. Methods A 559, 190 (2006).
- (13) L. Lyons, D. Gibaut and P. Clifford, Nucl. Instrum. Meth. A 270, 110 (1988).
- (14) K. O. Stanley and R. Miikkulainen, Evolutionary Computation 10 (2) 99-127 (2002).
- (15) J. Neyman and E. Pearson, Philos. Trans. R. Soc. London Ser. A 231 289 (1933).