Investigating the age and structure of the infrared old open clusters LK 1, LK 10, FSR 1521 and FSR 1555
Abstract
The combination of several mass-decreasing processes may critically affect the structure of open clusters (OCs), to the point that most dissolve into the field in a time-scale shorter than Gyr. Therefore, as is observed, old OCs should be sparse within the Galaxy. These mass-decreasing processes can only be quantifiably examined given the derivation of the fundamental parameters, age, distance and mass, for a sample of old OCs. In this paper we focus on 4 candidate old star clusters, namely, LK 1, LK 10, FSR 1521, and FSR 1555. The first two clusters, discovered by Le Duigou & Knödlseder, are projected towards the Cygnus Association, whilst the remaining two have been detected in the 4th quadrant as cluster candidates from stellar overdensities by Froebrich, Scholz & Raftery. To analyse the target clusters we construct near infrared colour-magnitude diagrams (CMDs) and derive stellar radial density profiles (RDPs). The CMDs are constructed using 2MASS , , and bands, and the intrinsic morphologies of the target OCs within these diagrams are revealed by applying a field-star decontamination algorithm. Fundamental parameters are estimated with Padova isochrones built for the 2MASS filters. We derive extinctions to the objects within the range , which makes them suitable for the near-infrared analysis, ages within Gyr, and distances from the Sun within kpc. These distances, in conjunction with the positions in the sky, place the present 4 OCs close to the solar circle ( kpc). For LK 10 our photometry reaches a depth mags below the main sequence turn off, from which we derive a relatively steep mass function slope () when compared to the Salpeter value (). LK 10 is a rather massive old OC, with a mass within , for stars in the observed magnitude range and the extrapolation to , respectively. The mass estimated in the restricted magnitude range for the remaining, more distant OCs is within . However, similarity with the CMD morphology and red clump of LK 10 suggests that they may be as massive as LK 10. The RDPs are well represented by a King-like function, except LK 10, which has a central cusp suggesting post-core collapse. Structurally, LK 1, FSR 1521, and FSR 155 are similar to a sample of nearby OCs of comparable age.
keywords:
(Galaxy:) open clusters and associations: general; (Galaxy:) open clusters and associations: individual:LK 1, LK 10, FSR 1521, and FSR 1555.1 Introduction
The majority of the Galactic open clusters (OCs), the less massive ones in particular, do not survive the Gyr age barrier (Friel 1995; Bonatto & Bica 2007b, and references therein). These systems are affected by several processes that continually change the gravitational potential, such as mass loss associated with stellar evolution, mass segregation and evaporation, tidal interactions with the Galactic disc and bulge, and collisions with giant molecular clouds. As clusters age, these mechanisms accelerate the internal dynamical evolution, which leads to important changes in the structure and flat, eroded mass functions. In most cases, OCs have their stellar content completely dissolved in the Galactic field, or leave only poorly-populated remnants (Pavani & Bica 2007 and references therein).
Ample evidence gathered on theoretical (e.g. Spitzer 1958; Lamers & Gieles 2006), N-body (e.g. Baumgardt & Makino 2003; Goodwin & Bastian 2006; Khalisi, Amaro-Seoane & Spurzem 2007), and observational (e.g. van den Bergh 1957; Oort 1958; von Hoerner 1958; Piskunov et al. 2007) grounds indicate that, near the Solar circle, the disruption-time scale () is shorter than Gyr. The disruption-time scale around the Solar circle appears to depend on mass as (Lamers & Gieles 2006). Thus, for clusters with mass within , a disruption time of should be expected. In addition, disruption processes are stronger for the more centrally located and lower-mass OCs (see Bonatto & Bica 2007b for a review on disruption effects and time-scales). Gyr-class OCs are found preferentially near the Solar circle and in the outer Galaxy (e.g. Friel 1995; Bonatto et al. 2006a), where the frequency of potentially disrupting dynamical interactions with giant molecular clouds and the disc is lower (e.g. Salaris, Weiss & Percival 2004; Upgren, Mesrobian & Kerridge 1972). As an extreme case, inner ( pc) Galactic tidal fields can dissolve a massive star cluster in a time-scale as short as Myr (Portegies Zwart et al. 2002).
What should be expected from the above scenario is that only a small fraction of the OCs survive the Gyr age-barrier, with the successful ones spending most of their existences preferentially at large Galactocentric distances. Indeed, present-day statistics show that of the OCs with known age listed in the WEBDA111obswww.univie.ac.at/webda database, 180 are older than 1 Gyr, and only 18 () are older than 4 Gyr (see also Ortolani et al. 2005; Ortolani, Bica & Barbuy 2005). Additionally, most of the OCs older than 1 Gyr so far identified are located outside the Solar circle (see, e.g., the spatial distribution of OCs of different ages in Fig. 1 of Bonatto & Bica 2007b).
Given the aspects discussed above, a more thorough and wide-ranging exploration of the OC parameter space - the older ones in particular - is fundamental for a better understanding of the dynamical process that affect the star clusters. In this sense, it is important to unambiguously establish the nature of as many old OCs as possible, followed by the derivation of reliable astrophysical parameters. Such parameters, in turn, can be used in studies of star formation and evolution processes, dynamics and survival rates of star clusters, the geometry of the disc, among others.
| Cluster | Age | Reference |
| (Gyr) | ||
| FSR 869 | 1.5 | Bonatto & Bica (2008c) |
| FSR 942 | 1.0 | Bonatto & Bica (2008c) |
| FSR 70 | Bica, Bonatto & Camargo (2008) | |
| FSR 124 | 1.0 | Bica, Bonatto & Camargo (2008) |
| ESO 277SC1 (FSR 1723) | 0.8 | Bica, Bonatto & Camargo (2008) |
| FSR 1737 | Bica, Bonatto & Camargo (2008) | |
| Ru 101 (FSR 1603) | 1.0 | Bica & Bonatto (2008) |
| FSR 1744 | 1.0 | Bonatto & Bica (2007b) |
| FSR 89 | 1.0 | Bonatto & Bica (2007b) |
| FSR 31 | 1.1 | Bonatto & Bica (2007b) |
| Cz 23 (FSR 834) | 4.5 | Bonatto & Bica (2008d) |
| FSR 1716 | Bonatto & Bica (2008d) | |
| FSR 1415 | 2.0 | Momany et al. (2008) |
| Bica 6 (BBS 1) | 1.0 | Bonatto, Bica & Santos Jr. (2008) |
-
Bica 6 (DAML02), located at and , is probably physically associated with the planetary nebula PK 167-0.1.
| Literature | This paper | ||||||||||||
| Cluster | Age | ||||||||||||
| (hms) | () | (hms) | () | (∘) | (∘) | (Gyr) | (mag) | (kpc) | (kpc) | (kpc) | (kpc) | (kpc) | |
| (1) | (2) | (3) | (4) | (5) | (6) | (7) | (8) | (9) | (10) | (11) | (12) | (13) | (14) |
| LK 1 | 20:24:25 | 36:24:18 | () | 36:24:30.0 | 75.24 | ||||||||
| LK 10 | 20:39:13 | 39:58:37 | () | 39:58:43.2 | 79.84 | ||||||||
| FSR 1521 | 09:55:23 | 56:36:06 | 09:55:22.3 | 56:37:16.8 | 280.45 | ||||||||
| FSR 1555 | 10:49:07 | 59:03:17 | 10:48:55.8 | 59:02:58.9 | 287.75 | ||||||||
-
Coordinates (cols. 2 and 3) of LK 1 and LK 10 from Le Duigou & Knödlseder (2002); FSR 1521 and FSR 1555 from Froebrich, Scholz & Raftery (2007); Cols. 4-7: optimised coordinates; (): same value as in the literature; Col. 9: reddening towards the cluster’s central region (Sect. 5). Col. 10: distance from the Sun. Col. 11: cluster Galactocentric distance for kpc (Bica et al. 2006). Cols. 12-14: coordinate components projected onto the Galactic plane.
In the present paper we focus on 4 candidate old OCs, namely, LK 1, LK 10, FSR 1521, and FSR 1555. LK 1 and LK 10 are projected towards Cygnus and were found by Le Duigou & Knödlseder (2002). An additional interesting point is to determine whether LK 1 and/or LK 10 are part of the Cygnus Association. FSR 1521 and FSR 1555 were found as candidate open clusters inferred from stellar overdensities by Froebrich, Scholz & Raftery (2007).
This work employs near-IR , , and photometry obtained from the 2MASS222The Two Micron All Sky Survey, All Sky data release (Skrutskie et al. 1997), available at http://www.ipac.caltech.edu/2mass/releases/allsky/ Point Source Catalogue (PSC). The spatial and photometric uniformity of 2MASS, which allow extraction of large surrounding fields that provide high star-count statistics, make it an excellent resource to gather photometric data on a broad variety of star clusters, the wide field ones in particular. For this purpose we have developed quantitative tools to statistically disentangle cluster evolutionary sequences from field stars in colour-magnitude diagrams (CMDs), which are subsequently used to investigate the nature of star cluster candidates and to derive astrophysical parameters of the confirmed clusters (e.g. Bica, Bonatto & Camargo 2008). Basically, we apply (i) field-star decontamination to quantify the statistical significance of the CMD morphology, which is fundamental to deriving reddening, age, and distance from the Sun, and (ii) colour-magnitude filters, which are essential for intrinsic stellar radial density profiles (RDPs), as well as luminosity and mass functions (MFs). In particular, the use of field-star decontamination in the construction of CMDs has proved to constrain the age and distance more than when working with the raw (observed) photometry, especially for low-latitude OCs (Bonatto et al. 2006a).
This paper is organised as follows. In Sect. 2 we recall recent additions to the known old OCs made by our group. Sect. 3 contains basic properties and reviews literature data (where available) on the present star cluster candidates. In Sect. 4 we present the 2MASS photometry, build CMDs, and apply the field-star decontamination algorithm. In Sect. 5 we derive cluster fundamental parameters. Sect. 6 describes cluster structure by means of stellar RDPs. In Sect. 7 we provide estimates of cluster mass. In Sect. 8 we compare the structural parameters and dynamical state of the present clusters with those of a sample of nearby OCs, we also discuss effects of the location in the Galaxy on their structure. Concluding remarks are given in Sect. 9.
2 Recent additions to the known population of old OCs
In recent years our group has been systematically analysing infrared clusters or candidates, establishing their nature and deriving cluster fundamental parameters with the 2MASS catalogue (e.g. Bica, Bonatto & Camargo 2008). We make use of a field decontamination algorithm (described in Sect. 4.1) to statistically extract estimated cluster sequences from CMDs. Especially for crowded fields, the cluster sequence isolation requires some form of membership selection (e.g. Bonatto & Bica 2007b). Old OCs are intrinsically rarer than young clusters (Sect. 1), but the 2MASS catalogue, coupled to the statistical tools that we have developed to deal with clusters and comparison fields allow the detection (and derivation of reliable astrophysical parameters) of older OCs (e.g. Bonatto & Bica 2007b; Bica & Bonatto 2008).
Recently, Froebrich, Scholz & Raftery (2007) provided a catalogue of star cluster candidates corresponding to 1021 stellar overdensities detected in the 2MASS database. This catalogue covers and all Galactic longitudes, and has become an important source of new star clusters. Several followup studies have explored the FSR catalogue with different approaches, revealing new globular clusters, such as FSR 1735 (Froebrich, Meusinger & Scholz 2007) and FSR 1767 (Bonatto et al. 2007), and the probable GCs FSR 584 (Bica et al. 2007) and FSR 190 (Froebrich, Meusinger & Davis 2007). We show in Table 1 14 recent identifications of old OCs made by our group. Three of them are optical objects, while the remaining 11 are infrared ones. Compared to the DAML02333http://www.astro.iag.usp.br/ wilton/ optical catalogue of OCs, our results increased the known sample of old OCs by .
3 The target clusters
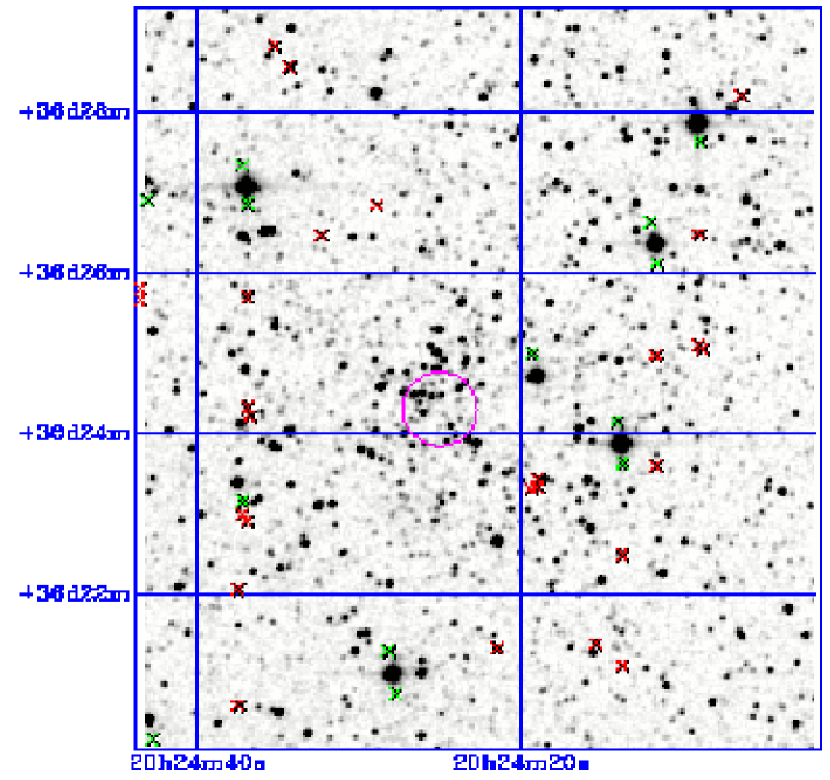
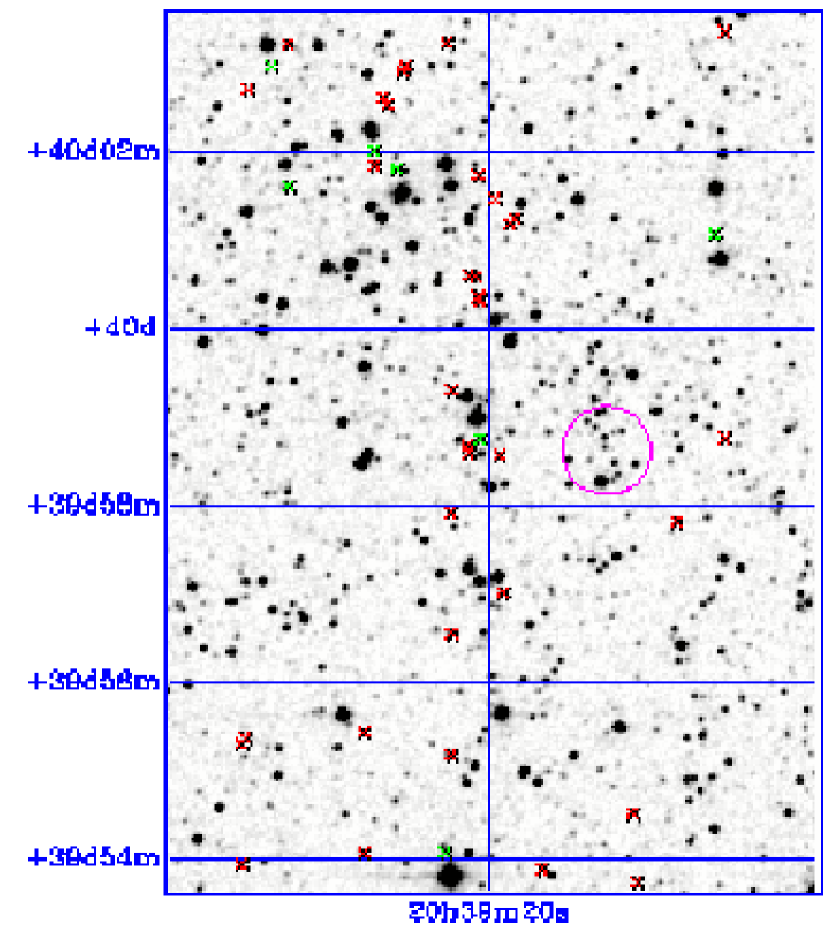
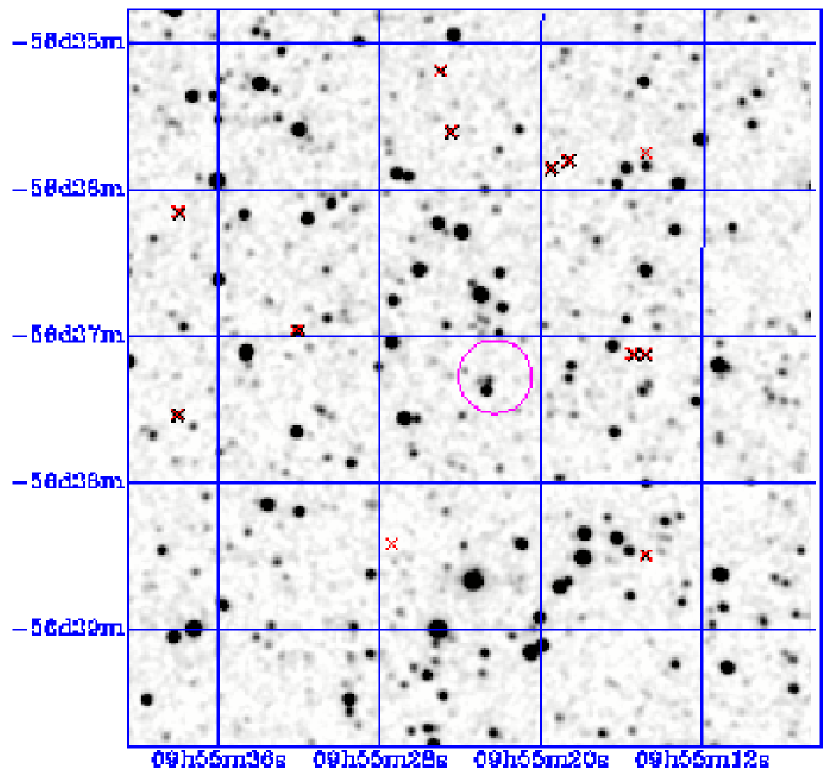
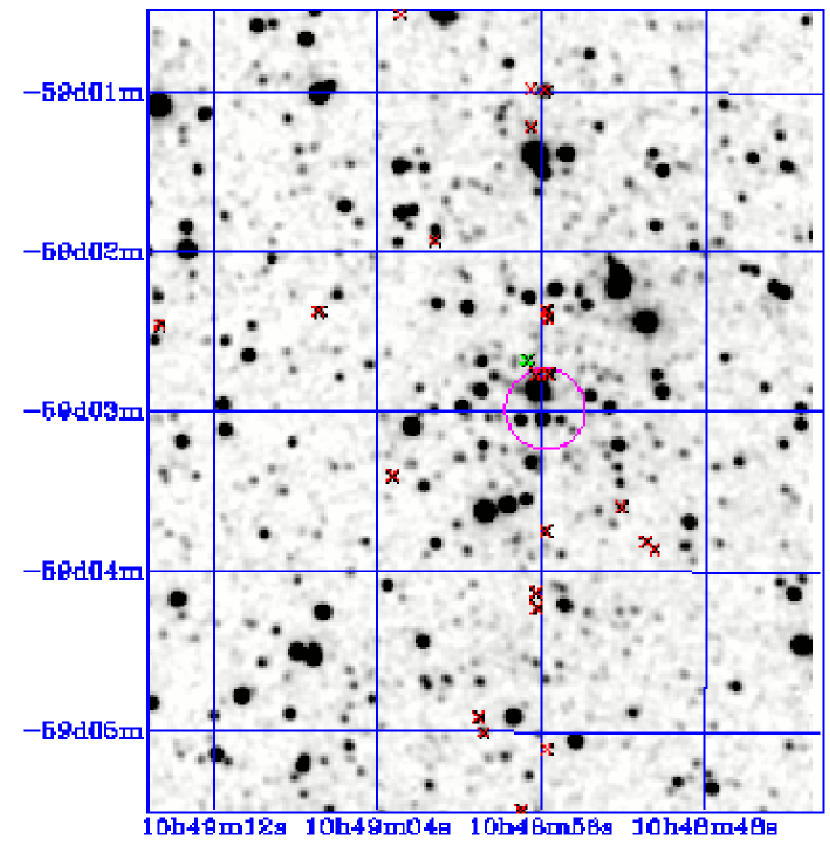
Le Duigou & Knödlseder (2002) provided a list of 17 star clusters and candidates in the Cygnus direction. As they point out, 12 of these objects (hereafter designated by LK) had already been found by Dutra & Bica (2001). Most of the LK objects appear to be embedded clusters, but some of them, like LK 1 and LK 10, have features typical of older clusters. With 2MASS photometry, they were able to estimate some cluster parameters. For LK 1 they derived a radius (containing 90% of the stars) , the distance modulus , the absorption in the K band , and a mass within ; they suggested that LK 1 may be a rather evolved cluster. As for LK 10, they found , , , , a rather steep mass function (MF: ) slope , and suggested that it is quite evolved. Near-infrared 2MASS images of LK 1 and LK 10, covering fields, are shown in Fig. 1 (top panels).
FSR 1521 was classified by Froebrich, Scholz & Raftery (2007) as a highly probable star cluster candidate. They derived the core and tidal radii (measured in 2MASS images) and , respectively. FSR 1521 can be seen in the image shown in Fig. 1 (bottom-left panel).
FSR 1555 was also classified as a highly probable star cluster candidate by Froebrich, Scholz & Raftery (2007), who derived and for this object. FSR 1555 is shown in the image shown in Fig. 1 (bottom-right panel). In general, the clusters in the present sample are very contaminated by field stars, which requires specific tools to analyse them.
Table 2 provides fundamental data on the objects, where the literature coordinates are given in cols. 2 and 3. However, when we built the RDPs based on these coordinates (Sect. 6), we noticed that, in all cases, the coordinates where the maximum stellar number-density occurs are slightly shifted with respect to the literature positions. Thus, hereafter we will refer as cluster coordinates those that maximise the central stellar density (given in cols. 4-7). The age, central reddening, distance from the Sun, Galactocentric distance, and the components projected onto the Galactic plane derived in the present study (Sect. 5) are given in Cols. 8 to 14.
4 Colour-magnitude diagrams with 2MASS photometry
Photometry in the 2MASS , , and bands was extracted in circular fields of radius centred on the coordinates of the objects (Table 2) by means of VizieR444http://vizier.u-strasbg.fr/viz-bin/VizieR?-source=II/246. should be large enough to allow the determination of the background level (Sect. 6). In the present cases, (FSR 1521 and FSR 1555), (LK 1), and (LK 10), which are considerably larger than the cluster radius (Sect. 6 and col. 5 of Table 4). Previous works with OCs in different environments (Sect. 1) have shown that in the absence of a populous neighbouring cluster and significant differential absorption (Sect. 4.1.1), wide extraction areas provide the necessary statistics for a consistent colour and magnitude characterisation of the field stars. For decontamination purposes, comparison fields were extracted within wide rings located beyond the cluster radii. As photometric quality constraint, the 2MASS extractions were restricted to stars (i) brighter than those of the 99.9% Point Source Catalogue completeness limit555According to the 2MASS Level 1 Requirement, at http://www.ipac.caltech.edu/2mass/releases/allsky/doc/ in the cluster direction, and (ii) with errors in , , and smaller than 0.3 mag. The 99.9% completeness limits refer to field stars, and depend on Galactic coordinates. For the present clusters, the fraction of stars with , , and uncertainties smaller than 0.06 mag is . A typical distribution of uncertainties as a function of magnitude, for clusters projected towards the central parts of the Galaxy, can be found in Bonatto & Bica (2007a). Reddening transformations use the relations , , , and (Dutra, Santiago & Bica 2002), for a constant total-to-selective absorption ratio . These ratios were derived from the extinction curve of Cardelli, Clayton & Mathis (1989).
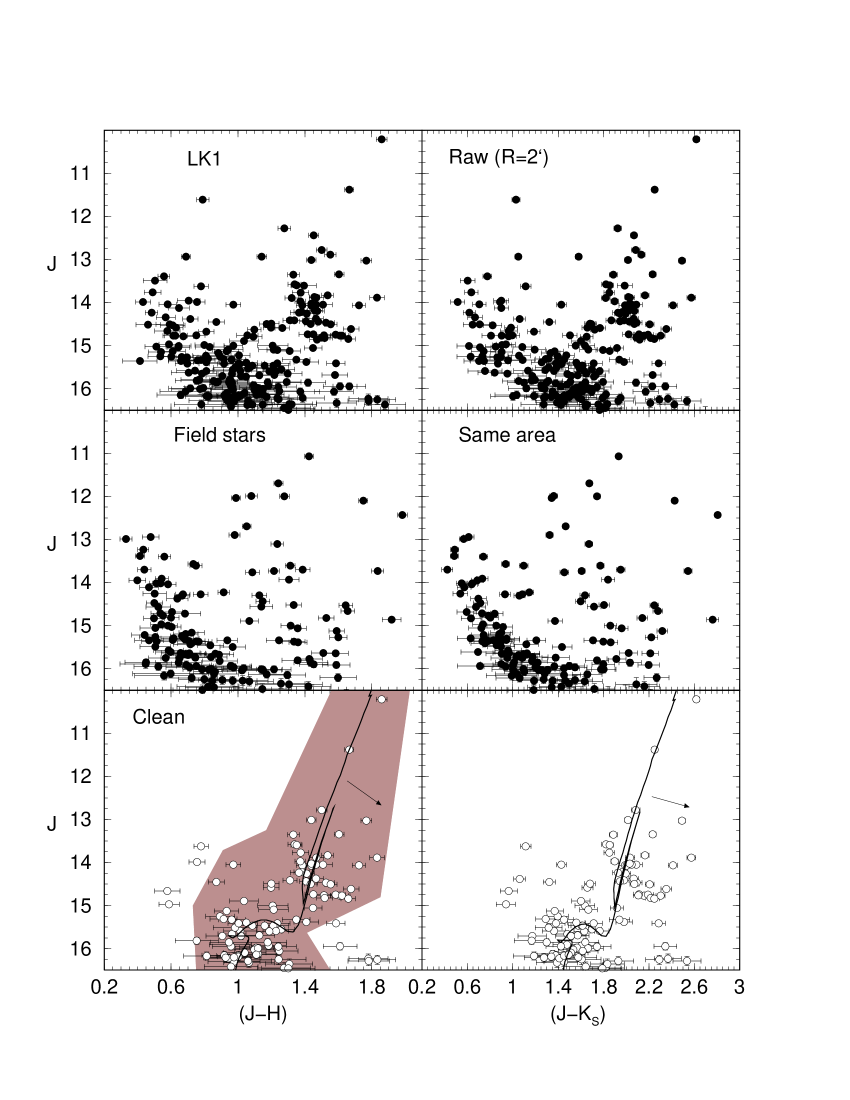
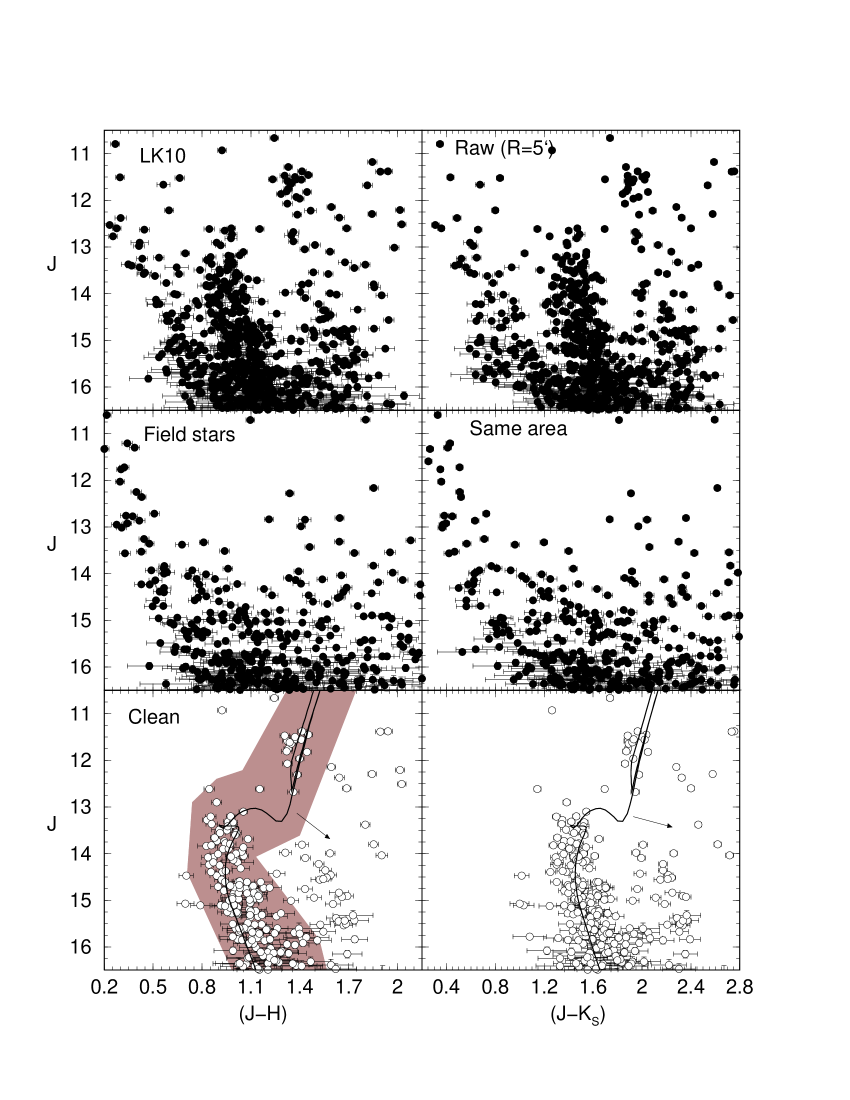
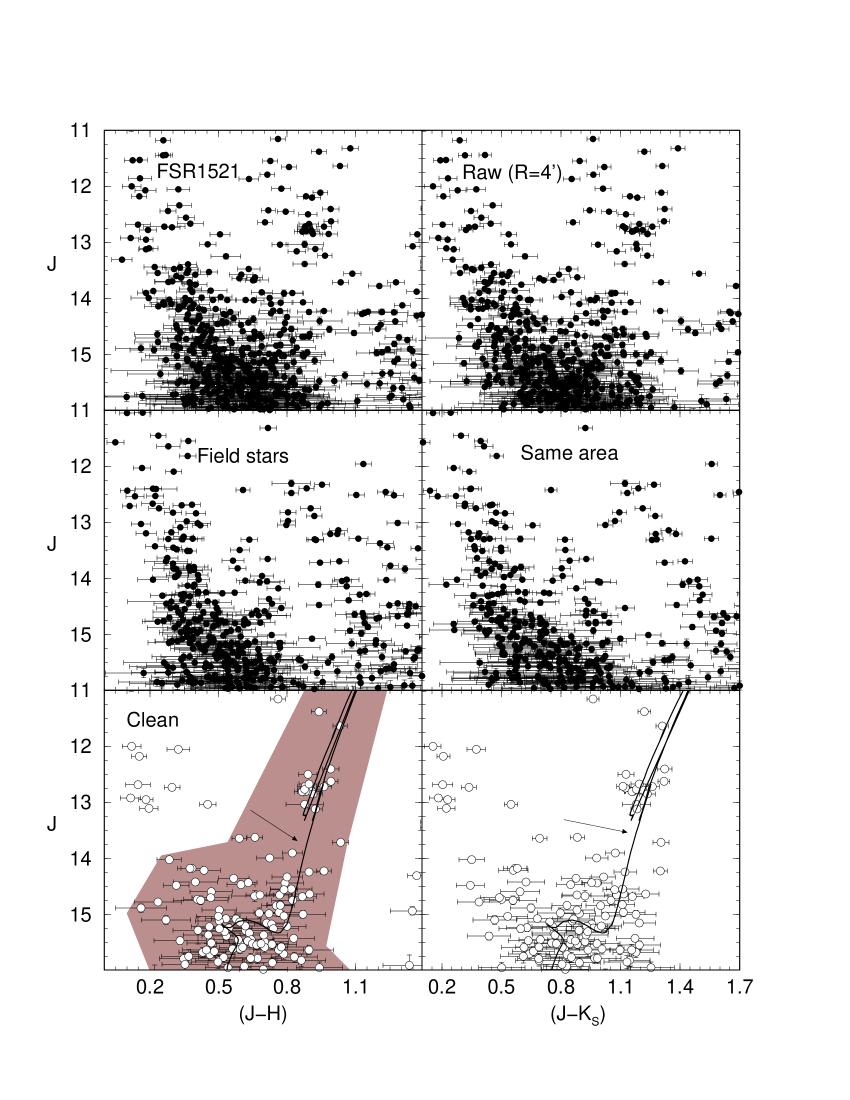
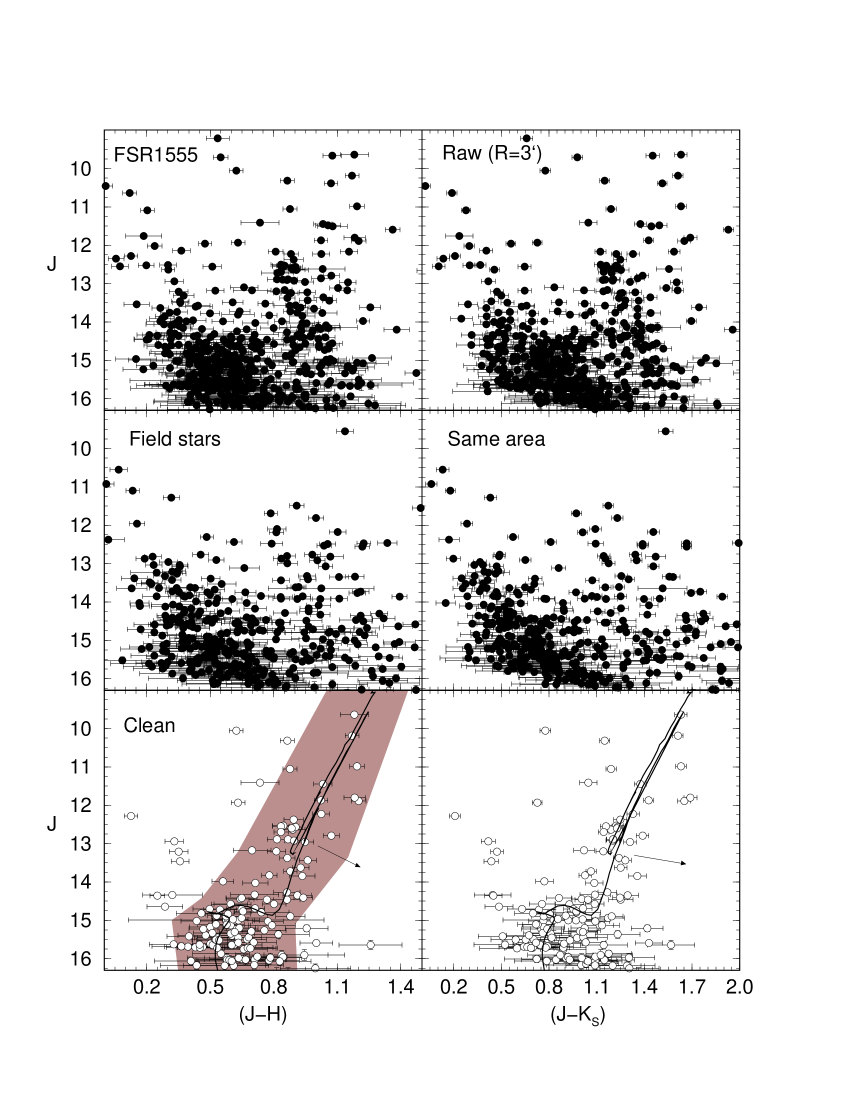
CMDs displaying the and colours built with the raw photometry of the present clusters are shown in Figs. 4 - 7 (top panels). For all clusters, the sampled region is larger than the respective core (Table 4). When qualitatively compared with the CMDs extracted from the equal-area comparison fields (middle panels), features typical of old OCs are apparent. A relatively populous red clump (at and ) and a main-sequence turn off (MSTO) stand out over the field contamination of LK 1 (Fig. 4). A somewhat less-populous red clump (, ) and about 3 MS mags () are seen in LK 10 (Fig. 5). LK 1 (Fig. 4), FSR 1521 (Fig. 6), and FSR 1555 (Fig. 7) present similar CMDs, with clear red clumps, the MSTO, and about 1 mag of the MS below. The red clump of FSR 1521 occurs at and , while for FSR 1555 it is at and .
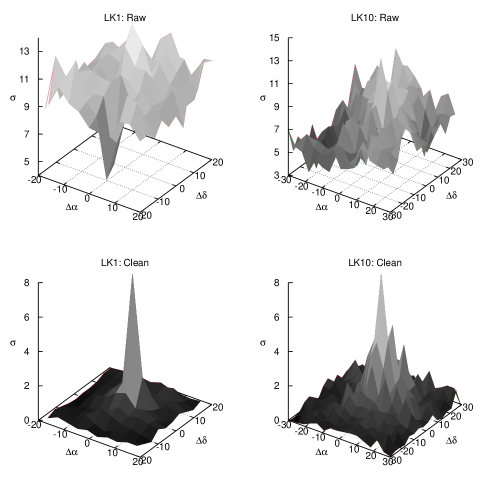
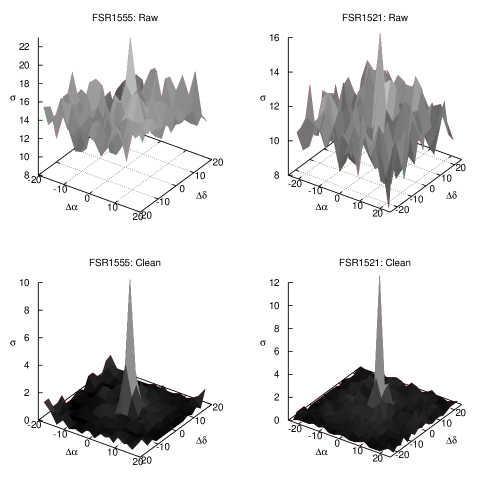
Finally, we show in Figs. 2 and 3 the spatial distribution of the stellar surface-density as measured in the 2MASS photometry. We compute the surface density (in units of ), in a rectangular mesh with cells of dimensions . The meshes reach total offsets of with respect to the centre (Table 2), in right ascension and declination; for LK 10 we use offsets of 30′. In all clusters, the core (Table 4) is contained in the central cell.
With respect to the surface-densities built with the observed (raw) photometry (top panels of Figs. 2 and 3), an important excess appears in the central cell, except for LK 10 which, because of the contamination by disc stars, presents a rather irregular distribution. FSR 1521 and FSR 1555, on the other hand, clearly detach in the central cell (Fig. 3) against more uniform surrounding fields. As shown in the bottom panels, the cluster overdensities are clearly enhanced with respect to the surroundings in the field-star decontaminated surfaces (Sect. 4.1).
4.1 Field-star decontamination
As expected of low-latitude clusters (Table 2), the stellar surface-density in the direction of the objects (Figs. 2 and 3) clearly shows that field-star contamination, essentially from disc stars, should be taken into account. This fact is confirmed by the qualitative comparison between the CMDs extracted within the cluster and in the field (Figs. 4-7). Thus, the field-star contribution should be quantified in each case to better define the intrinsic CMD morphology.
Field-star decontamination is a very important, yet difficult, step in the identification and characterisation of star clusters. Several approaches have been used to this purpose (e.g. Mercer et al. 2005), and most of them are based essentially on two different premises. The first works with spatial variations of the star-count density, but does not take into account CMD properties. In the latter, stars in a CMD extracted from an assumed cluster region are subtracted according to colour and magnitude similarity with the stars of an equal-area comparison field CMD. These methods, together with the one we work with, are based on photometric properties only. Ideally, more robust results on cluster membership determination would be obtained if another independent parameter, such as the proper motion of member and comparison field stars, is taken into account. However, for proper motions to be useful the target cluster should be relatively close (e.g. Alessi, Moitinho & Dias 2003) and/or to have been observed in widely-apart epochs, preferentially with high resolution, such as in the case of the globular cluster NGC 6397 (Richer et al. 2008). Neither condition is satisfied for the present clusters, which are relatively distant (Sect. 5) and have been observed by 2MASS in a single epoch.
4.1.1 Description of the algorithm
We work with the statistical algorithm introduced by Bonatto & Bica (2007a) to deal with the field-star contamination in CMDs. The algorithm takes into account simultaneously star-count density and colour/magnitude similarity between cluster and comparison field. It measures the relative number densities of probable field and cluster stars in cubic CMD cells whose axes correspond to the magnitude and the and colours666These are the 2MASS colours that provide the maximum variance among CMD sequences for OCs of different ages (e.g. Bonatto, Bica & Girardi 2004).. The algorithm: (i) divides the full range of magnitude and colours covered by the CMD into a 3D grid, (ii) calculates the expected number density of field stars in each cell based on the number of comparison field stars with similar magnitude and colours as those in the cell, and (iii) subtracts the expected number of field stars from each cell. By construction, the algorithm is sensitive to local field-star contamination (Bonatto & Bica 2007a). Typical cell dimensions are , and , which are large enough to allow sufficient star-count statistics in individual cells and small enough to preserve the CMD morphology. The comparison fields are located within (LK 1), (LK 10), and (FSR 1521 and FSR 1555). The inner boundary of the comparison field lies beyond the probable tidal radius (Sect. 6), which minimises the probability of oversubtraction of cluster stars. We emphasise that the equal-area field extractions (middle panels of Figs. 4 - 7) should be taken only for qualitative comparisons. The decontamination is based on the large surrounding area as described above. Further details on the algorithm are given in Bonatto & Bica (2007a).
| LK 1 () - | LK 10 () - | |||||||||
| (mag) | (stars) | (stars) | (stars) | (stars) | (stars) | (stars) | ||||
| 8–9 | — | — | — | — | — | 1 | 1.0 | 0.21 | 0.33 | |
| 9–10 | — | — | — | — | — | 0 | 0.0 | 0.61 | 0.38 | |
| 10–11 | 1 | 1.0 | 0.18 | 0.18 | 6 | 2.1 | 0.70 | 0.19 | ||
| 11–12 | 1 | 0.7 | 0.23 | 0.09 | 15 | 3.1 | 2.46 | 0.28 | ||
| 12–13 | 1 | 0.4 | 0.35 | 0.06 | 12 | 2.2 | 5.66 | 0.28 | ||
| 13–14 | 15 | 3.3 | 1.38 | 0.11 | 32 | 3.9 | 11.94 | 0.29 | ||
| 14–15 | 32 | 4.2 | 2.65 | 0.10 | 67 | 5.8 | 25.83 | 0.32 | ||
| 15–16 | 34 | 3.6 | 3.76 | 0.08 | 79 | 5.3 | 56.14 | 0.35 | ||
| 16–16.5 | 29 | 3.8 | 6.93 | 0.22 | 74 | 4.6 | 32.87 | 0.16 | ||
| 8–16.5 | 113 | 7.2 | 10.7 | 0.09 | 286 | 8.9 | 15.6 | 0.21 | ||
| FSR 1521 () - | FSR 1555 () - | |||||||||
| (mag) | (stars) | (stars) | (stars) | (stars) | (stars) | (stars) | ||||
| 8–9 | 1 | 0.7 | 0.87 | 0.87 | — | — | — | — | — | |
| 9–10 | — | — | — | — | — | 0 | 0.0 | 0.47 | 0.33 | |
| 10–11 | 1 | 0.7 | 1.09 | 0.21 | 2 | 1.4 | 0.91 | 0.12 | ||
| 11–12 | 6 | 1.4 | 1.82 | 0.14 | 6 | 2.0 | 1.08 | 0.61 | ||
| 12–13 | 21 | 3.3 | 1.81 | 0.07 | 11 | 2.5 | 1.50 | 1.34 | ||
| 13–14 | 13 | 1.7 | 3.04 | 0.06 | 12 | 2.3 | 2.33 | 1.94 | ||
| 14–15 | 42 | 3.4 | 12.32 | 0.11 | 62 | 6.0 | 3.77 | 4.52 | ||
| 15–16 | 64 | 3.9 | 10.44 | 0.05 | 57 | 5.2 | 5.61 | 10.13 | ||
| 8–16 | 146 | 6.1 | 15.3 | 0.03 | 150 | 8.2 | 16.3 | 0.08 | ||
-
For each magnitude bin (), we give the number of observed stars () within the spatial region sampled in the CMDs shown in the top panels of Figs. 4 and 5, the respective number of probable member stars () computed by the decontamination algorithm, the parameter, the Poisson fluctuation () around the mean, with respect to the star counts measured in the 8 sectors of the comparison field, and the field-star uniformity parameter. The statistical significance of is reflected in its ratio with the Poisson fluctuation of () and with . The bottom line corresponds to the full magnitude range. The subtraction efficiency () is also given.
As discussed in Bonatto & Bica (2007a), differential reddening between cluster and field stars may be critical for the decontamination algorithm. Important gradients would require large cell sizes or, in extreme cases, preclude application of the algorithm altogether. Basically, it would be required colour differences of (0.25, in the present work) between cluster and comparison field for the differential reddening to affect the subtraction in a given cell. However, the cluster and comparison field CMDs (Figs. 4-7) indicate that differential reddening is not important for the present sample.
4.1.2 Decontamination statistics
Additional statistical analysis is required because of the relatively high reddening values (Table 2) affecting the clusters. In Table 3 we present the full statistics of the decontamination, discriminated by magnitude bins. Statistically relevant parameters are: (i) which, for a given magnitude bin, corresponds to the ratio of the decontaminated number of stars to the Poisson fluctuation of the number of observed stars, (ii) , which is related to the probability that the decontaminated stars result from the normal star count fluctuation in the comparison field and, (iii) , which measures the star-count uniformity of the comparison field. Properties of , , and , measured in OCs and field fluctuations are discussed in Bica, Bonatto & Camargo (2008). Table 3 also provides integrated values of the above parameters, which correspond to the full magnitude range spanned by the CMD of each OC. The spatial regions are those sampled by the CMDs shown in the top panels of Figs. 4-7.
CMDs of star clusters should have integrated values significantly higher than 1 (Bica, Bonatto & Camargo 2008), a condition that is met for the present objects (). As a further test of the statistical significance of the above results, we investigate star count properties of the field stars. First, the comparison field is divided into 8 sectors around the cluster centre. Next, we compute the parameter , which is the Poisson fluctuation around the mean of the star counts measured in the 8 sectors (corrected for the different areas of the sectors and cluster extraction). In a spatially uniform comparison field, is expected to be very small. Thus, OCs should have the probable number of member stars () higher than , to minimise the probability that arises from fluctuations of a non-uniform comparison field. This condition is fully satisfied by the present clusters, reaching the level . We also provide in Table 3 the parameter . For a given magnitude bin we first compute the average number of stars over all sectors and the corresponding fluctuation ; thus, is defined as . Non uniformities such as heavy differential reddening should result in high values of . On the other hand, is low (), except for LK 10 (), which reflects a rather irregular field (Fig. 2). Finally, we note that the number of decontaminated stars in most magnitude bins is larger than what could be expected from field-star fluctuations ().
Since we usually work with comparison fields larger than the possible-cluster extractions, the correction for the different spatial areas between field and cluster is expected to produce a fractional number of probable field stars () in some cells. Before the cell-by-cell subtraction, the fractional numbers are rounded off to the nearest integer, but limited to the number of observed stars in each cell , where NI represents rounding off to the nearest integer). The global effect is quantified by means of the difference between the expected number of field stars in each cell () and the actual number of subtracted stars (). Summed over all cells, this quantity provides an estimate of the total subtraction efficiency of the process,
Ideally, the best results would be obtained for an efficiency . With the assumed grid settings for the decontamination of the present clusters, the subtraction efficiencies turned out to be higher than 90%.
4.1.3 Decontaminated CMDs and surface densities
As an indicator of the algorithm efficiency we can take the decontaminated stellar surface-density distributions (bottom panels of Figs. 2 and 3). The central excesses have been significantly enhanced with respect to the raw photometry (top panels), while the residual surface-density around the centre has been reduced to a minimum level. By design, the decontamination depends essentially on the colour-magnitude distribution of stars located in different spatial regions. The fact that the decontaminated surface-density presents a conspicuous excess only at the assumed cluster position implies significant differences among this region and the comparison field, both in terms of colour-magnitude and number of stars within the corresponding colour-magnitude bins. This meets the expectations of star clusters, which can be characterised by a single-stellar population, projected against a Galactic stellar field.
The decontaminated CMDs are shown in the bottom panels of Figs. 4 - 7. As expected, essentially all of the disc contamination is removed, leaving stellar sequences typical of reddened old OCs, with well-developed red clumps and different extents of the MS.
As a caveat, we cannot exclude the possibility of differential reddening to account for part of the observed spread in the CMD distribution of stars. To examine this issue we show, in the bottom panels of Figs. 4-7, reddening vectors computed with the 2MASS ratios (Sect. 4) for a standard visual absorption . Given the absorptions derived for the clusters (Table 2), the standard value, which represents from to of the total , can be taken as an upper limit to the differential reddening. Together with the decontaminated CMDs, this experiment suggests that differential reddening in all cases is not large, because the giant clumps are rather tight, while the MS spread appears to be dominated by photometric errors. The typical dependence of the 2MASS photometric errors on magnitude, for objects projected along different directions, is discussed in Bonatto & Bica (2007b).
We conclude that the qualitative and quantitative expectations of the decontamination algorithm have been satisfied by the output. In all cases, the decontaminated photometry presents a conspicuous excess, with respect to the surroundings, in the surface-density distribution (Figs. 2 and 3). In addition, field-decontaminated CMDs extracted from the spatial regions where the excesses occur (Figs. 4-7), present statistically significant (Table 3) cluster CMDs.
5 Cluster age, reddening, and distance
The field-decontaminated CMD morphologies derived in Sect. 4 can be used to compute the cluster fundamental parameters.We work with Padova isochrones (Girardi et al. 2002) computed with the 2MASS , , and filters777http://stev.oapd.inaf.it/cgi-bin/cmd - Bolometric and colour corrections were computed for a set of isochrones using the 2MASS filter responses. The isochrones were subsequently provided in the Vega Mag system.. The updated isochrones are very similar to the Johnson-Kron-Cousins ones (e.g. Bessel & Brett 1988), with differences of at most 0.01 in (Bonatto, Bica & Girardi 2004). Distinctive features of the updated isochrone set are centred mostly on the greatly-improved treatment of the thermally-pulsing asymptotic giant branch (TP-AGB) phase. According to Marigo et al. (2008), the updated isochrones are intended to preserve the several peculiarities present in the TP-AGB tracks, namely, the cool tails of C-type stars due to the use of proper molecular opacities as convective dredge-up occurs along the TP-AGB, the bell-shaped sequences in the HR diagram for stars with hot-bottom burning, the changes of pulsation mode between fundamental and first overtone, the sudden changes of mean mass-loss rates as the surface chemistry changes from M- to C-type, etc. Because it is important to derive, or at least set constraints on astrophysical parameters of old star clusters, we adopt as working strategy the search for solutions within a range of ages and metallicities. As discussed by, e.g. Friel (1995), OC metallicities in general range from Solar (, or ) to sub-Solar (, , or Solar) values. According to the metallicity gradient (Fig. 7 in Friel 1995), the present OCs fall around the locus occupied by OCs with metallicity . Thus we base the following analysis on this most probable value. To compute Galactocentric distances, we adopt kpc (Bica et al. 2006) as the Sun’s distance to the Galactic centre. This value was derived by means of the GC spatial distribution888Other recent studies gave similar results, e.g. kpc (Eisenhauer et al. 2003), kpc (Eisenhauer et al. 2005) and kpc (Nishiyama et al. 2006), with different approaches..
Historically, different approaches have been used to extract astrophysical parameters from CMDs by means of isochrone fits. The simplest ones are based on a direct comparison of a set of isochrones with the CMD morphology, while the more sophisticated include photometric uncertainties, binarism, and variations on metallicity. Most of these methods are summarised in Naylor & Jeffries (2006), in which a maximum-likelihood CMD fit method is described.
For simplicity, in the present cases fits are made by eye, with the tight giant clumps as the strongest constraint. We also require that, because of the potential presence of binaries, the adopted isochrone should be shifted somewhat to the left of the MS fiducial line, i.e. a median line that takes into account the MS spread, including the photometric uncertainties as well (e.g. Bonatto, Bica & Santos Jr. 2005, and references therein). In the following Section we discuss each cluster individually.
5.1 FSR 1521
The decontaminated CMD morphology of FSR 1521 (Fig. 6) shows a concentration of stars at , which indicates a relatively populous MSTO of an old cluster detected near the 2MASS photometric limit. Besides, a distinctive red clump shows up at and . Taken together, these stellar sequences characterise a distant old OC.
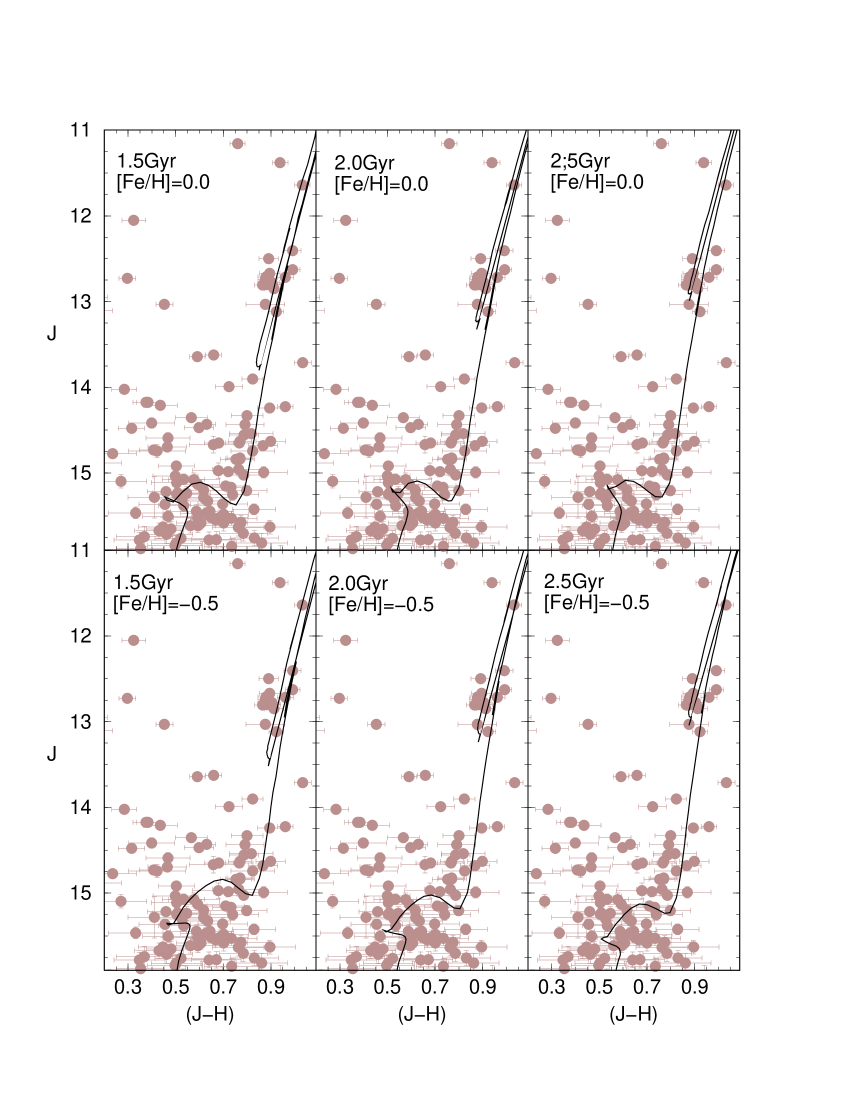
Allowing as well for the photometric uncertainties, acceptable fits to the decontaminated CMD morphology are obtained with the 2 Gyr isochrone, with an uncertainty of Gyr. This can be seen in Fig. 8, in which we compare solutions with the ages 1.5, 2, and 2.5 Gyr, both for Solar and sub-Solar () metallicities. Ages younger than about 1.5 Gyr would produce a significantly poorer description (much fainter than observed) of the red clump, while those older than about 2.5 Gyr, would be prohibitively shifted to the right of the MSTO. In any case, both metallicity ranges provide similar fits to the decontaminated morphology. Since the remaining OCs have ages (Table 2) and CMDs with photometric uncertainties similar to those of FSR 1521, the above test shows that any metallicity within would produce acceptable solutions. Thus, for simplicity and because the present OCs are relatively near the Solar circle, we adopt the Solar-metallicity isochrones as more probable solutions.
We caution that, because of the 2MASS photometric uncertainties for the lower sequences, a more sophisticated approach for isochrone fitting might produce an overinterpretation. For this reason, we apply the above method for all objects.
With the adopted solution, the fundamental parameters of FSR 1521 are the near-infrared reddening , which corresponds to , or , the observed and absolute distance moduli and , respectively, and the distance from the Sun kpc. Thus, for kpc, the Galactocentric distance of FSR 1521 is kpc, which puts it kpc outside the Solar circle. This solution is shown in Fig. 6 (bottom panels).
We call attention that the best fit takes into account strong constraints provided by the tight distribution of the clump giants, which preserves accuracy especially for the reddening and distance. Thus, the resulting uncertainties are adopted as the most probable errors, which are subsequently propagated to the different sets of parameters (Tables 2 and 4). However, given the uncertainties in the faint-photometric end, age is less constrained.
5.2 LK 1
The best-fit to the CMD of LK 1 was obtained with the 1 Gyr isochrone, and . Taking into account fit uncertainties we derive the age Gyr, , , , kpc, and kpc. LK 1 is kpc outside the Solar circle. This solution is shown in the bottom panels of Fig. 4. It represents well the MSTO, red clump and giant branch, in both colours. The few stars bluer than the MSTO might be blue stragglers or un-subtracted field stars. Our derived distance modulus is about 2 mags fainter than that adopted by Le Duigou & Knödlseder (2002).
5.3 LK 10
The decontaminated CMD morphology of LK 10 (Fig. 5) is somewhat more constrained than that of LK 1. Besides a tight red clump, it features about a 3 mag MS extent. Fundamental parameters of LK 10 are an age Gyr, , which corresponds to and , , , kpc, and kpc. LK 10 lies kpc inside the Solar circle. Our derived distance modulus agrees with that adopted by Le Duigou & Knödlseder (2002).
With kpc, LK 10 might be spatially coincident with the Cygnus Association. However, they must not share a common origin, since LK 10 is much older than the estimated age of the Cygnus Association, 1-4 Myr (e.g. Massey, Johnson & DeGioia-Eastwood 1995). Despite the different distances, LK 1 and LK 10 are affected essentially by the same reddening value.
5.4 FSR 1555
With the MSTO and red clump detected in the decontaminated CMD of FSR 1555 (Fig. 7), we derive an age Gyr, , which corresponds to and , , , kpc, and kpc. FSR 1555 lies kpc inside the Solar circle.
6 Cluster structure
Structural parameters are derived by means of the projected radial density profiles (RDP) built with the stellar number density around the cluster centre. Usually, star clusters have RDPs that follow a well-defined analytical profile. Among these are the empirical, single mass, modified isothermal sphere of King (1966), the modified isothermal sphere of Wilson (1975), which assumes a pre-defined stellar distribution function (and produces more extended envelopes than King 1966), and the power law with a core of Elson, Fall & Freeman (1987). These functions are characterised by different parameters that are related to cluster structure. However, considering the error bars of the present RDPs (Fig. 9), we adopt the analytical function , where is the residual background density, is the central density of stars, and is the core radius. This function is similar to that introduced by King (1962) to describe the surface brightness profiles in the central parts of globular clusters. As discussed in Bonatto & Bica (2008a), RDPs built with depth-limited photometry produce structural radii comparable to the intrinsic (i.e. derived with deep photometry) ones.
| Cluster | ||||||||||||
|---|---|---|---|---|---|---|---|---|---|---|---|---|
| (′) | (′) | (′) | (pc) | (pc) | (pc) | (pc) | ||||||
| (1) | (2) | (3) | (4) | (5) | (6) | (7) | (8) | (9) | (10) | (11) | (12) | (13) |
| LK 1 | 1.163 | |||||||||||
| LK 10 | — | 0.444 | — | |||||||||
| FSR 1521 | — | 1.302 | — | |||||||||
| FSR 1555 | — | 1.197 | — |
-
Core (), cluster (), and tidal () radii are given in angular and absolute units. Col. 7: cluster/background density contrast parameter (), measured in the colour-magnitude filtered RDPs. Col. 8: arcmin to parsec scale.
To minimise noise in the RDPs, we first apply a colour-magnitude filter to the photometry, which excludes stars with colours unlike those of the cluster sequence. Colour-magnitude filters are wide enough to include cluster MS and evolved star colour distributions, as well as the photometric uncertainties999Colour-magnitude filter widths should also account for formation or dynamical evolution-related effects, such as enhanced fractions of binaries (and other multiple systems) towards the central parts of clusters, since such systems tend to widen the MS (e.g. Hurley & Tout 1998; Kerber et al. 2002; Bonatto & Bica 2007a; Bonatto, Bica & Santos Jr. 2005).. The colour-magnitude filters for the present OCs are shown in the bottom-left panels of Figs. 4-7. However, residual field stars with colours similar to those of the cluster are expected to remain inside the colour-magnitude filter. They affect the intrinsic stellar RDP in a way that depends on the relative densities of field and cluster stars. The contribution of the residual contamination to the observed RDP is statistically subtracted by means of the field. As a result, the use of colour-magnitude filters enhances the contrast of the RDP with respect to the background, especially in crowded fields (e.g. Bonatto & Bica 2007a).
Oversampling near the centre and undersampling at large radii are avoided by using rings of increasing width with distance from the cluster centre. A typical set of ring widths is , respectively for , , , and . The number and width of the rings can be set to produce RDPs with adequate spatial resolution and small Poisson errors. The residual background level of each RDP corresponds to the average number of colour-magnitude filtered stars measured in the field. The coordinate (and uncertainty) of each ring corresponds to the average position and standard deviation of the stars inside the ring.
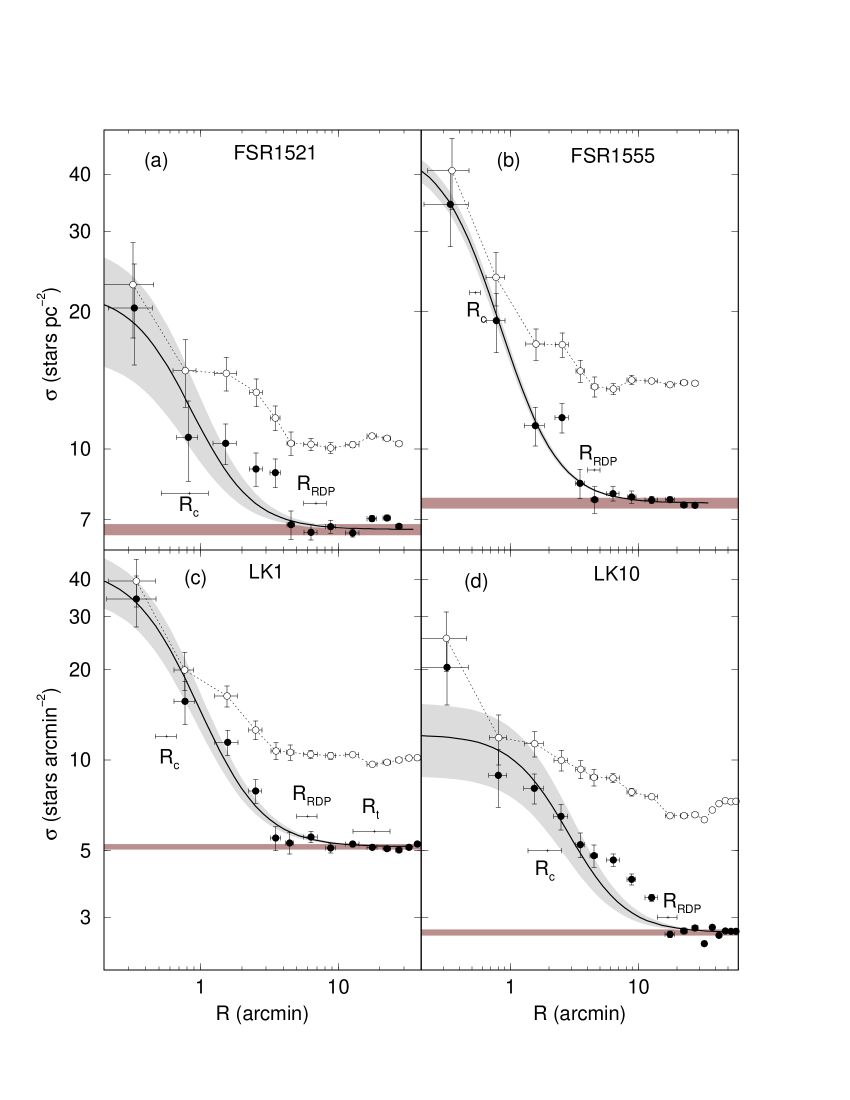
The colour-magnitude filtered RDPs of the present clusters are shown in Fig. 9, where we also show the profiles produced with the observed (raw) photometry. As expected, minimisation of the number of non-cluster stars by the colour-magnitude filter resulted in RDPs with higher contrast with respect to the background. Fits of the King-like profile were performed with a non-linear least-squares fit routine that uses errors as weights. To minimise degrees of freedom, and were derived from the RDP fit, while is measured in the field. The best-fit solutions are shown in Fig. 9, and the fit parameters are given in Table 4. For absolute comparison with other clusters, Table 4 also presents parameters in absolute units, based on the cluster distances (Sect. 5). Because of the 2MASS photometric limit, which for the present clusters corresponds to a cutoff for stars brighter than , should be taken as a lower limit.
Within uncertainties, the adopted King-like function describes well the colour-magnitude filtered RDPs along the full radius range, especially for LK 1, FSR 1521, and FSR 1555. The exception is LK 10, which shows a marked excess in the central region. This central cusp in LK 10 suggests a post-core collapse phase in this Gyr OC, as detected in part of the globular clusters (e.g. Trager, King & Djorgovski 1995). Such a central cusp has been observed in the RDP of other OCs, such as NGC 3960 (Bonatto & Bica 2006).
We also estimate the cluster radius () by visually comparing the RDP level (and fluctuations) with the background. It corresponds to the distance from the cluster centre where RDP and background are statistically indistinguishable (e.g. Bonatto & Bica 2005, and references therein). Thus, most of the cluster stars are contained within , which should not be mistaken for the tidal radius. Tidal radii are derived from, e.g. the 3-parameter King-profile fit to RDPs (see below), which requires large surrounding fields and adequate Poisson errors. For instance, in populous and relatively high Galactic latitude OCs such as M 67, NGC 188, and NGC 2477, cluster radii are a factor of the respective tidal radii (Bonatto & Bica 2005). The factor is somewhat lower for low-Galactic latitude objects, because of the enhanced background. The cluster radii of the present objects are given in cols. 5 (angular scale) and 12 (absolute scale) of Table 4.
Table 4 (col. 7) provides the density contrast parameter , which, for the present clusters is relatively high (). Since is measured in colour-magnitude-filtered (lower noise) RDPs, it is usually higher than the visual contrast produced by images (e.g. Fig. 1).
Alternatively, we tried to fit the RDPs with the 3-parameter function (based on King 1962)
which includes the tidal radius (). However, convergence occurred only for LK 1, with . With such radii, the concentration parameter of LK 1 is which, compared to the Galactic (non-core collapse) globular clusters, puts it around the median value (e.g. Bonatto & Bica 2008b). Qualitatively, the 3-parameter fit to the RDP of LK 1 is indistinguishable to that shown in Fig. 9, within the uncertainties. Thus, we simply show in panel (c) the position of the tidal radius.
Interestingly, the cluster radii of LK 1 and LK 10 given by Le Duigou & Knödlseder (2002) are about half those derived in this work. This probably occurs because we work with colour-magnitude-filtered RDPs, which enhances the cluster/background contrast and probes larger cluster extensions. With respect to FSR 1521 and FSR 1555, our values for the core radius are about of those given by Froebrich, Scholz & Raftery (2007), while our is consistent with their , given the above relation between both radii.
Compared to the distribution of core radius derived for a sample of relatively nearby OCs by Piskunov et al. (2007), the present OCs, especially FSR 1521, occupy the small- tail. Besides, for a relation between tidal and cluster radius as , LK 10, FSR 1521, and FSR 155 are located around the median value, while LK 1 occupies the large- tail.
7 Mass estimates
Since we detect mags of the MS of LK 10, we can build its mass function and compute the mass stored in stars. We work with colour-magnitude filtered photometry, the 3 2MASS bands separately, and the mass-luminosity relation obtained from the corresponding Padova isochrone and distance from the Sun (Sect. 5). Further details on MF construction are given in Bica, Bonatto & Blumberg (2006). The effective MS stellar mass range is .
The MF of LK 10 is well represented by the function , with the slope . Within uncertainties, this slope agrees with derived by Le Duigou & Knödlseder (2002). Both values are steeper than the of Salpeter (1955) initial mass function (IMF).
The number of observed MS and evolved stars in LK 10 (for ) is derived by counting the stars (in the background-subtracted colour-magnitude filtered photometry) that are present in the mag ranges, for the MS and for the evolved stars. There are and , MS and evolved stars, respectively; the corresponding mass values are and . The evolved star mass corresponds to multiplied by the stellar mass at the TO, . Thus, the observed stellar mass of LK 10 is , which agrees with the equivalent value estimated by Le Duigou & Knödlseder (2002).
Finally, we estimate the total stellar mass by extrapolating the observed MF down to the H-burning mass limit (). We follow the universal IMF of Kroupa (2001), which assumes increasing flattening towards low-mass stars. This IMF is described by the slopes for the range and for . We obtain . Thus, the stellar mass of LK 10 can be put in the range . Again, within uncertainties, the upper value is consistent with that estimated by Le Duigou & Knödlseder (2002).
Because of the limited MS range, only estimates of the observed cluster mass are made for the remaining objects, by means of the age solutions given in Sect. 5. In all cases we consider the region within (Table 4). For LK 1 we derive and , which leads to the total observed mass . This value corresponds to about of the estimate given by Le Duigou & Knödlseder (2002). The values for FSR 1555 are , , and . Since FSR 1555 and LK 1 are approximately at the same distance from the Sun, the latter appears to be somewhat more massive than the former.
With the more probable solution (2 Gyr) for FSR 1521, the total number of stars present in CMD is , of which are in the red clump and in the MSTO. Thus, for a MSTO mass of , the observed mass of FSR 1521 is , of which correspond to the evolved stars, and are stored in the red clump. Interestingly, while the observed mass of FSR 1521 is similar to that of FSR 1555, the evolved mass is somewhat lower. Since both OCs are at comparable distances, this difference is consistent with the relative ages.
The fact that LK 1, FSR 1521, and FSR 155 present similar observed masses as LK 10, suggest that they all might be as massive as the latter OC.
Given the accuracy of the isochrone best-fit for old OCs provided by near-infrared decontaminated CMDs, e.g. Fig. 8 and related discussions, the observed masses are expected to be representative. Of course, deeper near-infrared photometry coupled to similar methods as the present one, and/or including proper motion filtering, would produce more constrained results.
8 Discussion
With the analyses of the preceding sections we have gathered important clues to establish that the objects dealt with in this paper are Gyr-class OCs, or older. We also derived representative, i.e. constrained by means of the isochrone fit (Sect. 5), fundamental and structural parameters, most of which have been derived for the first time. We use these parameters to put the clusters into perspective, by comparing some of their properties with those of a set of well-studied OCs.
As reference we take the nearby OCs with ages in the range Myr and masses within studied by Bonatto & Bica (2005), together with the young OCs NGC 6611 (Bonatto, Santos Jr. & Bica 2006) and NGC 4755 (Bonatto et al. 2006b). The reference clusters are distinguished according to total mass (higher or lower than 1 000 ). Bonatto & Bica (2005) discuss parameter correlations in the reference sample.
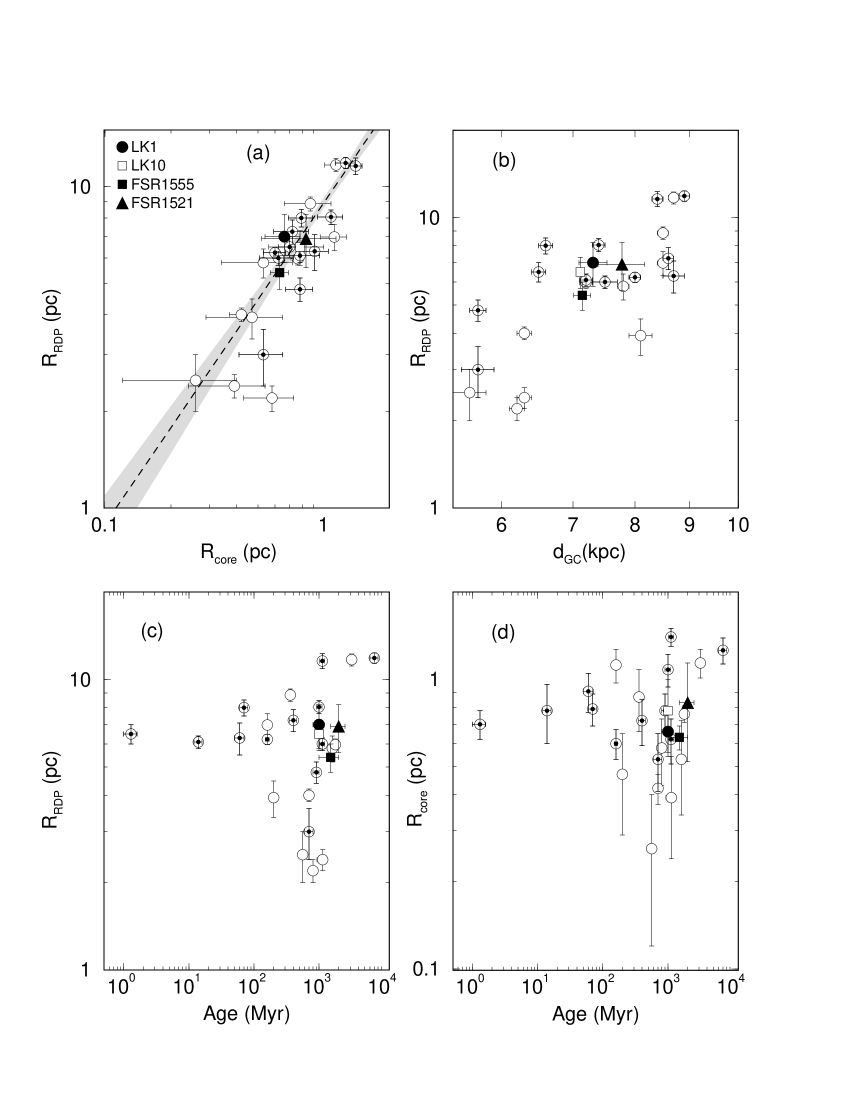
As shown in panel (a) of Fig. 10, the core and cluster radii of the reference OCs are related by , which suggests a similar scaling for both kinds of radii, at least for the radii ranges and . LK 1, LK 10, FSR 1521, and FSR 1555 fit tightly in the relation. They also appear to follow the trend of increasing cluster radii with Galactocentric distance (panel b). This kind of dependence was previously suggested by, e.g. Lyngå (1982). Part of this relation may be primordial, in the sense that the higher molecular gas density in central Galactic regions may have produced clusters with small radii, as suggested by van den Bergh, Morbey & Pazder (1991) to explain the increase of globular cluster radii with Galactocentric distance. After formation, mass loss associated with stellar and dynamical evolution (such as mass segregation and evaporation), together with tidal interactions with the Galactic potential and giant molecular clouds, also contribute to the depletion of star clusters, especially the low-mass and centrally located ones (Sect. 1). A similar dependence on Galactocentric distance for is implied by the data shown in panel (a).
In panels (c) and (d) of Fig. 10 we compare the presently derived cluster and core radii with those of the reference sample in terms of age. LK 1, LK 10, FSR 1521, and FSR 1555 have core and cluster radii similar to those measured in the reference OCs of equivalent age.
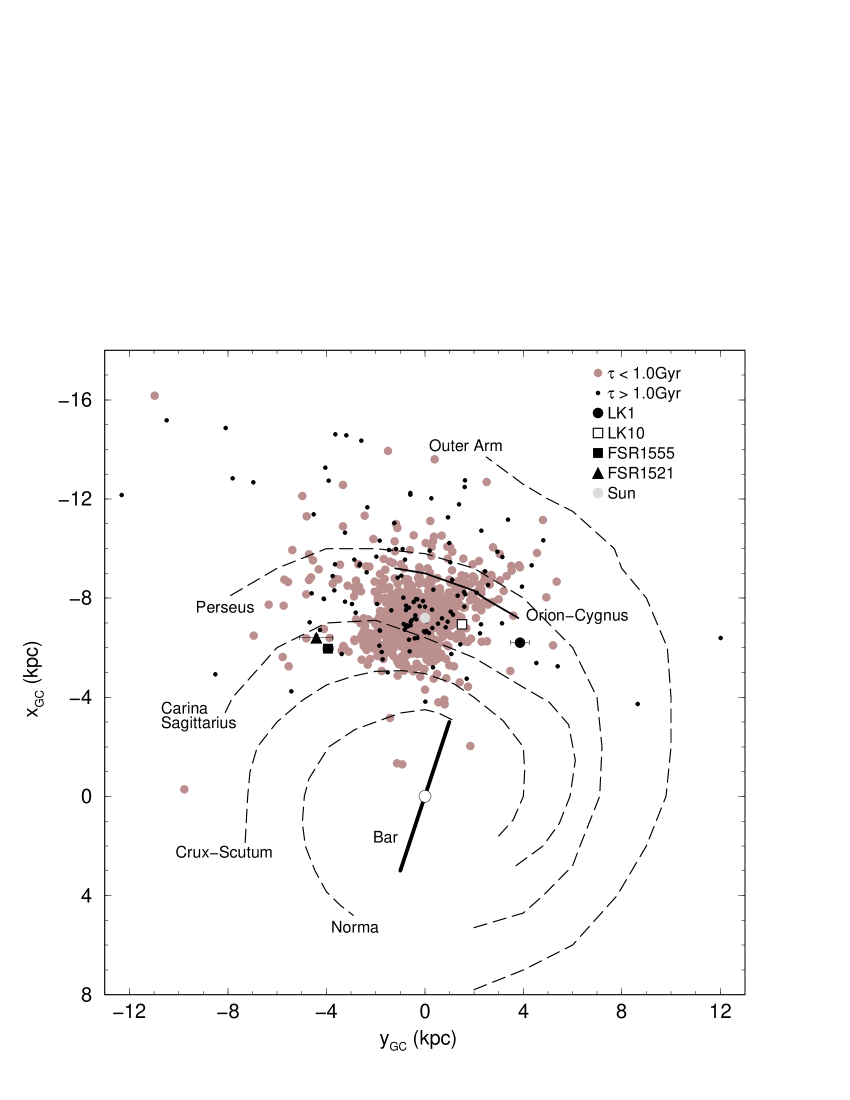
We show in Fig. 11 the spatial distribution of LK 1, LK 10, FSR 1521, and FSR 1555, as they lay in the Galactic plane. The spiral arm structure of the Milky Way is based on Momany et al. (2006) and Drimmel & Spergel (2001), as derived from HII regions, and molecular clouds (e.g. Russeil 2003). The Galactic bar is shown with an orientation of 14° and 6 kpc in total length (Freudenreich 1998; Vallée 2005). The present OCs are compared to the spatial distribution of the OCs with known age given in the WEBDA database. For comparison purposes we consider two age groups, clusters younger and older than 1 Gyr (the old OCs listed in Table 1 are merged into this group). As expected, old OCs are found preferentially outside the Solar circle, while the inner Galaxy contains few OCs so far detected. Besides, because of the presence of bright stars, young OCs can be detected farther than the old ones, especially towards the central region. As discussed in Bonatto et al. (2006a), central directions farther than kpc begin to be critically affected by incompleteness (due to crowding and high backround levels) and enhanced disruption rates, while the drop in the number of OCs towards the opposite direction appears to be mostly real. Also, all directions show depletion in the number of detected OCs farther than kpc. Considering the overall distribution, the pairs LK 1 and LK 10, and FSR 1521 and FSR 1555 probe basically unexplored regions, in opposite directions. FSR 1555, and especially FSR 1521, are located close to the Carina-Sagittarius Arm. LK 1 and LK 10 are found between the Carina-Sagittarius and Orion-Cygnus arms.
9 Summary and conclusions
Accurate fundamental and structural parameters of old star clusters are important for reasons that range from the completeness of the open cluster parameter space to the determination of the efficiency of cluster dissolution mechanisms. Taken together, the results of the present paper, and those of previous works by our group (Table 1), add to a total of 18 old (age Gyr) open clusters with reliable101010In the context discussed in Sect. 5, with uncertainties propagated from the best-fitting 2MASS isochrones. parameters derived, for the first time for most of them. New findings and the age-determination within a reasonable confidence level are important as well to improve the statistical coverage of the open cluster databases, especially for the definition of the old-age tail of the open cluster age-distribution function.
In this paper we use colour-magnitude diagrams and radial density profiles to derive fundamental and structural parameters of the infrared open clusters LK 1 and LK 10, as well as of the star cluster candidates FSR 1521, and FSR 1555. Our approach is essentially based on field-star decontaminated 2MASS photometry, which enhances cluster CMD evolutionary sequences, and produces more constrained parameters.
We present consistent evidence, in the form of CMD morphology, statistical tests, structural parameters, and comparison with nearby OCs, that the objects are Gyr-class open clusters. With absorptions in the range , the objects are well suited for the 2MASS photometry. They are located at kpc from the Sun, except for the relatively nearby LK 10, which is at kpc. The 4 clusters are within kpc from the Solar circle. The old ages of LK 1 and LK 10 (and the distance of the former) preclude a common origin with the Cygnus Association. With a mass function slope () somewhat steeper than Salpeter’s (), LK 10 is relatively massive, with a total mass within . The remaining clusters present CMD morphology and observed mass (within ) similar to those of LK 10, which suggests that they may be old clusters as massive as LK 10. This is consistent especially with the relatively well-populated red clumps.
Structurally, LK 1, FSR 1521, and FSR 1555 are characterised by core and cluster radii similar to those of a sample of nearby open clusters of comparable age. This is consistent with the fact that, because they are relatively close to the Solar circle, they suffer similar tidal stresses. LK 10, on the other hand, presents evidence of post-core collapse, a structure already observed in other old OCs, such as NGC 3960 (Bonatto & Bica 2006).
Finally, we note that systematic searches in catalogues of star cluster candidates, coupled with an efficient field-star decontamination algorithm, can provide important additions the the known population of open clusters, old ones in particular.
Acknowledgements
The anonymous referee is acknowledged for a thorough reading of the original manuscript and for valuable suggestions that improved the paper. This publication makes use of data products from the Two Micron All Sky Survey, which is a joint project of the University of Massachusetts and the Infrared Processing and Analysis Centre/California Institute of Technology, funded by the National Aeronautics and Space Administration and the National Science Foundation. This research has made use of the WEBDA database, operated at the Institute for Astronomy of the University of Vienna. We acknowledge support from the Brazilian Institution CNPq.
References
- Alessi, Moitinho & Dias (2003) Alessi, B.S., Moitinho, A. & Dias, W. S. 2003, A&A, 410, 565
- Baumgardt & Makino (2003) Baumgardt, H. & Makino, J. 2003, MNRAS, 340, 227
- van den Bergh (1957) van den Bergh, S. 1957, ApJ, 125, 445
- van den Bergh, Morbey & Pazder (1991) van den Bergh, S., Morbey, C. & Pazder, J. 1991, ApJ, 375, 594
- Bessel & Brett (1988) Bessel, M.S. & Brett, J.M. 1988, PASP, 100, 1134
- Bica, Bonatto & Dutra (2003) Bica, E., Bonatto, C. & Dutra, C. 2003, A&A, 405, 991
- Bica et al. (2006) Bica, E., Bonatto, C., Barbuy, B. & Ortolani, S. 2006, A&A, 450, 105
- Bica, Bonatto & Blumberg (2006) Bica, E., Bonatto, C. & Blumberg, R. 2006, A&A, 460, 83
- Bica et al. (2007) Bica, E., Bonatto, C., Ortolani, S. & Barbuy, B. 2007, A&A, 472, 483
- Bica & Bonatto (2008) Bica, E. & Bonatto, C. 2008, MNRAS, 384, 1733
- Bica, Bonatto & Camargo (2008) Bica, E., Bonatto, C. & Camargo, D. 2008, MNRAS, 385, 349
- Bonatto, Bica & Girardi (2004) Bonatto, C., Bica, E. & Girardi, L. 2004, A&A, 415, 571
- Bonatto, Bica & Santos Jr. (2005) Bonatto, C., Bica, E. & Santos Jr., J.F.C. 2005, A&A, 433, 917.
- Bonatto & Bica (2005) Bonatto, C. & Bica, E. 2005, A&A, 437, 483
- Bonatto, Santos Jr. & Bica (2006) Bonatto, C., Santos Jr., J.F.C. & Bica, E. 2006, A&A, 445, 567
- Bonatto et al. (2006a) Bonatto, C., Kerber, L.O., Bica, E. & Santiago, B.X. 2006a, A&A, 446, 121
- Bonatto et al. (2006b) Bonatto, C., Bica, E., Ortolani, S. & Barbuy, B. 2006b, A&A, 453, 121
- Bonatto & Bica (2006) Bonatto, C. & Bica, E. 2006, A&A, 455, 931
- Bonatto & Bica (2007a) Bonatto, C. & Bica, E. 2007a, MNRAS, 377, 1301
- Bonatto et al. (2007) Bonatto, C., Bica, E., Ortolani, S. & Barbuy, B. 2007, MNRAS, 381, L45
- Bonatto & Bica (2007b) Bonatto, C. & Bica, E. 2007b, A&A, 473, 445
- Bonatto & Bica (2008a) Bonatto, C. & Bica, E. 2008a, A&A, 477, 829
- Bonatto & Bica (2008b) Bonatto, C. & Bica, E. 2008b, A&A, 479, 741
- Bonatto & Bica (2008c) Bonatto, C. & Bica, E. 2008c, A&A, 485, 81
- Bonatto, Bica & Santos Jr. (2008) Bonatto, C., Bica, E. & Santos Jr., J.F.C. 2008, MNRAS, 386, 324
- Bonatto & Bica (2008d) Bonatto, C. & Bica, E. 2008d, A&A, accepted (astro-ph/0809.2492)
- Cardelli, Clayton & Mathis (1989) Cardelli, J.A., Clayton, G.C. & Mathis, J.S. 1989, ApJ, 345, 245
- Drimmel & Spergel (2001) Drimmel, R., & Spergel, D.N. 2001, ApJ, 556, 181
- Le Duigou & Knödlseder (2002) Le Duigou, J.M. & Knödlseder, J. 2002, A&A, 392, 869
- Dutra & Bica (2001) Dutra, C.M. & Bica, E. 2001, A&A, 376, 434
- Dutra, Santiago & Bica (2002) Dutra, C.M., Santiago, B.X. & Bica, E. 2002, A&A, 383, 219
- Eisenhauer et al. (2003) Eisenhauer, F., Schödel, R, Genzel, R., Ott, T., Tecza, M., Abuter, R., Eckart, A. & Alexander, T. 2003, ApJ, 597, L121
- Eisenhauer et al. (2005) Eisenhauer, F., Genzel, R., Alexander, T. et al. 2005, ApJ, 628, 246
- Elson, Fall & Freeman (1987) Elson, R.A.W., Fall, S.M. & Freeman, K.C. 1987, ApJ, 323, 54
- Freudenreich (1998) Freudenreich, H.T. 1998, ApJ, 492, 495
- Friel (1995) Friel, E.D. 1995, ARA&A 1995, 33, 381
- Froebrich, Scholz & Raftery (2007) Froebrich, D., Scholz, A. & Raftery, C.L. 2007, MNRAS, 374, 399
- Froebrich, Meusinger & Scholz (2007) Froebrich, D., Meusinger, H. & Scholz, A. 2007, MNRAS, 377, L54
- Froebrich, Meusinger & Davis (2007) Froebrich, D., Meusinger, H. & Davis, C.J. 2008, MNRAS, 383, L45
- Girardi et al. (2002) Girardi, L., Bertelli, G., Bressan, A., et al. 2002, A&A, 391, 195
- Goodwin & Bastian (2006) Goodwin, S.P. & Bastian, N. 2006, MNRAS, 373, 752
- von Hoerner (1958) von Hoerner, S. 1958, Astrophys., 44, 221
- Hurley & Tout (1998) Hurley, J. & Tout, A.A. 1998, MNRAS, 300, 977
- Janes & Phelps (1994) Janes, K.A. & Phelps, R.L. 1994, AJ, 108, 1773
- Kerber et al. (2002) Kerber, L.O., Santiago, B.X., Castro, R. & Valls-Gabaud, D. 2002, A&A, 390, 121
- Khalisi, Amaro-Seoane & Spurzem (2007) Khalisi, E., Amaro-Seoane, P. & Spurzem, R. 2007, MNRAS, 374, 703
- King (1962) King, I. 1962, AJ, 67, 471
- King (1966) King, I. 1966, AJ, 71, 64
- Kroupa (2001) Kroupa, P. 2001, MNRAS, 322, 231
- Lamers & Gieles (2006) Lamers, H.J.G.L.M. & Gieles, M. 2006, A&AL, 455, 17
- Lyngå (1982) Lyngå, G. 1982, A&A, 109, 213
- Marigo et al. (2008) Marigo, P., Girardi, L., Bressan, A., Groenewegen, M.A.T., Silva, L. & Granato, G.L. 2008, A&A, 482, 883
- Massey, Johnson & DeGioia-Eastwood (1995) Massey, P., Johnson, K.E. & DeGioia-Eastwood, K. 1995, ApJ, 454, 151
- Mercer et al. (2005) Mercer, E.P., Clemens, D.P., Meade, M.R., Babler, B.L., Indebetouw, R., Whitney, B.A., Watson, C., Wolfire, M.G. et al. 2005, ApPJ, 6335, 560
- Momany et al. (2006) Momany, Y., Zaggia, S., Gilmore, G., Piotto, G., Carraro, G., Bedin, L.R. & de Angeli, F. 2006, A&A, 451, 515
- Momany et al. (2008) Momany, Y., Bica, E., Barbuy, B., Ortolani, S. & Bonatto, C. MNRAS, 2008, submitted
- Naylor & Jeffries (2006) Naylor, T. & Jeffries, R.D. 2006, MNRAS, 373, 1251
- Nishiyama et al. (2006) Nishiyama, S., Nagata, T., Sato, S. et al. 2006, ApJ, 647, 1093
- Oort (1958) Oort, J.H. 1958, in Ricerche Astronomiche, 5, 415, Specola Vaticana, Proc. of a Conference at Vatican Observatory, Castel Gandolfo, May 20-28, 1957, ed. D.J.K. O’Connell
- Ortolani et al. (2005) Ortolani, S., Bica, E., Barbuy, B. & Zocalli, M. 2005, A&A, 439, 1135
- Ortolani, Bica & Barbuy (2005) Ortolani, S., Bica, E. & Barbuy, B. 2005, A&A, 437, 531
- Pavani & Bica (2007) Pavani, D.N. & Bica, E. 2007, MNRAS, 468, 139
- Piskunov et al. (2007) Piskunov, A.E., Kharchenko, N.V., Röser, S., Schilbach, E. & Scholz, R.-D. 2007, A&A, 445, 545
- Portegies Zwart et al. (2002) Portegies Zwart, S.F., Makino, J., McMillan, S.L.W. & Hut, P. 2002, ApJ, 565, 265
- Richer et al. (2008) Richer, H.B., Dotter, A., Hurley, J., Anderson, J., King, I., Davis, S., Fahlman, G.G. Hansen, B.M.S. et al. 2008, AJ, 135, 2141
- Russeil (2003) Russeil, D. 2003, A&A, 397, 133
- Salaris, Weiss & Percival (2004) Salaris, M., Weiss, A. & Percival, S.M. 2004,A&A, 422, 217
- Salpeter (1955) Salpeter, E. 1955, ApJ, 121, 161
- Skrutskie et al. (1997) Skrutskie, M., Schneider, S.E., Stiening, R., et al. 1997, in The Impact of Large Scale Near-IR Sky Surveys, ed. Garzon et al., Kluwer (Netherlands), 210, 187
- Spitzer (1958) Spitzer, L. 1958, ApJ 127, 17
- Trager, King & Djorgovski (1995) Trager, S.C., King, I.R. & Djorgovski, S. 1995, AJ, 109, 218
- Upgren, Mesrobian & Kerridge (1972) Upgren, A.R., Mesrobian, W.S. & Kerridge, S.J. 1972, AJ, 77, 74
- Vallée (2005) Vallée, J.P. 2005, AJ, 130, 569
- Wilson (1975) Wilson, C.P. 1975, AJ, 80, 175