Dichotomy in the Dynamical Status of Massive Cores in Orion
Abstract
To study the evolution of high mass cores, we have searched for evidence of collapse motions in a large sample of starless cores in the Orion molecular cloud. We used the Caltech Submillimeter Observatory telescope to obtain spectra of the optically thin (H13CO+) and optically thick (HCO+) high density tracer molecules in 27 cores with masses 1 M⊙. The red- and blue-asymmetries seen in the line profiles of the optically thick line with respect to the optically thin line indicate that 2/3 of these cores are not static. We detect evidence for infall (inward motions) in 9 cores and outward motions for 10 cores, suggesting a dichotomy in the kinematic state of the non-static cores in this sample. Our results provide an important observational constraint on the fraction of collapsing (inward motions) versus non-collapsing (re-expanding) cores for comparison with model simulations.
1 INTRODUCTION
In giant molecular clouds, the formation of massive cold molecular cores can be induced by gravoturbulent cloud fragmentation (c.f. Mac Low & Klessen 2004). McKee & Tan (2003) envisage that these cores are molecular condensations in a turbulence-supported quasi-equilibrium state, which ultimately form a single protostar or a gravitationally bound cluster of massive protostars. This important stage in star formation is not well understood due to lack of observational data on prestellar cores on the verge of collapse. To study this stage we obtained new data on the kinematic state for a sizable number of Orion cores. Li et al. (2007, Paper II) identified 51 dust cores in a 350 m submillimeter continuum survey of the quiescent regions of the Orion molecular cloud using the SHARC II camera at the Caltech Submillimeter Observatory (CSO). A combination of the enhanced spatial resolution analysis of the submm data using the HiRes deconvolution tool (see Velusamy et al. 2008) and our knowledge of the temperature from the ammonia mapping by Li et al. (2003, Paper I) enabled us to determine relatively accurately the key physical parameters (including size and mass) of cores in this representative sample of starless cores in a high mass star forming cloud. This Orion core sample is a collection of resolved or nearly resolved cores, with a mean mass of 9.8 M⊙, which is 1 order of magnitude higher than that of resolved cores in low-mass star-forming regions. The majority of the cores appear to be too massive to be thermally supported as Bonner-Ebert spheres for TK 30K (Paper II), or even with turbulence 1.5 km s-1 (for reference the mean linewidth observed in these cores is 0.78 km s-1). Therefore, magnetic support may be important in these cores (c.f. Mouschovias, 1991). Here we present new spectroscopic observations to determine the kinematics of these cores. We discuss the prevalence of dynamically unstable high mass cores in this sample and the equally large proportion of cores showing either collapse or expansion.
2 Observations
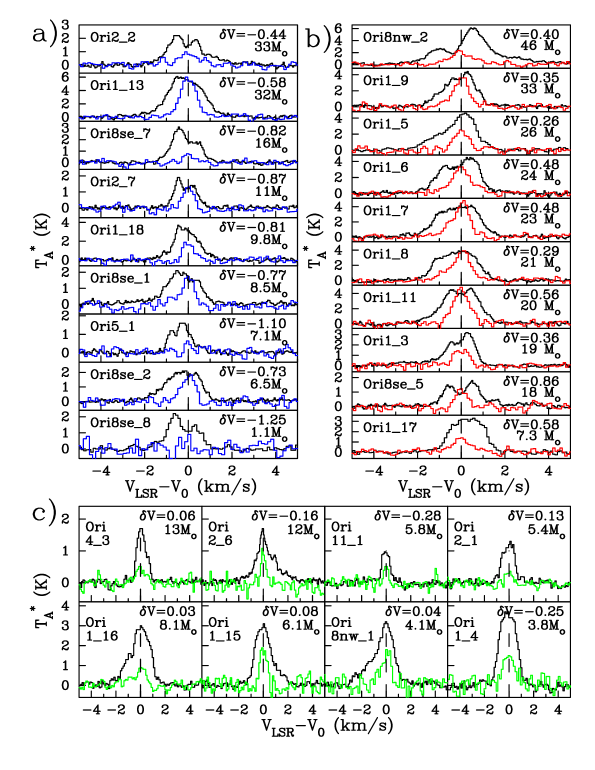
We selected a subset of 27 cores from the sample in Paper II which have mass 1 M⊙. The observations were made at the 10.4 m telescope of the Caltech Submillimeter Observatory (CSO) at Mauna Kea, Hawaii, in March and December, 2007. The cores and their coordinates were selected from Table 1 in Paper II. We observed both HCO+(3-2) at 267.557620 GHz, and H13CO+(3-2) at 260.255478 GHz in all 27 cores. We used the 230 GHz band heterodyne receiver and the 1024 channel acousto-optic spectrometer with a bandwidth of 50 MHz. The FWHM antenna beam was 26 and the main beam efficiency was 0.66. To improve the SNR on the optically thin H13CO+(3-2) spectra, 3 adjacent velocity channels were coadded. The velocity and line width for each core were obtained using Gaussian profile fit to the optically thin H13CO+(3-2) lines. The spectra of all 27 cores are shown in Figure 1. The spectra of the cores are presented in three groups as a function of their asymmetry (see Section 3) in the HCO+ line with: (a) blue shifted peak emission, (b) red shifted peak emission, and (c) no significant asymmetry with respect to the H13CO+ spectrum. The spectra within each group are arranged in order of their masses.
For most of the cores the line widths for H13CO+ are 0.5 km s-1 and appear to be dominated by turbulence compared to HCO+ thermal line widths 0.2 km s-1 for TK 20 K. Thus the majority of our cores are supersonic. Using the total linewidth as an upper limit of the equivalent sound speed we estimated approximate Bonnor-Ebert (B-E) critical mass (MB-E) for each core (see Paper II). Only 3 cores have masses within a factor 2.5 of their critical masses while the other cores all have masses well above their critical masses for stability.
3 Results and Discussion
To study the kinematic status of the cores we use the spectral line asymmetry as observed between a pair of optically thick and thin molecular transitions. We define the red- and blue- asymmetry by the peak emission in the optically thick line appearing red-ward and blue-ward, respectively, with respect to the peak in the optically thin spectrum. The method of spectral line asymmetry (Leung & Brown 1977; Zhou et al. 1992) has commonly been used to identify collapse candidates. Under certain assumed collapse conditions (e.g. Shu et al. 1987) an optically thick line (e.g. HCO+(3-2)) in a collapsing core shows a blue-asymmetry in the line profile observed toward the collapse center, while an optically thin line (e.g. H13CO+(3-2)) appears symmetric. Gregersen et al. (1997) have used the same pair of lines to search for infall in 19 low mass cores. They detected blue-asymmetry in 9 Class 0 objects, and red-asymmetry in 2 objects. Using the HCO+(3-2) line as the optically thick tracer, in their search for infall candidates in low mass cores, Mardones et al. (1997) detected blue-asymmetry in 8, red asymmetry in 3, and found one (VLA 1623) to be inconclusive. Fuller et al. (2005) observed 77 submillimeter sources associated with a sample of IRAS selected objects, all believed to be high mass protostellar objects. They identified 22 infall candidates none of which show any red-asymmetry. Thus red-asymmetries are rare in low mass cores (c.f. Lee et al. 2001) as well as in high mass cores containing protostars and the few cores showing red asymmetries are caused by outflows (Gregersen et al. 1997). In contrast, in our Orion sample of high mass starless cores (not containing any known protostars) approximately 2/3 show blue- or red-asymmetries, roughly in equal numbers.
In principle, information on the velocity structure v(r) within the core is contained in the line profile averaged over the core. In the spectra shown in Figure 1, the line-of-sight motions within the core produce Doppler shifts and features in the line profiles averaged over the core. A static spherical core displays a symmetric spectral line profile for low optical depths. At large optical depths it exhibits a self-absorption dip at the center with symmetric blue and red peaks. Radial variations in physical conditions, e.g. temperature, density, molecular abundances, line widths, do not affect the symmetry of the observed spectrum relative to the central velocity of the core. By looking at whether the line emission is stronger in the red or blue, one can distinguish between infall and expansion in the core (Leung & Brown, 1977; Zhou et al. 1993). Schematically, in the case of radial infall the red and blue emissions come from, respectively, the hemispheres closer to and farther from the observer. If the excitation temperature (Tex) decreases radially outward from the core center, as expected for HCO+(3-2), the line-of-sight from the observer at red shifted frequencies first encounters cooler gas (at greater distance from the core center), while at blue shifted frequencies warmer gas (closer to the core center) is encountered first. Therefore, subject to the caveat on the velocity field discussed below, the blue emission is stronger than the red, producing a blue-asymmetry. In the case of radial expansion of the core the blue and red hemispheres are reversed and the red emission is stronger, resulting in a red-asymmetry.
The effects of the self-absorption on the red or blue peaks of the spectrum depends critically on the velocity field as a function of radius. There is no self-absorption in the peaks if v(r) r, as every line-of-sight velocity component corresponds to a single point along the line-of-sight. However, for a velocity field having a power law with negative index, for example, v(r) r-0.5, as in the case of inside-out collapse model (Shu et al. 1987), every line-of-sight velocity component corresponds to two points at different distances from the core center (see Fig. 8 in Zhou et al. 1993). Thus this velocity law favors a stronger self-absorption in the red as the two iso-velocity points in the red hemisphere correspond to a high and low Tex, respectively, farther and closer to the observer (see above). To produce the red- and blue-asymmetries by self-absorption, we require a favorable radial variation of not only velocity, v(r) but also excitation temperature, Tex(r). In a region where the HCO+ emission is produced, the excitation of HCO+ (3-2) is subthermal and is dominated by the radial increase in density towards the core center. Thus Tex(r) will always increase radially toward the center essentially independent of the temperature profile (Paper I). LVG model calculations show that such conditions in a family of model clouds with density 105 - 106 cm-3 and TK 15 to 25 K, can produce an infall blue-asymmetry. We can rule out rotation as the cause of asymmetry in these cores as they are spatially unresolved and spectra were obtained toward the center of rotation of the cores (Menten et al. 1987, Adelson & Leung 1988).
Clearly, the asymmetries observed in the spectra in Figure 1 show that a majority of these cores (19 out of 27) are not static but have inward or outward motions. The interpretation of the blue-asymmetry as infall is well understood and has been modeled extensively (e.g. Choi et al. 1995). The interpretation of the red-asymmetry as outward expansion is less obvious. We can rule out interpreting red-asymmetry as infall because it requires abnormal conditions in which the excitation temperature will be lower near the core center. On the other hand, a reasonable interpretation of red-asymmetry is outward (expansion) motion in the core with a velocity law v(r) r-β where 0. Though a detailed interpretation of the dynamics associated with asymmetries in the line profiles will be model dependent, considering the above scenarios, here we assume that the cores showing red- or blue-asymmetries have either inward or outward motions. Among the 27 cores for which we have both the optically thick and thin spectral line profiles, 9 show blue-asymmetry, 10 show red-asymmetry, while the remaining 8 have roughly symmetrical profiles with a single velocity peak. Following Mardones et al. (1997) we quantify the red- and blue- asymmetry by the asymmetry parameter:
| (1) |
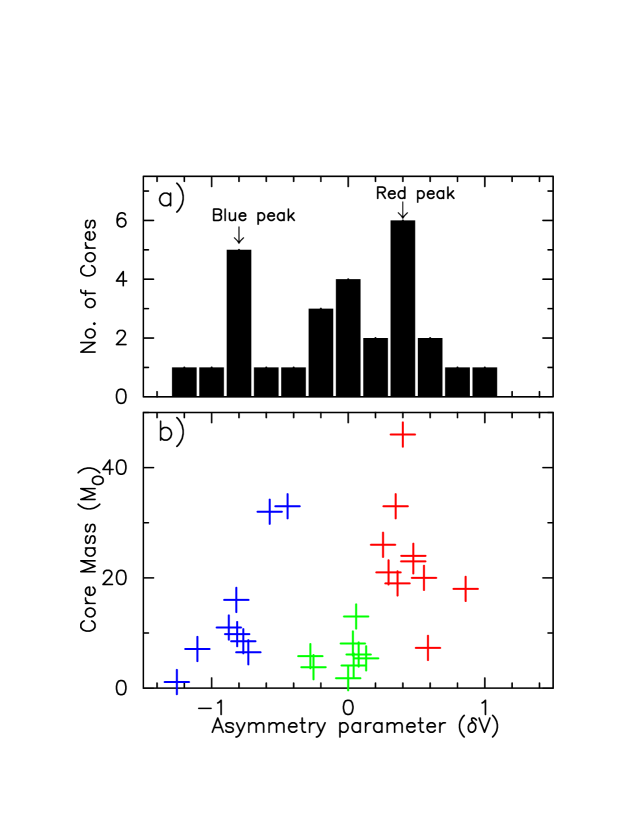
where is the velocity of the peak of the opaque (HCO+) line, is the velocity of the peak of the optically thin (H13CO+) line, and is the line width of the thin line; is indicated on each spectra in Figure 1. In Figure 2(a) we show the distribution of the observed asymmetry parameters. The distribution is bimodal with peaks having distinct blue- ( negative) and red- ( positive) asymmetries.
A fairly clear demarcation between the red- and blue- asymmetries as a function of core mass is evident in Figure 2b. The higher mass cores (with the exception of ORI1_13 and ORI2_2) tend to show a red-asymmetry while the lower mass cores show a blue-asymmetry. If we interpret the red-asymmetry as outward motion (expansion) within the core it is conceivable that these cores will fragment and eventually form only multiple lower mass stars. At the high end of the mass distribution, all of the 12 cores, having masses 15 M⊙, show either red- or blue- asymmetry and are either collapsing (3 cores) or expanding (9 cores). Thus for the high mass cores ( 15M⊙) we observe a larger proportion (by a factor 3) of cores showing expansion compared to those showing collapse. In contrast, among the 16 lower mass cores ( 15M⊙) only one (ORI1_17) shows evidence for expansion, while 6 cores show collapse and 8 are static. Assuming the cores showing blue-asymmetry will eventually form stars (3/12 for 15 and 6/16 for 15M⊙), we can estimate that 1/3 of the cores ( 32% of the total mass in our present sample of 27 cores in Orion) will form high mass stars.
Our Orion sample represents a population of massive molecular cloud cores in which the majority of the cores are dynamic out-of-equilibrium structures. We detect cores in roughly equal proportion showing all three kinematic states: static, outward, and inward motion. Therefore, we may be seeing, statistically, a snapshot of a population of cores exhibiting oscillatory motion. Oscillations in cores about a stable equilibrium configuration, producing the red- and blue-asymmetries, have been observed in low mass cores (Redman et al. 2006; Keto et al. 2006; Broderick et al. 2007). The masses of our cores, with the exception of a few, far exceed the critical masses for equilibrium as isothermal Bonnor-Ebert spheres (see Paper II, Fig.8). However, it is conceivable that they are magnetically supported. Although they are thermally supercritical, they could still be magnetically subcritical having equilibrium configurations (c.f. Mouschovias, 1991). Under such conditions they are easily excited by the external interstellar medium to exhibit oscillatory behavior, consistent with the distribution of the kinetic state of cores observed in our sample. The majority of cores above the median mass of our sample have red asymmetric profiles indicative of expansion. Numerical models also suggest that massive molecular cloud cores are in general likely to be dynamic, out-of-equilibrium structures, rather than quasi-hydro/magneto-static structures (Vázquez-Semadeni et al. 2005). In their models for the evolution of clumps and cores formed as turbulent density fluctuations, the dynamically compressed regions must either proceed to collapse right away or re-expand. These models predict that not all cores observed in molecular clouds will necessarily form stars and that a class of failed cores should exist, which will eventually re-disperse. Thus we should see some fraction of cores displaying outward as well as inward motions. Our results do show a larger detection of kinematic signatures with inward and outward motions than in previous studies, particularly in low mass starless cores (Lee et al. 2001). This result may not be unique to Orion and in general may be more common in massive than in low mass cores, but we are better able to detect kinematic signatures in Orion due to its proximity. Our results provide an important observational constraint on the fraction of collapsing (inward motions) versus non-collapsing (re-expanding) cores for comparison with model simulations.
References
- (1) Adelson, L. M., & Leung, C. M. 1988, MNRAS 235, 349
- (2) Broderick, A. E., Keto, E., Lada, C. J., & Narayan, R. 2007, ApJ 671, 1838
- (3) Choi, M., Evans, N. J., II, Gregersen, E. M., & Wang, Y. 1995, ApJ, 448, 742
- (4) Fuller, G. A., Williams, S. J., & Sridharan, T. K. 2005, A&A 442, 949
- (5) Gregersen, E. M., Evans, N. J., II, Zhou, S., & Choi, M. 1997, ApJ, 484, 256
- (6) Keto, E., Broderick, A., Lada, C. J., & Narayan, R. 2006, ApJ, 652, 1366
- (7) Lee, C. W., Myers, P. C., & Tafalla, M. 2001, ApJS, 136, 703
- Li et al. (2003) Li, D., Goldsmith, P. F., & Menten, K. 2003, ApJ, 587, 262 (Paper I)
- (9) Li, D., Velusamy, T., Goldsmith, P.F., & Langer, W.D. 2007, ApJ 655, 351 (Paper II)
- (10) Leung, C. M., & Brown, R. L. 1977, ApJ, 214, L73
- (11) Mac Low M-M., & Klessen R. S. 2004. Rev. Mod. Phys. 76, 125
- (12) Mardones, D., Myers, P. C., Tafalla, M., Wilner, D. J., Bachiller, R., & Garay, G. 1997, ApJ, 489, 719
- (13) McKee, C. F., & Tan, J. C. 2003. ApJ, 585, 850
- (14) Menten, K. M., Serabyn, E., Gusten, R., & Wilson, T. L. 1987, A&A, 177, L57
- (15) Mouschovias, T. Ch. 1991, ApJ, 373, 169
- (16) Redman, M. P., Keto, E., & Rawlings, J. M. C. 2006, MNRAS, 370, L1
- (17) Shu, F. H., Adams, F. C., & Lizano, S. 1987, ARA&A, 25, 23
- (18) Vázquez-Semadeni E., Kim, J., Shadmehri, M., & Ballesteros-Paredes, J. 2005. Ap. J. 618, 344
- (19) Velusamy, T., Marsh, K. A., Beichman, C. A., Backus, C. R., & Thompson, T. J. 2008, AJ 136, 197
- (20) Zhou, S., Evans, N. J., II, Kompe, C., & Walmsley, C. M. 1993, ApJ, 404, 232
- (21) Zhou, S. 1992, ApJ, 394, 204