Universality in the stock exchange
Abstract
We analyze the constituents stocks of the Dow Jones Industrial Average (DJIA30) and the Standard & Poor’s 100 index (S&P100) of the NYSE stock exchange market. Surprisingly, we discover the data collapse of the histograms of the DJIA30 price fluctuations and of the S&P100 price fluctuations to the universal non-parametric Bramwell-Holdsworth-Pinton (BHP) distribution. Since the BHP probability density function appears in several other dissimilar phenomena, our result reveals an universal feature of the stock exchange market.
keywords:
Stock exchange market , Universality , Econometrics1 Introduction
The modeling of the time series of stock prices is a main issue in economics and finance and it is of a vital importance in the management of large portfolio of stocks. From a statistical physics point of view, one can think that the stock prices form a non-equilibrium system. We investigate the constituent stocks of the indexes Dow Jones Industrial Average (DJIA30) and Standard & Poors 100 (S&P100), of the New York Stock Exchange Market (NYSE), observed in the 21 years period, January 1987 to September 2008, and comprising about 5470 trading days. Surprisingly, in this paper, we observe the data collapse of the histograms of the DJIA30 price fluctuations and of the S&P100 price fluctuations to the Bramwell-Holdsworth-Pinton (BHP) probability density function without any fitting.
2 Universality of the Bramwell-Hodsworth-Pinton distribution
The universal nonparametric BHP pdf was discovered by Bramwell, Holdsworth and Pinton [1]. The universal nonparametric BHP pdf is the pdf of the fluctuations of the total magnetization, in the strong coupling (low temperature) regime for a two-dimensional spin model (2dXY), using the spin wave approximation. The magnetization distribution, that they found, is named, after them, the Bramwell-Holdsworth-Pinton (BHP) distribution. The BHP probability density function (pdf) is given by
| (1) | |||||
where the are the eigenvalues, as determined in [4], of the adjacency matrix. It follows, from the formula of the BHP pdf, that the asymptotic values for large deviations, below and above the mean, are exponential and double exponential, respectively (in this article, we use the approximation of the BHP pdf obtained by taking and in equation (1)). As we can see, the BHP distribution does not have any parameter (except the mean that is normalize to 0 and the standard deviation that is normalized to 1) and it is universal, in the sense that appears in several physical phenomena. For instance, the universal nonparametric BHP distribution is a good model to explain the fluctuations of order parameters in theoretical examples such as, models of self-organized criticality, equilibrium critical behavior, percolation phenomena (see [1]), the Sneppen model (see [1] and [6]), and auto-ignition fire models (see [15]). The universal nonparametric BHP distribution is, also, an explanatory model for fluctuations of several phenomenon such as, width power in steady state systems (see [1]), fluctuations in river heights and flow (see [4] and [7]) and for the plasma density fluctuations and electrostatic turbulent fluxes measured at the scrape-off layer of the Alcator C-mod Tokamaks (see [16]). Recently, Gonçalves, Pinto and Stollenwerk [9] observed that the Wolf’s sunspot numbers fluctuates according to the universal nonparametric BHP distribution for, both, the ascending and descending phases. Surprisingly, we observe the data collapse of the DJIA30 price fluctuations and of the S&P100 price fluctuations to the Bramwell-Holdsworth-Pinton (BHP) probability density function (pdf). Hence, our result reveals an universal feature of the daily returns of the stock prices in the DJIA30 and S&P100 index.
3 The S&P100 stock ensemble
The S&P 100 index is a subset of the S&P 500 and is comprised of 100 leading U.S. stocks with exchange-listed options. The constituents of the S&P 100 represent about of the market capitalization of the S&P 500. The stocks in the S&P 100 are generally among the largest companies in the S&P 500. The variable investigated in our analysis is the re-scaled daily return defined by
| (2) |
where the stock has a closure price in the day . Let denote the number of stocks considered in the S&P 100. We define the mean of the re-scaled daily return by
We define the standard deviation of the re-scaled daily return by
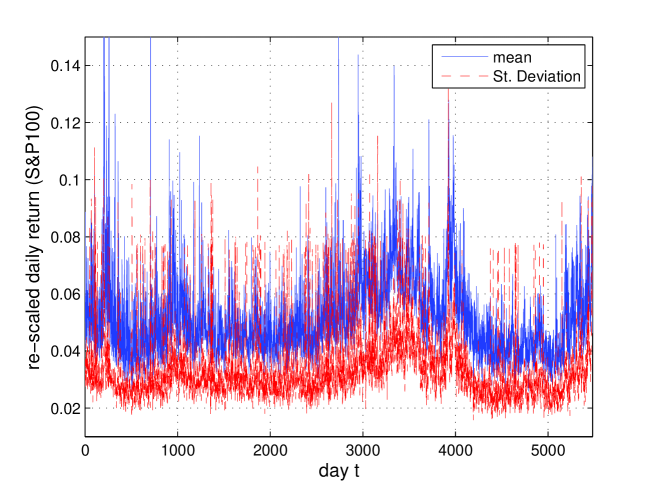
In figure 1, we show the mean and standard deviation of the re-scaled daily return. We define the S&P100 fluctuations by
| (3) |
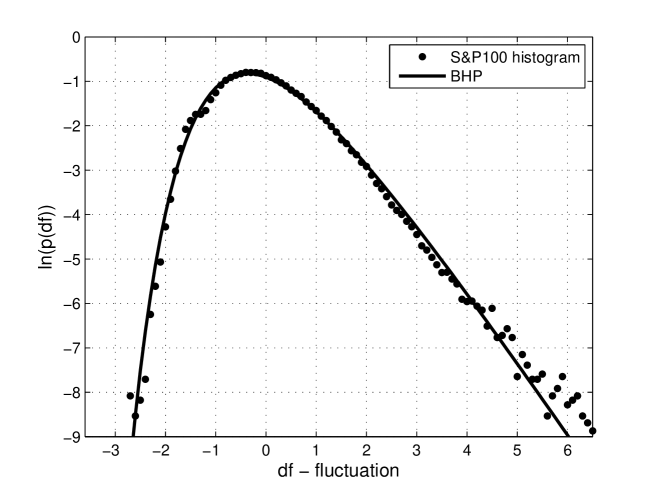
In Figure 2, we show the histogram of the S&P100 price fluctuations with the BHP pdf on top. Since the BHP pdf is non-parametric, we observe the data collapse of the histogram of the S&P100 fluctuations to the BHP pdf (without any fitting).
4 The DJIA30 stock ensemble
The DJIA30 consists of 30 of the largest and most widely held public companies in the United States. The variable investigated in our analysis is the re-scaled daily return defined by
| (4) |
where the stock has a closure price in the day . Let denote the number of stocks in the DJIA30. We define the mean of the re-scaled daily return by
We define the standard deviation of the re-scaled daily return by
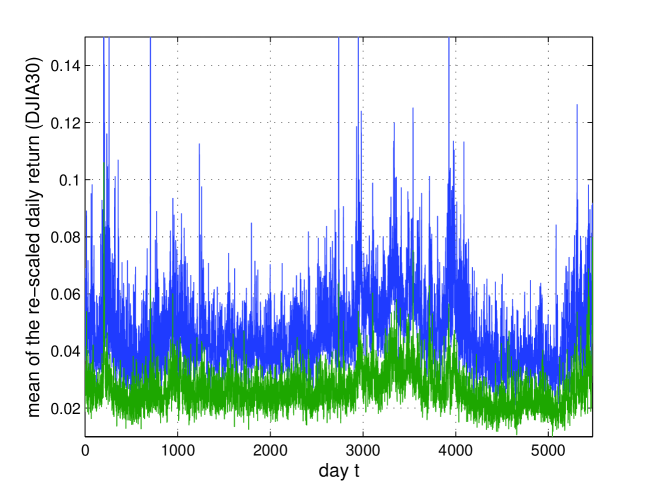
In figure 3, we show the mean and standard deviation of the re-scaled daily return. We define the DJIA30 price fluctuations by
| (5) |
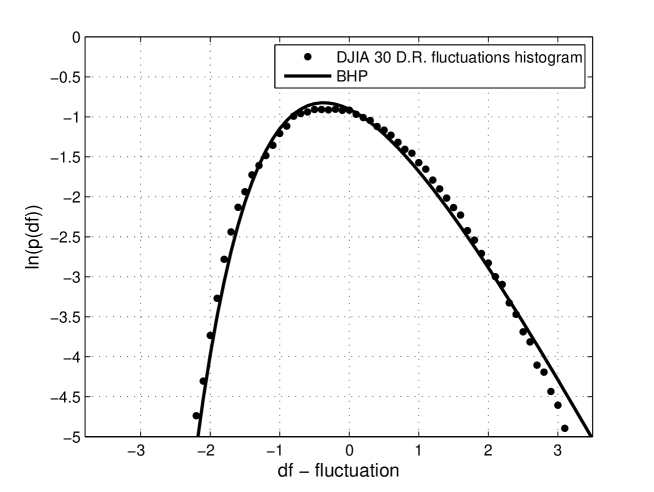
In Figure 4, we show the histogram of the DJIA30 price fluctuations with the BHP pdf on top. Since the BHP pdf is non-parametric, we observe the data collapse of the histogram of the DJIA30 fluctuations to the BHP pdf (without any fitting).
5 Conclusions
We analyzed the constituents stocks of the Dow Jones Industrial Average and the Standard & Poor’s 100 index of the NYSE stock exchange market. Surprisingly, we discovered the data collapse of the histograms of the DJIA30 price fluctuations and of the S&P100 price fluctuations to the universal non-parametric Bramwell-Holdsworth-Pinton (BHP) distribution. Since the BHP probability density function appears in several other dissimilar phenomena, our result revealed an universal feature of the stock exchange market.
References
- [1] Bramwell, S.T., Holdsworth, P.C.W., & Pinton, J.F. 1998 , Nature, 396, 552
- [2] Bak, P., Tang, C., & Wiesenfeld, K. (1988) Phys. Rev. A 38, 364–374.
- [3] Bramwell, S.T., Christensen, K., Fortin, J.Y., Holdsworth, P.C.W., Jensen, H.J., Lise, S., López, J.M., Nicodemi, M. & Sellitto,M. 2000 Phys. Rev. Lett., 84, 3744
- [4] Bramwell, S.T., Fortin, J.Y., Holdsworth, P.C.W., Peysson, S., Pinton, J.F., Portelli, B. & Sellitto, M. 2001 Phys. Rev. E 63, 041106.
- [5] Bramwell, S.T., Fennell, T., Holdsworth, P.C.W. & Portelli, B. 2002 Europhysics Lett., 57, 310
- [6] K. Dahlstedt, & H.J. Jensen 2001 J. Phys. A: Math. Gen., 34, 11193–11200
- [7] K. Dahlstedt, & H.J. Jensen 2005 Physica, A 348, 596–610
- [8] Faria, E., Melo, W. & Pinto, A. A. 2006, Annals of Mathematics, 164 , 731
- [9] Gonçalves, R. Pinto, A. A., Stollenwerk, N., 2008, The Astrophysical Journal (accepted)
- [10] Gonçalves, R. and Pinto, A. A. Proceedings of the Dynappl conference in Honor of Maurício Peixoto and David Rand. Pinto, A. A., Peixoto, M., Rand D., Eds Springer (to appear)
- [11] Lillo, F. and Mantegna, R. 2000, International Journal of Theoretical and Applied Finance, 3, 405-408 (2000).
- [12] Lillo, F. and Mantegna, R. 2001, Physica A, 299, 161-167
- [13] Melo, W. & Pinto, A. A. 1999, Comm. Math. Phys., 208, 91
- [14] Pinto, A. A., Rand, D. A & Ferreira F. (in press) 2008, Springer Monograph
- [15] Sinha-Ray, P., Borda de Água, L. & Jensen, H.J. 2001 Physica D, 157, 186-196.
- [16] Van Milligen, B. Ph., Sánchez, R., Carreras, B. A., Lynch, V. E., LaBombard, B., Pedrosa, M. A., Hidalgo, C., Gonçalves, B. & Balbín, R. 2005 Physics of plasmas, 12, 05207