CALIBRATION OF TETHERED PARTICLE MOTION EXPERIMENTS
Abstract
The Tethered Particle Motion (TPM) method has been used to observe and characterize a variety of protein-DNA interactions including DNA looping and transcription. TPM experiments exploit the Brownian
motion of a DNA-tethered bead to probe biologically relevant conformational changes of the tether. In these experiments, a change in the extent of the bead’s random motion is used as a reporter of the
underlying macromolecular dynamics and is often deemed sufficient for TPM analysis. However, a complete understanding of how the motion depends on the physical properties of the tethered particle
complex would permit more quantitative and accurate evaluation of TPM data. For instance, such understanding can help extract details about a looped complex geometry (or multiple coexisting
geometries) from TPM data. To better characterize the measurement capabilities of TPM experiments involving DNA tethers, we have carried out a detailed calibration of TPM magnitudeas a function of DNA length and particle size. We also explore how experimental parameters such as acquisition time and exposure time
affect the apparent motion of the tethered particle. We vary the DNA length from 200 bp to 2.6 kbp and consider particle diameters of 200, 490 and 970 nm. We also
present a systematic comparison between measured particle excursions and theoretical expectations, which helps clarify both the experiments and models of DNA conformation.
keywords:
Tethered particle; DNA; Brownian motion; calibration; single moleculePrimary 92C05; secondary 92C40, 92C37.\endAMSMOS
1 Introduction
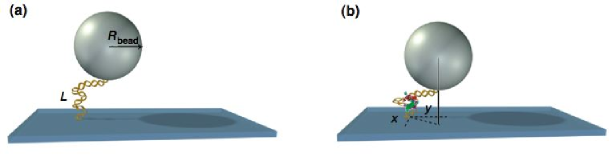
Single molecule studies are enriching our understanding of biological processes by providing a unique window on the microtrajectories of individual molecules rather than their ensemble-averaged behavior. Many of these studies are devoted to exploring the intricacies of protein–DNA interactions that are central to gene regulation, DNA replication and DNA repair. The resolution of nanometer-scale distances involved in such interactions poses a significant challenge. The emergence of the tethered particle motion (TPM) method offers a practical and relatively simple solution. In this method, a biopolymer is tethered between a stationary substrate and a micrometer-scale sphere (a “bead”), which is large enough to be imaged with conventional optical microscopy (Fig. 1). The constrained Brownian motion of the bead serves as a reporter of the underlying macromolecular dynamics, either by observing its blurred image in a long exposure [5], or by tracking its actual trajectory in time (e.g. as done in [11] and the present work). Changes in the extent of the motion (which we will call “excursion”) reflect conformational transformations of the tethered molecule. Such changes may be caused by processive walking of RNA polymerase [12, 23], DNA looping [5, 17, 24, 25, 22, 19, 2], DNA hybridization [14], DNA bending [15], Holliday junction formation [11] or RNA translation [20].
Although TPM is simple in principle, there are a variety of technical challenges that must be addressed for successful implementation. For example, sample preparation can be compromised by multiply-tethered beads, non-specific adsorption, transient sticking events and dissociation of the tether joints [11, 19, 17, 3, 9]. In addition, image analysis of TPM data is complicated by instrumental drift and the stochastic nature of the tethered particle’s motion. Several time scales must be considered, including the total observation time, exposure time, and the intrinsic diffusive time scale of the tethered particle. We will show that quantification of the spatial and temporal resolution of TPM measurements requires an understanding of how particle motion depends on tether length, particle size and other controllable parameters. We focus exclusively on TPM behavior in the absence of externally applied force (as might be applied via magnetic or optical tweezers).
The aims of this article are to: (1) review how data acquisition and data analysis affect TPM measurements; (2) explain a practical scheme of data selection and quantify the fractions of typical data that are rejected by each of our criteria; (3) calibrate particle motion, tether length and observation time so that subsequent TPM experiments can be quantitatively interpreted; and (4) discuss the physical processes that govern TPM. Calibration of the particle motion allows precise predictions of how a particular conformational change of the tether, such as Lac repressor induced looping of DNA, affects TPM.
Some of our experimental results were outlined in [8]. Theoretical work leading up to the present results on TPM motion appeared in [13, 9, 16]. For example, Segall et al. predicted effects of changing the size of the bead and tether length, which we document experimentally in the present work. Our results are preparatory to experimental [7] and theoretical [16] work on DNA looping in the lac operon system.
2 Results and Discussion
Using differential interference contrast (DIC) microscopy, the projected position of several beads in a field of view are recorded using a CCD camera. Sub-pixel resolution position traces for each bead in the image is determined using a cross-correlation method [6]. Standard microscopy systems such as ours are limited to two spatial dimensions; tracking of three dimensions has been accomplished using evanescent fields or diffraction rings [3], but this involves additional calibration and technical challenges. Two-dimensional tracking is sufficient for the applications we have in mind, such as DNA-looping studies. The tracked position of the bead is subject to slow drift, due to vibrations of the experimental apparatus, which we removed using a first order Butterworth filter at 0.05 Hz cutoff frequency [19]. To quantify bead excursion, we then used the square root of the sum of the variances of the drift corrected particle position along two orthogonal image-plane axes:
| (1) |
Here is the time interval over which the RMS motion is measured (typically 4 s); and represent the average of and over time . Eq. 1 is evaluated as a sliding filter at each point along the trajectory, and permits us to capture the tether dynamics using a single scalar quantity, as illustrated in Fig. 7 below. The finite-sample means are subtracted as an additional method of eliminating instrumental drift not removed by the Butterworth filter; in practice, this subtraction has little effect. When simulating the motion numerically, we will compute the same quantity as Eq. 1, in order to make an appropriate comparison.
2.1 Data selection criteria
Although single-particle tracking data can reveal detailed features of the dynamics of protein-DNA interactions, care must be taken to minimize experimental artifacts such as non-specific binding of the bead and DNA to each other and the surface, as well as multiple DNA attachments on the same bead. To get acceptable calibration data, we implemented several selection criteria called “minimum motion,” “motion symmetry,” and “uniformity.”
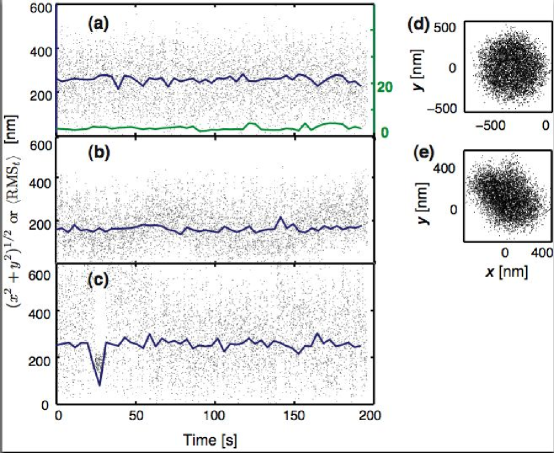
“Minimum motion” discards beads that cannot be differentiated from beads stuck to the glass substrate (or otherwise compromised in their mobility). from a control experiment with beads but no DNA is shown in Fig. 2 (green line), and is substantially smaller than that for a tethered bead (blue line). Data sets exhibiting average excursions, , lower than 30 nm cannot be differentiated from stuck beads and are therefore rejected.
“Motion symmetry” requires that a tethered particle should exhibit symmetric in-plane motion about its anchor point, and is calculated from the covariance matrix [3, 9]:
| (2) |
where
| (3) |
are the second moments of the bead’s position. Here is the number of video frames and , are the in-plane coordinates (i.e. the position ) of the microsphere for frame as obtained from the drift-corrected data. The eigenvalues () of the covariance matrix indicate the squares of the major and minor axes corresponding to the in-plane displacement of the bead and are equal for a perfectly symmetric motion. We took as our acceptable threshold. Fig. 2(d,e) displays scatter plots for the in-plane motion of two beads to illustrate the distinction between symmetric and asymmetric tethers. The first plot passes the symmetry test and would serve as a qualified tether; the second would be rejected. Asymmetric bead trajectories may be caused by multiple DNA tethers [11].
“Uniformity” qualifies tethers on the basis of the consistency of their motion over time and eliminates beads showing non-specific binding events, such as binding of DNA to the bead or glass surface for short periods. To detect these events automatically, we refine a procedure used in Ref. [3]. We first divide the entire time series into 10 subsets labeled by . In subset , we calculate over each 4 s window and then average these, defining . Then we define as the standard deviation of , normalized by the overall average . Only data sets with relative standard deviation are accepted. For example, the bead shown in Fig. 2(c) meets the motion and symmetry criterions; however, it displays a non-specific binding event at . In short, our third criterion removes tethers with temporal inconsistency in their Brownian motion.
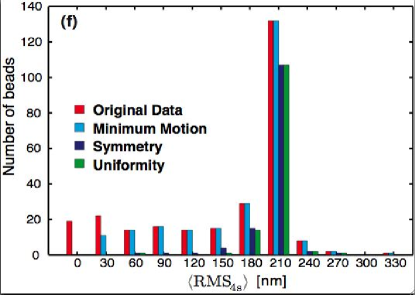
The first two selection criteria discard tethers that are permanently defective, whereas the third eliminates time series with undesirable transient events. Note that if the purpose of the experiment is to identify interesting molecular binding events, such as those leading to DNA looping or bending, then the last criterion cannot be applied, because these transient events can appear similar to the sticking events rejected by the uniformity criterion. In the present work we aimed at characterizing uniform DNA tethers, so we enforced all three criteria. Prior to applying the selection criteria, Fig. 2(f) displays a broad distribution in the measured (red). Afterwards, of the data are qualified and exhibit well-defined Brownian motion (green bars). This figure shows that the primary cause of bead rejection is asymmetric in-plane motion. Experimentally, beads with multiple tethers can be minimized by reducing the concentration of DNA.
2.2 Acquisition Time
The drift-corrected trajectories are noisy due to the stochastic Brownian motion of the particle, and are thus filtered using Eq. 1 over a particular time window (usually four seconds). Although analysis methods exist that make no use of this windowing step [2, 1], nevertheless many experiments do use it, and so we investigated its effect on reported bead excursion. Too short a window will increase the noise, leading to broad peaks in the distribution of that make signals from differently sized tethers too difficult to distinguish. Moreover, for short the bead will not adequately explore its full range of accessible configurations, leading to an underestimate of , as we document below. At the other extreme, however, too long a window will result in a loss of temporal resolution.
To determine the optimum TPM window size, we recorded data for 200, for several bead sizes and a wide range of tether lengths, then found the mean () and standard deviation () of the RMS-filtered trajectory for various values of window size (see Fig. 3). Here denotes two averages: (1) over the windows that make up each bead’s time series, and (2) over nominally identical tethered particles with the same bead size and tether length. The DNA lengths varied from 199 bp to 2625 bp, and we tested beads with three different diameters: 200 nm, 490 nm and 970 nm.
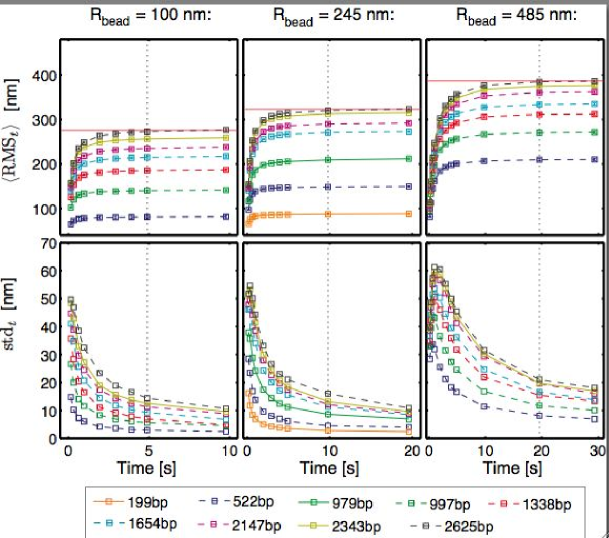
Fig. 3 shows the trends as we vary , , and tether length . We first notice that for fixed and , each curve levels off as , giving an asymptote that is the true RMS excursion. (For short times, the bead has not had a chance to explore its full range of motion in any given window, and so each , and hence so does .) To make the tradeoff discussed earlier, we now ask: How long must we choose the window time in order to get a reliable estimate of the true excursion?
Naively we might suppose that each video frame gives an independent draw from a distribution of bead positions whose RMS value we seek. In that case, we would expect that as soon as becomes large, we would have a good estimate of the true RMS excursion. But the top row of Fig. 3 shows that, on the contrary, the minimum required observation time increases both with increasing bead radius (moving between the three panels) and with increasing tether length (moving between the curves on a given panel). Physically, the point is that successive video frames are not independent draws from the distribution of particle positions, because the particle’s motion is diffusive. The diffusion time of a particle in a trap increases with increasing trap radius and with increasing viscous drag constant for the particle, giving rise to the trends observed in the figure. (For a theoretical discussion see the Supplement to [16].)
Similarly, the second row of graphs in Fig. 3 shows that the scatter between successive determinations of decreases with increasing . This “sharpening” effect also explains how RMS filtering takes rather diffuse raw data (e.g. Fig. 2a–c) and transforms it into a fairly well-defined “state” (e.g. the individual states visible in filtered traces such as Fig. 7). In both rows of Fig. 3, we have drawn dotted lines to illustrate a value of that is “safe” (long enough) for tether lengths up to 2600 bp.
2.3 Calibration of motion
In order for TPM experiments to detect discrete conformational changes of biopolymers such as in DNA looping, it is necessary to quantify how tether length affects particle motion. Precise calibration data also indicates the minimum detectable change in tether length. Sensitive measurements may also allow detection of more subtle changes, such as kinking of the DNA upon protein binding or multiple loop topologies.
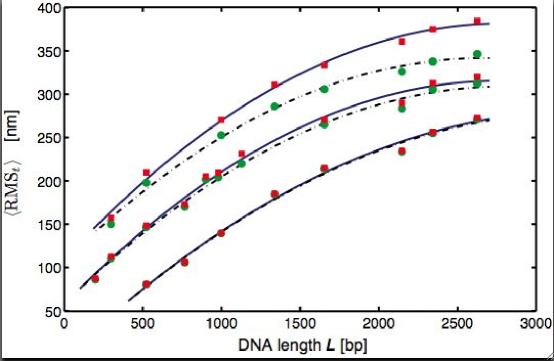
To find the empirical calibration curve, we created many DNA tethers of varying lengths, and attached beads of three different sizes. For each bead size, we estimated the RMS excursion by its finite-sample estimate , taking to be the lowest “safe” value as estimated in the previous subsection: , 10 s and 20 s for beads with diameters of 200 nm, 490 nm and 970 nm respectively, with results shown in Fig. 4. (For comparison, we also show corresponding results with fixed to 4 s, which deviate significantly from the longer observations for the larger beads.) We summarized all these data with polynomial fits shown in the figure and given explicitly in Table 1.
| Time [s] | Diameter | |||
|---|---|---|---|---|
| 5 | 200 nm | -2.58 0.68 | 0.17 0.02 | -4.514.8 |
| 10 | 490 nm | -3.37 0.47 | 0.19 0.01 | 57.3 7.2 |
| 20 | 970 nm | –3.49 0.46 | 0.20 0.01 | 109.5 8.7 |
| 4 | 200 nm | -2.60 0.69 | 0.17 0.02 | -4.7514.7 |
| 4 | 490 nm | -3.17 0.41 | 0.18 0.01 | 58.05 6.6 |
| 4 | 970 nm | –3.31 0.48 | 0.18 0.01 | 107.7 8.7 |
2.4 Theoretical predictions
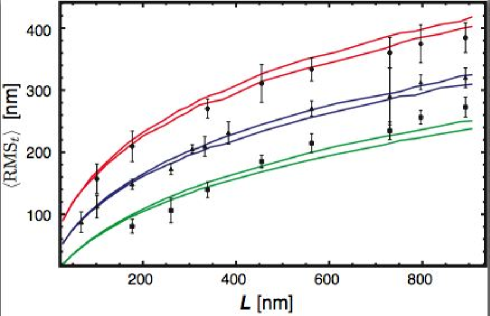
We also compared the experimental data in Fig. 4 to a mathematical simulation of the bead-tether-wall system (Fig. 5). The excursion of the bead away from its attachment point on the microscope slide is affected by the length and stiffness of the DNA tether, the size of the bead, and the various interactions between the bead/wall, bead/tether, and wall/tether. To account for all these effects, we modified the Gaussian sampling Monte Carlo technique previously used in [13, 9, 4, 8] (see [16] for details).
Suppose first that a semiflexible polymer chain is anchored at one point in space, but is otherwise unconstrained. At the anchored point we suppose we are given a probability distribution of different possible initial orientations for the first chain segment. The distribution of positions and orientations of the other end is then a convolution of this initial distribution with a kernel representing a particular diffusion process (random walk) on the group manifold of the three-dimensional Euclidean group.
We can numerically compute moments of this final distribution, or its various marginal distributions, by a Monte Carlo procedure. Idealizing the polymer as a chain of finite elements, each is related to its predecessor by a shift along the latter’s 3-axis, a twist about the same axis, and some random bend and twist. Rather than represent the random part using Euler angles, a more invariant formulation is to draw a generator matrix from a Gaussian distribution on the Lie algebra so(3), then exponentiate it. The Gaussian distribution is determined by a covariance matrix, which represents the bend and twist elasticity of the DNA, together with bend-twist couplings. We estimated it up to an overall rescaling factor from structural data on DNA, then chose the overall factor to yield a desired value of the persistence length of DNA.
Turning from the idealized problem above to TPM, we see that we must implement steric constraints: One end of the DNA tether is attached to a wall, which the DNA may not penetrate. Moreover, the other end is attached to the sphere, which itself must not penetrate the wall. Nevertheless, each segment of the intervening DNA is otherwise free to bend, independently of its neighbors. Thus the same Monte Carlo generation just described continues to be valid, except that some sterically forbidden chains must be discarded. Thus our computer code generated many simulated DNA chains and bead orientations in a Boltzmann distribution, applied the steric constraints [13], and tabulated the resulting values of the distance from the projected bead center to the attachment point. The necessary calculations were coded in Mathematica and ran conveniently on a laptop computer.
We chose to compare to experimental data with “safe” values of the window time , so we simply had the code evaluate the RMS value of this distance. (For a procedure valid for any , see the Supplement to [16].) We also applied a correction to this theoretical result, to account for the bead’s motion during the rather long shutter time (see the following subsection). Fig. 5 shows that an a priori calculation of the expected motion matches the data fairly well, with a value of persistence length consistent with others’ experiments; there were no other fitting parameters.
2.5 Blurring Effect
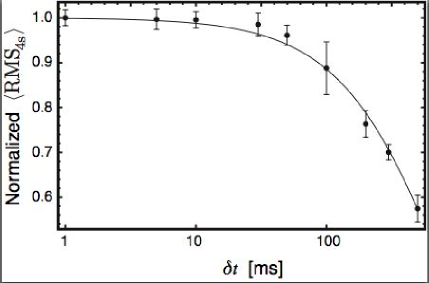
In our experiments the camera had a long shutter time (). During each exposure, the bead moved, creating a blurred image whose center is not quite the same as the instantaneous center. This blurring effect reduces the apparent bead excursion. Suppose for example that the bead has a momentary excursion to a large value of . Subsequently, its stretched tether will pull it inward, so that the average position during the video frame has a smaller value of . We quantified this effect using a 901 bp DNA and a 490 nm diameter bead at 1, 5, 10, 30, 50, 100, 200, 300 and 500 exposures (Fig. 6). Longer exposures indeed reduce the apparent RMS motion of the bead. The effect is minimal for exposure times smaller than 30 ms, but decreases sharply above this value.
These effects can be considered from a theoretical perspective (see the Supplement to [16]). The effect of the tether on the bead may be approximated as a harmonic restoring force. If the bead starts at a distance from the center, then its average position drifts inward under the influence of this force. Averaging that trajectory over the video frame gives a blurred trajectory with center at , where the blur factor is
| (4) |
The time constant can in principle be estimated from first principles, but in practice we fit it to data such as those in Fig. 6. For very small we get . For large , we have .
To predict the experimental data we should thus take the theoretical prediction and correct it by a factor of . This correction is trivial to apply (comes out of the statistical averaging), because is independent of . The curves in Fig. 6 show that a correction of the form of Eq. 4 fits the data well; this correction was applied when drawing the curves in Fig. 5.
3 Applications to DNA Looping
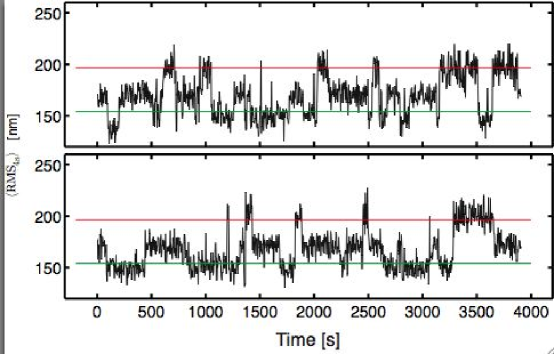
One of the key applications of the tethered particle method has been its use in studying DNA looping. Many transcriptional regulatory motifs involve the binding of transcription factors that bind at more than one site simultaneously, forming a loop of the intervening DNA (Fig. 1). The TPM technique has been used to explore these problems. The calibration analysis performed here can serve as the basis of a more careful evaluation of DNA looping and bending by DNA-binding proteins, and a guide to optimize the design of subsequent DNA looping experiments. For example, one may ask, what is the optimal total DNA length and bead size needed to reliably detect a particular type of loop? To answer such questions, first note that Fig. 3 quantifies how smaller beads and shorter tethers both allow us to work with small window size , while still giving the narrow peak widths necessary to resolve substructure in the distribution of . Fig. 4 reinforces this point and also quantifies how smaller beads also optimize the resolution of TPM by maintaining a high slope to the calibration curve over a wide range of . There are limits to what can be achieved in this way, of course: Small beads are hard to observe, and short DNA tethers tend to collapse (due to surface absorption). Our work helps the experimenter to make appropriate tradeoffs when designing experiments.
Another benefit derived from the calibration curve is a better understanding of the geometry of the conformational changes we have studied. For example, Fig. 7 clearly shows the existence of a third state, not coinciding with either of the horizontal lines naively predicted from the calibration curve [22, 10, 7]. More detailed simulations can then shed light on the geometries of the two distinct looped species disclosed by TPM assays [16, 7].
4 Conclusions
The tethered particle motion method is one of the simplest tools for performing single-molecule experiments on DNA-protein complexes. In contrast to other methods involving fluorescence, TPM never bleaches, allowing very long observations. The central idea is to use the Brownian motion of a small particle tethered to a DNA molecule as a reporter of the underlying macromolecular dynamics of the DNA in its complexes with DNA-binding proteins. The point of this paper has been to examine the challenges that are inherent in making useful quantitative measurements using this method. One of the main outcomes of that effort has been the development of calibration curves that illustrate how tethered-particle excursions depend upon both bead size and tether length.
5 Materials and Methods
5.1 Sample preparation
The first step in any TPM experiment is construction of the relevant DNA tethers with their associated reporter beads. Polymerase Chain Reaction (PCR) was used to amplify labeled DNA with two modified primers. The primers were either biotin or digoxigenin labeled at the 5’ ends (MWG Biotech AG, Ebersberg, Germany). The labels permit specific linkage of the DNA to a polystyrene microsphere or glass coverslip, respectively. The PCR templates were taken from lambda phage or modified pUC19 plasmid (sequences available upon request). The PCR products were purified by gel extraction (QIAquick Gel Extraction Kit, QIAGEN).
Streptavidin (Bangs lab) or neutravidin (Molecular Probes) coated microspheres of diameter 200, 490 and 970 nm served as our tethered particles. In contrast to the 490 and 970 nm microspheres, the 200 nm microspheres were fluorescent. Prior to incubation with DNA, a buffer exchange on the beads was performed by three cycles of centrifugation and resuspension in TPB buffer (20mM Tris-acetate, pH=8.0, 130mM KCl, 4mM MgCl2, 0.1mM DTT, 0.1mM EDTA, 20 g/ml acetylated BSA (Sigma-Aldrich), 80 g/ml heparin(Sigma-Aldrich) and 3 mg/ml casein (Sigma), filtered with 300kD MWCO polysulfone membrane (Millipore)). This combination of reagents was chosen in an attempt to maximize sample yield and longevity, while minimizing non-specific adsorption of DNA and microspheres onto the coverslip.
The second step is DNA tether assembly. Tethered particle samples were created inside a 20-30 flow cell made out of a glass slide, glass coverslip, double-sided tape and tygon tubing. The coverslip and slide were cleaned with 4N HCl for 24 hours and then the flow cell was constructed in the same manner as described by van Oijen et al. [18]. Next, the flow chamber was incubated with 20 g/mg anti-digoxigenin (Sigma) in PBS buffer for 30 minutes, and then rinsed with 400 l wash buffer (TPB buffer with no casein) followed by 400 l of TPB buffer. Microsphere-DNA complexes were created by incubating approximately 100 pM microspheres with 10 pM labeled DNA in TPB buffer for at least an hour. The DNA concentration was estimated via gel band strength. The 10:1 ratio of beads to DNA was designed to minimize the occurrence of multiple DNA strands attached to a single microsphere. The tethering procedure was completed by introducing 50 l of the microsphere-DNA complexes into the flow cell for four to ten minutes. Additional tethering yield could be accomplished by another round of incubation with fresh microsphere-DNA complexes. Finally, unbound microspheres were removed by flushing the chamber with 1 mL TPB buffer. Once microspheres were introduced into the flow cell, tether integrity was improved by taking care to minimize flow rates within the sample chamber.
5.2 Data Acquisition and Analysis
The sample is imaged on an inverted microscope using Differential Interference Contrast (DIC) optics and a 1.3 NA 100x oil-objective (Olympus). The tethered particle’s motion was captured using an Andor Ixon camera. Each pixel dimension corresponds to 102 nm in the sample plane. Image transfer and storage was either controlled through Ixon software (Andor Technology) or custom Matlab code (all of our Matlab acquisition and analysis code is available upon request). The former recorded 8-14 bits per pixel, while the latter captured 14 bits per pixel. However, a comparison of the capture methods showed insignificant differences (data not shown). Care was taken to ensure that the image intensity exhibited broad dynamic range without saturation. Some data was obtained using a Matlab-based autofocus routine that interfaced with a Prior controller. However, for acquisition times shorter than five minutes, the paraxial drift was small and autofocus was not needed.
The first step in analyzing TPM data is to compute trajectories for every tethered particle. The particle’s X and Y displacement as a function of time was extracted from the raw data using a cross-correlation tracking algorithm [6]. Such raw positional data are subject to a slow drift due to vibrations of the experimental apparatus. A drift correction is then applied using high pass first-order Butterworth filter at cutoff frequency 0.05 Hz [19].
6 Acknowledgements
The senior authors gratefully acknowledge Nick Cozarelli’s direct and indirect influence on our work. We especially recall Nick’s tactful, wise counsel at a time when one of us was an embryonic biological physicist with an interesting, but poorly presented, idea. Multiplied manyfold, such attentions have shaped a generation of researchers.
We are grateful to generous colleagues who have advised us on many aspects of this work, including: Meredith Betterton, David Dunlap, Laura Finzi, Arivalagan Gajraj, Jeff Gelles, Jané Kondev, Chris Meiners, Keir Neuman, Matthew Pennington, Tom Perkins, Bob Schleif, Kevin Towles.
References
- [1] J. F. Beausang and P. C. Nelson, Diffusive hidden Markov model characterization of DNA looping dynamics in tethered particle experiments, Phys, Biol., 4 (2007), pp. 205–219.
- [2] J. F. Beausang, C. Zurla, C. Manzo, D. Dunlap, L. Finzi, and P. C. Nelson, DNA looping kinetics analyzed using diffusive hidden Markov model, Biophys. J., 92 (2007), pp. L64–6.
- [3] S. Blumberg, A. Gajraj, M. W. Pennington, and J. Meiners, Three-dimensional characterization of tethered microspheres by total internal reflection fluorescence microscopy, Biophys. J., (2005), pp. 1272–1281.
- [4] L. Czapla, D. Swigon, and W. K. Olson, Sequence-dependent effects in the cyclization of short DNA, Journal of Chemical Theory and Computation, 2 (2006), pp. 685–695.
- [5] L. Finzi and J. Gelles, Measurement of lactose repressor-mediated loop formation and breakdown in single DNA molecules, Science, 267 (1995), pp. 378–80.
- [6] J. Gelles, B. Schnapp, and M. Sheetz, Tracking kinesin-driven movements with nanometre-scale precision, Nature, 331 (1988), pp. 450–453.
- [7] L. Han, H. G. Garcia, S. Blumberg, K. B. Towles, J. F. Beausang, P. C. Nelson, and R. Phillips, Concentration and length dependence of DNA looping in transcriptional regulation. Submitted; available at http://arxiv.org/abs/0806.1860, 2008.
- [8] P. C. Nelson, Colloidal particle motion as a diagnostic of DNA conformational transitions, Curr. Op. Colloid Intef. Sci., 12 (2007), pp. 307–313.
- [9] P. C. Nelson, C. Zurla, D. Brogioli, J. F. Beausang, L. Finzi, and D. Dunlap, Tethered particle motion as a diagnostic of DNA tether length, J. Phys. Chem. B, 110 (2006), pp. 17260–17267.
- [10] D. Normanno, F. Vanzi, and F. Pavone, Single-molecule manipulation reveals supercoiling-dependent modulation of lac repressor-mediated DNA looping., Nucl. Acids Res., 36 (2008), pp. 2505–2513.
- [11] N. Pouget, C. Dennis, C. Turlan, M. Grigoriev, M. Chandler, and L. Salome, Single-particle tracking for DNA tether length monitoring, Nucl. Acids Res., 32 (2004), pp. e73–(1–7).
- [12] D. A. Schafer, J. Gelles, M. P. Sheetz, and R. Landick, Transcription by single molecules of RNA polymerase observed by light microscopy, Nature, 352 (1991), pp. 444–8.
- [13] D. E. Segall, P. C. Nelson, and R. Phillips, Volume-exclusion effects in tethered-particle experiments: Bead size matters, Phys. Rev. Lett., 96 (2006), pp. 088306–(1–4).
- [14] M. Singh-Zocchi, S. Dixit, V. Ivanov, and G. Zocchi, Single-molecule detection of DNA hybridization, Proc. Natl. Acad. Sci. USA, 100 (2003), pp. 7605–10.
- [15] S. Tolic-Norrelykke, M. Rasmussen, F. Pavone, K. Berg-Sorensen, and L. Oddershede, Stepwise bending of DNA by a single TATA-box binding protein, Biophys. J., 90 (2006), pp. 3694–703.
- [16] K. Towles, J. F. Beausang, H. G. Garcia, R. Phillips, and P. C. Nelson, First-principles calculation of DNA looping in tethered particle experiments. Submitted; available at http://arxiv.org/abs/0806.1551, 2008.
- [17] B. van den Broek, F. Vanzi, D. Normanno, F. S. Pavone, and G. J. Wuite, Real-time observation of DNA looping dynamics of Type IIE restriction enzymes NaeI and NarI, Nucleic acids research, 34 (2006), pp. 167–74.
- [18] A. M. van Oijen, P. C. Blainey, D. J. Crampton, C. C. Richardson, T. Ellenberger, and X. S. Xie, Single-molecule kinetics of lambda exonuclease reveal base dependence and dynamic disorder, Science, 301 (2003), pp. 1235–8.
- [19] F. Vanzi, C. Broggio, L. Sacconi, and F. S. Pavone, Lac repressor hinge flexibility and DNA looping: single molecule kinetics by tethered particle motion, Nucl. Acids Res., 34 (2006), pp. 3409–20.
- [20] F. Vanzi, S. Vladimirov, C. R. Knudsen, Y. E. Goldman, and B. S. Cooperman, Protein synthesis by single ribosomes, RNA, 9 (2003), pp. 1174–9.
- [21] M. D. Wang, H. Yin, R. Landick, J. Gelles, and S. M. Block, Stretching DNA with optical tweezers, Biophys. J., 72 (1997), pp. 1335–1346.
- [22] O. K. Wong, M. Guthold, D. A. Erie, and J. Gelles, Interconvertable lactose repressor-DNA looped complexes revealed by single-molecule experiments, 2008. PLoS Biology, in press.
- [23] H. Yin, R. Landick, and J. Gelles, Tethered particle motion method for studying transcript elongation by a single RNA polymerase molecule, Biophys. J., 67 (1994), pp. 2468–2478.
- [24] C. Zurla, A. Franzini, G. Galli, D. Dunlap, D. E. A. Lewis, S. Adhya, and L. Finzi, Novel tethered particle motion analysis of CI protein-mediated DNA looping in the regulation of bacteriophage lambda, J. Phys.: Condens. Matter, 18 (2006), pp. S225–S234.
- [25] C. Zurla, T. Samuely, G. Bertoni, F. Valle, G. Dietler, L. Finzi, and D. D. Dunlap, Integration host factor alters LacI-induced DNA looping, Biophys. Chem., 128 (2007), pp. 245–52.