A parsec scale X-ray extended structure from the X-ray binary Circinus X-1
Abstract
We present the results of the analysis of two Chandra observations of Circinus X-1 performed in 2007, for a total exposure time of 50 ks. The source was observed with the High Resolution Camera during a long X-ray low-flux state of the source. Cir X-1 is an accreting neutron-star binary system that exhibits ultra-relativistic arcsec-scale radio jets and an extended arcmin-scale radio nebula. Furthermore, a recent paper has shown an X-ray excess on arcmin-scale prominent on the side of the receding radio jet. In our images we clearly detect X-ray structures both on the side of the receding and the approaching radio jet. The X-ray emission is consistent with being from synchrotron origin. Our detection is consistent with neutron-star binaries being as efficient as black-hole binaries in producing X-ray outflows, despite their shallower gravitational potential.
keywords:
X-rays: binaries - stars: individual: Cir X-1 - ISM: jets and outflow.1 Introduction
Cir X-1 is an exotic X-ray binary discovered by Margon et al. (1971) which shows flares with a period of 16.55 days, observed first in the X-ray band (Kaluzienski et al. 1976) and then in the infrared (Glass 1978; Glass 1994), radio (Haynes et al. 1978) and optical bands (Moneti 1992): this fact is interpreted as enhanced accretion close to the periastron passage of a highly eccentric binary orbit (, Murdin et al. 1980, Nicolson, Glass & Feast 1980). Beyond variability at the 16.55 day orbital period the source shows dramatic evolution of its X-ray luminosity, spectra and timing properties on timescales from milliseconds to decades (Shirey et al. 1999, Parkinson et al. 2003). The evidence that the system harbours a neutron star comes from the detection of type-I X-ray bursts (Tennant et al. 1986a,b), confirmed by the recent detection of twin kHz QPOs in the X-ray power density spectra (Boutloukos et al. 2006). Based on the properties of the type-I X-ray bursts, Jonker & Nelemans (2004) estimated a distance to the source of 7.8-10.5 kpc; according to a different measure of the galactic absorption, Iaria et al. (2005) derived a lower distance of 4.1 kpc (but see Jonker, Nelemans, Bassa 2007).
Cir X-1 is the most radio-loud neutron star X-ray binary (Whelan et al. 1977, Haynes et al. 1978; Cyg X-3 and SS433 are brighter in radio but their nature is unclear), showing extended structures both at arcmin and arcsec scale. The arcmin-scale structure has been extensively studied by Stewart et al (1993) and by Tudose et al. (2006): the source shows two radio jets (south-east and north-west direction) embedded in a large scale, diffuse radio nebula. There is general agreement that this nebula is the result of the radio lobe inflated by the jets over several hundred-thousand years. Arcmin-scale jets are curved which might be due to an interaction with the interstellar medium (ISM) or a precessing jet. The arcsec-scale structure has been investigated for the first time by Fender et al. (1998) and later studied by Fender et al. (2004), that reported a one-sided highly-variable jet (for a detailed study of the arcsec-variability evolution over 10 years see Tudose et al. 2008), the most relativistic one detected so far within our Galaxy, with a bulk Lorentz factor 10.
The X-ray light curve of Cir X-1 is highly variable and characterized by bright flares and periods
of very low X-ray flux (Parkinson et al. 2003). On 2005 June 2nd Cir X-1 was observed with the High
Energy Transmission Gratings (HETGS) onboard Chandra for 50 ks during one of its long-term X-ray
low-flux states (an example of X-ray light curve with long periods of low flux is reported in Figure
1). Analysing the HETGS observation, Heinz et al. (2007) found evidence for an arcmin-scale
X-ray structure prominent on the side of the receding radio jet. While for black hole candidates
extended X-ray jets have already been detected with Chandra and XMM-Newton in a number of sources (e.g. XTE
J1550-564, Corbel et al. 2002; 4U 1755-33, Angelini & White 2003; H1743-322, Corbel et al. 2005),
this is the first detection of X-ray structures in a secure neutron star system, showing that neutron stars can be
as efficients as black holes in producing X-ray outflows.
Here we present recent Chandra observations of Cir X-1 where
we clearly detect an extended X-ray structure both on the side of the approaching and the receding
radio jet, confirming and extending the detection of Heinz et al. (2007).
2 Observation and data analysis

|
Cir X-1 was observed with the High Resolution Camera (HRC; Zombeck et al. 1995, Murray et al. 1998) onboard the Chandra X-ray Observatory on 2007 April 21st (43 ks) and on 2007 May 16th (7 ks), during an exceptionally long interval of very low X-ray flux that occurred from 2007 February until 2007 August. Figure 1 shows the X-ray light curve of Cir X-1 taken with the All Sky Monitor (ASM) instrument onboard the Rossi X-ray Timing Explorer satellite (RXTE) for the period 2005 March - 2007 November, where several episodes of low-flux can be identified. Two vertical dashed lines correspond to our two HRC-I observations (hereafter observation A and observation B, respectively).
2.1 X-ray jets
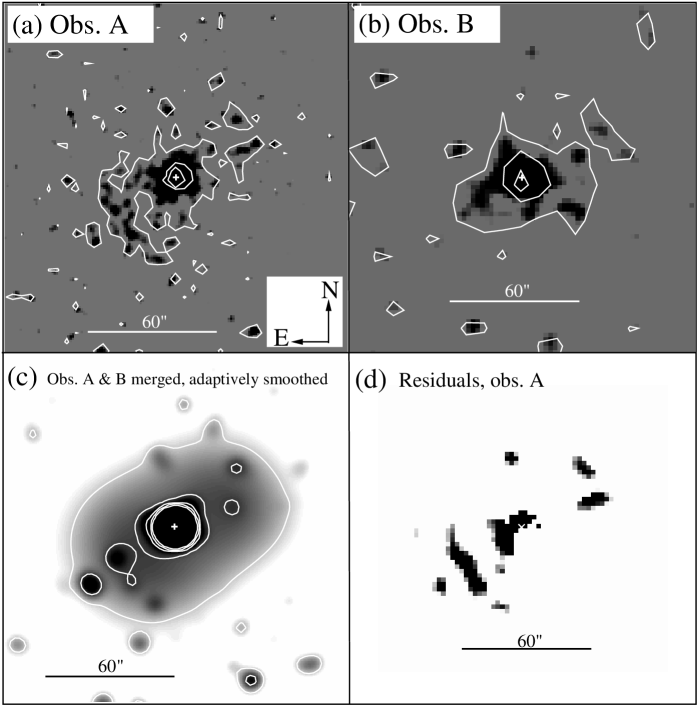
Images from observations A and B are reported in Figure 2. The images have been rebinned and smoothed using a gaussian kernel of three pixels in radius and countour lines have been applied.
|
A visual inspection of the images clearly reveals the presence of an extended X-ray structure
around the source up to arcmin scale, visible in the South-East and in the North-West quadrant (i.e.
aligned with the South-East - North-West direction), consistent both with the results recently reported by Heinz et al. (2007)
and with the alignment of the arcmin-scale jet observed by Stewart et al. (1993) and by
Tudose et al. (2006); this issue will be discussed in §2.2.
The extended emission is detected both in obs. A and B and the two images (note the different
exposure in the two observations), at a visual inspection, are consistent: the X-ray emission around the
central source, in both of them, elongates along the same axis and furthermore, it presents similar
structures in the North-West quadrant and a similar spike-like structure in the northern quadrant (although there are
differences specially in the South-East quadrant, due to different sensitivity limits).
Since the two images are consistent, we can merge them to have an image with a higher equivalent exposure,
using the standard Ciao 4.0 analysis tools (Fruscione et al. 2006). We adaptively smoothed the image
obtained from the merging with an average significance of per smoothing length (the minimum smoothing
length is 6 pixels, the maximum one corresponds to the image size) and we applied contour levels.
The resulting image is plotted in Figure 2 (panel (c)), where a diffuse X-ray emission elongated
along the South-East - North-West direction is evident, extending up to 1 arcmin from the point source. Other
structures might look real from an analysis of this image (e.g a circular excess in the South-West quadrant) but they will not be
discussed since an inspection of the residuals obtained after fitting the point spread function (PSF)
suggests that they are noise features (see next part of this paragraph).
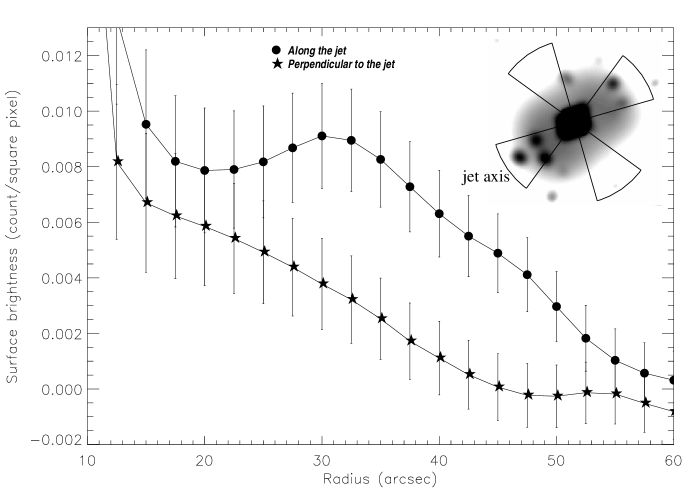
Figure 3 shows two profile cuts (for obs. A), one extracted on a region aligned with the X-ray excess
and one along the perpendicular axis, showing an excess along the South-East - North-West axis and supporting the evidence that
there is an X-ray extended structure aligned with a privileged direction.
From Figure 2 (panels (a), (b) and (c)) and Figure 3 the presence of an extended
X-ray structure around the central source is evident but to make our detection more robust, an analysis of the PSF is needed.
We simulated a monochromatic PSF at 1 keV (from Heinz et al. 2007 we expect the X-ray excess emission to peak
at this energy) using ChaRT (Carter et al. 2003), considering the same number of counts as detected from the source
and we projected it in the detector
plane using the Marx ray tracing (Wise 1997). Since the PSF wings depend on the position on the detector, for the PSF
analysis we used only the obs. A: even if the image from the merging has a higher equivalent exposure,
the PSF extracted from that image might contain artefacts (the source position on the detector is not the same for
obs. A and B) that we want to avoid.
For the PSF analysis, the Sherpa 3.4 tools (Freeman et al. 2001) have been used.
In Figure 2 (panel (d)) we show the image of the residuals obtained after fitting the
source image with a gaussian function and a constant using the PSF image as the convolution kernel. The presence of an
extended X-ray structure aligned with the South-East - North-West axis is evident, at a distance from the central source
between ” and ” (the lower limit is inferred by inspecting both the residuals image and the
radial profile image in Figure 3). The X-ray excess on the side of the receding radio-jet
(North-West quadrant, hereafter “receding X-ray jet”) lies at position angle (PA, measured counterclockwise from due North from the
point source) intervals 286∘-295∘ and
307∘-324∘. A knot appears also at PA and its identification will be
discussed in the next sub-section. On the side of the approaching radio jet (South - East quadrant) we see one main
X-ray blob in a PA interval 88∘-152∘ (elongated along a North-East - South-West direction,
hereafter “approaching X-ray jet”),
at a distance from the point source between 28” and 38”. Other minor blobs appear in the residuals image: all of them are
located in the South - East quadrant and are consistent with being knots of the approaching X-ray jet.
|
2.2 Comparison with previously detected X-ray extended structure and the radio jet
The radio nebula and the relativistic radio-jets of Cir X-1 have been investigated during multiple epochs of radio
observations, both on arcmin and arcsec scale (Stewart et al. 1993, Fender et al. 1998,
Fender et al. 2004, Tudose et al. 2006, Tudose et al. 2008). From those papers, we estimate the corresponding PAs for
the arcmin-scale jets: and for the jets in Stewart et al. (1993) and Tudose et
al. (2006) respectively and for the ultrarelativistic jets in Fender et al. (2004).
All these angles are consistent with the PAs of the X-ray jets in our HRC-I observations and fall between
the two X-ray filaments detected by Heinz et al. (2007) in the HETGS image.
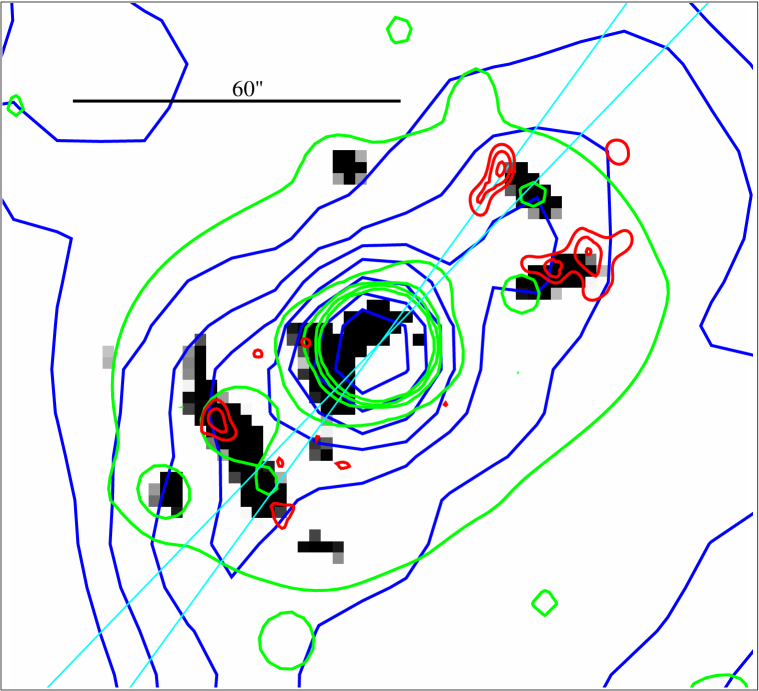
Figure 4 shows an overlay of the residuals image (the same as Figure 2 panel (d),
grey scale), the X-ray contours from Figure 2 panel (c) and the jet emission from
Figure 1 of Heinz et al. (2007). Also shown are the radio contours from Figure 3 of Tudose et al.
(2006) and the limits on the PA for the arcsec-scale jet (Fender et al. 2004). The X-ray jets detected
in the HRC-I images are broadly consistent with the X-ray excess of Heinz et al. (2007). Besides the X-ray knot that
we detected
at PA 10∘, the consistency between the X-ray and the radio jets is clear on both sides
(approaching and receding): what we see in the HRC-I images appears as the X-ray counterpart of the radio
jets from Cir X-1.
|
3 Discussion and conclusions
The analysis of our two HRC-I observations of Cir X-1 clearly showed X-ray jets both on the side of the receding and the approaching radio jet, consistent with being the X-ray counterpart of the arcmin-scale radio jets (Tudose et al. 2006). Heinz et al. (2007) proposed two possible alternative explanations for the origin of the X-ray excess: synchrotron emission and thermal bremsstrahlung. We now investigate whether these two mechanisms can still explain the X-ray jets as observed by HRC-I.
Synchrotron emission: HRC-I does not have the energy resolution necessary to allow for spectral fitting, instead we calculate the jet flux with webPIMMS111http://heasarc.nasa.gov/Tools/w3pimms.html using, as input spectrum, the absorbed power law fitted in Heinz et al. (2007) (, cm-2) and the average count rate extracted, for obs. A, in the region corresponding to the main knot of the approaching jet, using Ciao 4.0. This gives an un-absorbed flux erg cm-2 s-1, corresponding to an X-ray luminosity erg s (throughout the paper we adopt a distance from the source kpc, the same adopted in Heinz et al. 2007, to make comparisons easier). The used photon index is broadly consistent with the emission being of synchrotron origin (); assuming a source volume , a specific luminosity and a spectrum of the form , (), we can follow Longair (1994) and Fender (2006) to estimate the minimum energy associated with the source. The morphology of the jet suggests that we are observing the surface of a conical volume where the emission takes place. Considering the jet length to be roughly pc (where is the angle with the line of sight) and a half-opening angle the volume of the emitting cone is cm, assuming equal emitting volumes both on the receding and on the approaching side. Under these assumptions the minimum jet energy is erg. Again following Longair (1994) and Fender (2006), we can calculate the magnetic field associated to , the Lorentz factor of the energetic electrons emitting by synchrotron and their gyro-radius : G, and pc. The energy of these electrons is eV and their energy loss rate is eV/s: considering that we have no evidence for re-acceleration taking place, the lifetime of these electrons is yr. Following Tudose et al. (2006), we assume that the jets are injected mainly during the flare states (duty cycle 6%): the resulting minimum jet power is erg/s.
Thermal bremsstrahlung: in this case the X-rays would originate from the shock driven into the ISM by the propagation of the jets. Here we use a model developed for extragalactic jet sources by Castor et al. (1975), Kaiser & Alexander (1997) and Heinz et al. (1998). We assume the temperature of the thermal gas to be keV ( keV and cm-2 are obtained by Heinz et al. 2007 fitting the jet spectrum with an absorbed thermal model), the electron density to be cm-3 (as used in Heinz et al. 2007; since the temperature MK we assume an ionization fraction x=1: all the hydrogen is ionized) and the length of the shock region (considering both receding and approaching side) pc. Such length and the used density give an emitting gas mass of 0.02-0.4 : uncertainties are due to different possible measures of the thickness of the shock region. Following Kaiser & Alexander (1999) and balancing the interior pressure exerted by the jets and the ram pressure of the shocked ISM, the jet lifetime is yr ( is the velocity of the shock-compressed particles, obtained from the shock temperature keV) and the jet power is erg/s.
Discussion: In the synchrotron case the jet lifetime is smaller than the time expected for the jet to
inflate the large-scale radio lobe ( yr, Tudose et al. 2006) and this suggests that the X-ray emission could
come from the jet itself rather than from the inflated radio nebula. Furthermore, the
gyro-radius of the electrons responsible for the X-rays is smaller than the size of the jet () and this implies
that those electrons can be confined in the jet region.
Our jet power value is consistent with the estimate of Tudose et al. (2006) ( erg/s, which however
could be up to two order of magnitude higher) and one order of magnitude smaller than the jet power calculated by Heinz et al.
(2007) ( erg/s). The magnetic field associated to the emitting electrons is again consistent with the value reported in Tudose
et al. (2006) (G), making a robust estimate of the jet power, sufficient to inflate the
radio nebula. is % of the Eddington luminosity ( erg/s)
for a 1.4 neutron star: Cir X-1 is only slightly super-Eddington and this would imply a jet-production
efficiency 0.01%, consistent with what obtained by Heinz et al. 2007 ( %).
In the thermal bremsstrahlung case we calculated a jet power erg/s, two orders of magnitude
larger than and possibly not consistent with the values estimated by Heinz et al. (2007)
( erg/s). Furthermore, is a significant fraction (%) of the Eddington
luminosity ( erg/s) for a 1.4 neutron star
and this would be an extremely high jet-production efficiency 3%, even for an accreting black hole.
Taking an Eddington-limit mass accretion rate g s-1 and even considering that all the accreted mass is
ejected in an outflow, the time required to inflate the jets would be 2.7 Myr, much bigger than
yr, suggesting that the emission can not come from the jet itself.
Therefore thermal bremsstrahlung appears as an unlikely emission mechanism (especially compared to the synchrotron
case) for the X-ray jets.
Acknowledgments
The authors thank Harvey Tannanbaum for scheduling the DDT observations and Alessandro Patruno and David Russell for very useful comments and discussion. PS would also like to thank Nanda Rea, Simone Migliari and the Chandra Help Desk for very useful suggestions on the Chandra data analysis. PS and PGJ also acknowledge support from NWO.
References
- (1) Angelini, L., White, N. E., 2003, ApJL, 586, L71
- (2) Boutloukos, S., van der Klis, M., Altamirano, D., Klein-Wolt, M, Wijnands, R., Jonker, P. G., Fender, R. P., 2006, ApJ, 653, 1435
- (3) Carter, C., Karovska, M., Jerius, D., Glotfelty, K., Beikman, S., 2003, in ASP Conf. Ser. 295, Astronomical Data Analysis Software and Systems XII, ed. H. E. Payne, R. I. Jedrzejewski & R. N. Hook, (San Francisco: ASP), 477
- (4) Castor, J., McCray, R., Weaver, R., 1975, ApJL, 200, L107
- (5) Corbel, S., Fender, R. P., Tzioumis, A. K., Tomsick, J. A., Orosz, J. A., Miller, J. M., Wijnands, R., Kaaret, P., 2002, Science, 298. 196
- (6) Corbel, S., Kaaret, P., Fender, R. P., Tzioumis, A. K., Tomsick, J. A., Orosz, J. A., 2005, ApJ, 632, 504
- (7) Fender, R., Spencer, R., Tzioumis, T., Wu, K., van der Klis, M., van Paradijs, J., Johnston, H., 2005, ApJL, 506, L121
- (8) Fender, R., Wu, K., Johnston, H., Tzioumis, T., Jonker, P., Spencer, R., van der Klis M., 2004, Nat, 427, 222
- (9) Fender, R., 2006, in W. Lewin & M. van der Klis eds., Compact Stellar X-ray Sources. Cambridge Univ. Press, Cambridge, p. 381
- (10) Freeman, P. E., Doe, S., Siemiginowska, A., 2001, SPIE, 4477, 76
- (11) Fruscione, A. et al., 2006, SPIE, 6270
- (12) Glass, I. S., 1978, MNRAS, 183, 335
- (13) Glass, I. S., 1994, MNRAS, 268,742
- (14) Haynes, R. F., Jauncey, D. L., Murdin, P. G., Goss, W. M., Longmore, A. J., Simons, L. W. J., Milne, D. K., Skellern, D. J., 1978, MNRAS, 185, 661
- (15) Heinz, S., Reynolds, C. S., Begelman, M. C., 1998, ApJ, 501, 126
- (16) Heinz, S., Schulz, N. S., Brandt, W. N., Galloway, D. K., 2007, ApJL, 663, L93
- (17) Iaria, R., Spanò, M., Di Salvo, T., Robba, N. R., Burderi, L., Fender, R., van der Klis, M., Frontera, F., 2005, ApJ, 619, 503
- (18) Jonker, P. G. & Nelemans, G., 2004, MNRAS, 354, 355
- (19) Jonker, P. G., Nelemans, G., Bassa, C. G., 2007, MNRAS, 374, 999
- (20) Kaiser, C. R., Alexander, P., 1997, MNRAS, 286, 215
- (21) Kaluzienski, L. J., Holt, S. S., Boldt, E. A., Serlemitsos, P. J., 1976, ApJL, 208, L71
- (22) Longair, M. S., 1994, High Energy Astrophysics. Cambridge Univ. Press, Cambridge
- (23) Margon, B., Lampton, M., Bowyer, S., Cruddace, R., 1971, ApJL, 169, L23
- (24) Moneti, A., 1992, A&A, 260, L7
- (25) Murdin, P, Jauncey, D. L., Lerche, I., Nicolson, G. D., Kaluzienski, L. J., Holt, S. S., Haynes, R. F., 1980, A&A, 87, 292
- (26) Murray, S. S., Chappell, J. H., Kenter, A. T., Kraft, R. P., Meehan, G. R., Zombeck, M. V., 1998, SPIE, 3356, 974
- (27) Nicolson, G. D., Glass, I. S., Feast, M. W., 1980, MNRAS, 191, 293
- (28) Parkinson, P. M. S., Tournear, D. M., Bloom, E. D., Focke, W. B., Reilly, K. T., Wood, K. S. Ray, P. S., Wolff, M. T., Scargle, J. D., 2003, ApJ, 595, 333
- (29) Shirey, R. E., Bradt, H. V., Levine, A. M., 1999, ApJ, 517, 472
- (30) Stewart, R. T., Caswell, J. L., Haynes, R. F., Nelson, G. J., 1993, MNRAS, 261, 593
- (31) Tennant, A. F., Fabian, A. C., Shafer, R. A., 1986a, MNRAS, 219, 871
- (32) Tennant, A. F., Fabian, A. C., Shafer, R. A., 1986b, MNRAS, 221, 27P
- (33) Tudose, V., Fender, R. P., Kaiser, C. R., Tzioumis, A. K., van der Klis, M., Spencer R. E., 2006, MNRAS, 372, 417
- (34) Tudose, V., Fender, R. P., Tzioumis, A. K., Spencer, R. E., van der Klis, M., 2008, arXiv0807.5108
- (35) Whelan, J. A. J., Mayo, S. K., Wickramasinghe, D. T. Murdin, P. G., Peterson, B. A., Hawarden, T. G., Longmore, A. J., Haynes, R. F., Goss, W. M., Simons, L. W., Caswell, J. L., Little, A. G., McAdam, W. B., 1977, MNRAS, 181, 259
- (36) Wise, M., 1997, Chandra News, 5, 22
- (37) Zombeck, M. V., Chappell, J. H., Kenter, A. T., Moore, R. W., Murray, S. S., Fraser, G. W., Serio, S., 1995, SPIE, 2518, 96