The Fate of Substructures in Cold Dark Matter Haloes
Abstract
We use the Millennium Simulation, a large, high resolution N-body simulation of the evolution of structure in a CDM cosmology, to study the properties and fate of substructures within a large sample of dark matter haloes. We find that the subhalo mass function departs significantly from a power law at the high mass end. We also find that the radial and angular distributions of substructures depend on subhalo mass. In particular, high mass subhaloes tend to be less radially concentrated and to have angular distributions closer to the direction perpendicular to the spin of the host halo than their less massive counterparts. We find that mergers between subhaloes occur. These tend to be between substructures that were already dynamically associated before accretion into the main halo. For subhaloes larger than times the mass of the host halo, it is more likely that the subhalo will merge with the central or main subhalo than with another subhalo larger than itself. For lower masses, subhalo-subhalo mergers become equally likely to mergers with the main subhalo. Our results have implications for the variation of galaxy properties with environment and for the treatment of mergers in galaxy formation models.
keywords:
cosmology: theory – dark matter – galaxies: halos – interactions1 Introduction
The presence of substructures within dark matter haloes is a distinctive signature of a universe where structures grow hierarchically. Low mass objects collapse at high redshift, and then increase their mass by smooth accretion of dark matter or by merging with other haloes. Once a halo is accreted by a larger one, its diffuse outer layers are rapidly stripped off by tidal forces. However, the core, which is much denser, generally survives the accretion event and can still be recognized as a self bound structure or subhalo within the host halo for some period of time afterwards.
In early N-body simulations, haloes appeared as fairly smooth objects (Frenk et al., 1985, 1988). However, as the attainable mass and force resolution has increased, subhaloes have been identified and their properties studied in detail by many authors over the past decade (e.g. Ghigna et al., 1998, 2000; Tormen et al., 1998; Moore et al., 1999; Klypin et al., 1999b, a; Springel et al., 2001; Stoehr et al., 2002; De Lucia et al., 2004; Gao et al., 2004; Nagai & Kravtsov, 2005; Shaw et al., 2007; Diemand et al., 2008; Springel et al., 2008). The properties of the subhalo population have important implications for galaxy formation, dark matter detection experiments and weak lensing. For instance, subhaloes are expected to host satellite galaxies within groups and clusters and their evolution once inside the host could give rise to observable changes. In particular, a merger between two substructures could trigger an episode of star formation or a morphological transformation (e.g. Somerville & Primack, 1999).
In spite of this, the merger history of subhaloes remains relatively unexplored. This is a challenging problem which demands a simulation with high mass and force resolution. In particular, obtaining a statistical sample of mergers involving the largest substructures requires a large sample of host haloes. Most studies of substructure in halos have focused on resimulating, at very high resolution, a small number of halos selected from a larger, lower resolution simulation. However, by studying only a few haloes, important aspects related to variations produced by differences in the accretion and merger histories of haloes, as well as any influence of the environment, could remain hidden. This approach may also introduce systematic biases arising from the criteria used to select the haloes to be resimulated.
In this paper, we overcome these problems by using the largest dark matter simulation published to date, the Millennium Simulation (MS, Springel et al. 2005). The MS provides a large cosmological sample of dark matter haloes and associated substructures spanning a considerable range in mass, allowing us to assess robustly the properties and fate of the subhalo population. We complement our results with a higher resolution simulation of a smaller volume (hereafter HS) which has a particle mass almost ten times smaller than that used in the MS (Jenkins et.al, in prep).
The layout of this paper is as follows. In Section 2, we briefly describe the simulations used in this work along with the properties of our halo and subhalo catalogues. In Section 3 we investigate some general properties of subhaloes, namely their mass function, radial distribution and spatial orientation with respect to their host halo. The exploration of substructure mergers and destruction is presented in Section 4. Finally, we summarize our findings in Section 5.
2 Method
In this section we describe the N-body simulations we have analyzed in this work. We also discuss the identification and characterization of the halo and subhalo catalogues.
2.1 N-body Simulations
The main simulation on which our analysis is based is the Millennium Simulation (Springel et al., 2005). The MS covers a comoving volume of of a CDM universe in which the dark matter component is represented by particles. The assumed cosmological parameters are in broad agreement with those derived from joint analyses of the 2dFGRS galaxy clustering (Percival et al., 2001) and WMAP1 microwave background data (Spergel et al., 2003; Sánchez et al., 2006), as well as with those derived from WMAP5 data (Komatsu et al., 2008). In particular, the total mass-energy density, in units of the critical density, is , where the two terms refer to dark matter and baryons, with ; the amplitude of the linear density fluctuations in spheres is ; and the Hubble constant is set to . The particle mass is and the Plummer-equivalent softening of the gravitational force is .
To complement our results and to test for numerical effects we have also employed another simulation with better mass resolution to which we refer as HS. This simulation follows dark matter particles in a CDM cube of side . The HS assumes the same cosmological parameters as the MS. However, the smaller box yields a smaller particle mass, , so objects of a given mass are resolved with almost 10 times more particles than in the MS. Finally, in the HS the softening length is .
The MS and HS were carried out using a memory efficient version of the Gadget-2 code (Springel, 2005).
2.2 Halo and Subhalo catalogues
In both simulations, particle positions and velocities are written at 64 output times which, for , are roughly equally spaced in time by Myr. In each of these outputs we have identified dark matter haloes using the friends-of-friends (FoF) algorithm (Davis et al., 1985), with a linking length of 0.2 times the mean interparticle separation. The volume and particle number of the MS provide a unique resource of well resolved haloes to study. By way of illustration, there are haloes at with mass in excess of (one of the bins we use below), which corresponds to particles; at the number of haloes in excess of this mass is still . On the cluster-mass scale, for example, there are haloes at which are more massive than , corresponding to particles.
Well resolved FoF haloes are not smooth, but contain a considerable amount of mass in the form of substructures. These dark matter clumps or “subhaloes” are identified and catalogued using a modified version of the subhalo finder algorithm, SUBFIND, originally presented in Springel et al. (2001). The statistics of the subhalo catalogue are impressive. At SUBFIND lists structures with more than 200 particles in the MS within haloes of at least . At there are substructures with the same characteristics. Note that SUBFIND not only finds substructures within a FoF halo, but it is also capable of identifying substructures within substructures.
An important issue for studies of substructures is the definition of the boundary and position of the host halo. In our analysis, the centre of the halo is defined as the position of the most bound particle (i.e. usually the one possessing the minimum gravitational potential). This choice for the halo position agrees, within the softening length, with that found by a shrinking sphere algorithm (Power et al., 2003) for 93% of the haloes that are resolved with 450 or more particles. As shown by Neto et al. (2007), the 7% of cases in which the two methods disagree are due to the FoF algorithm artificially linking multiple structures. In these cases the position of the most bound particle provides a more robust identification of the centre, as noted by Neto et al. (2007).
We define the halo boundary as the sphere of radius which contains a mean density of 200 times the critical density, . Therefore, the mass of the halo is:
| (1) |
We keep in our catalogues only subhaloes within this sphere. Although the choice of the factor of 200 is motivated by the spherical collapse model in a Einstein-de-Sitter universe, it is somewhat arbitrary for our CDM simulations. However, the definition has the advantage of being independent of both redshift and cosmology. Moreover, it has became a de facto standard in studies of substructures. Nevertheless, we have tested our results against other definitions of the halo boundary without finding any qualitative differences. In the following, when we refer to the mass and radius of a host halo, we always mean and .
Finally, we build merger trees using an algorithm similar to that described by Springel et al. (2005) which follows the evolution of subhaloes. In this way, we can identify the haloes and subhaloes that will be involved in a merger during a subsequent snapshot. Note that these merger trees are constructed using only the information contained in the FoF and SUBFIND catalogues, and there is no attempt to force mass conservation, as would be required if the merger trees were to be used in a galaxy formation code (see Harker et al., 2006). The descendant of a subhalo is defined as the structure that contains the majority of the 10 percent most bound particles from the subhalo. When two satellite subhaloes have the same descendant in a following snapshot, we tag such an event as a substructure merger.
3 SubHalo properties
Before presenting our results regarding subhalo mergers, we consider some general properties of the subhalo population. Although some of these properties have been studied by previous authors, the large volume and high resolution of the MS and HS reveal some features which were inaccessible to earlier work. Furthermore, the knowledge of the subhalo properties will help us to understand the results presented in the next section.
3.1 Subhalo mass function
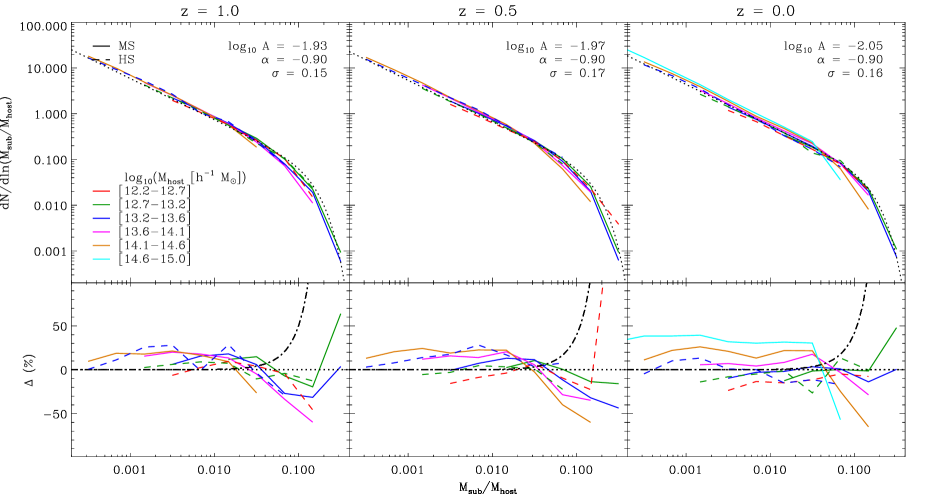
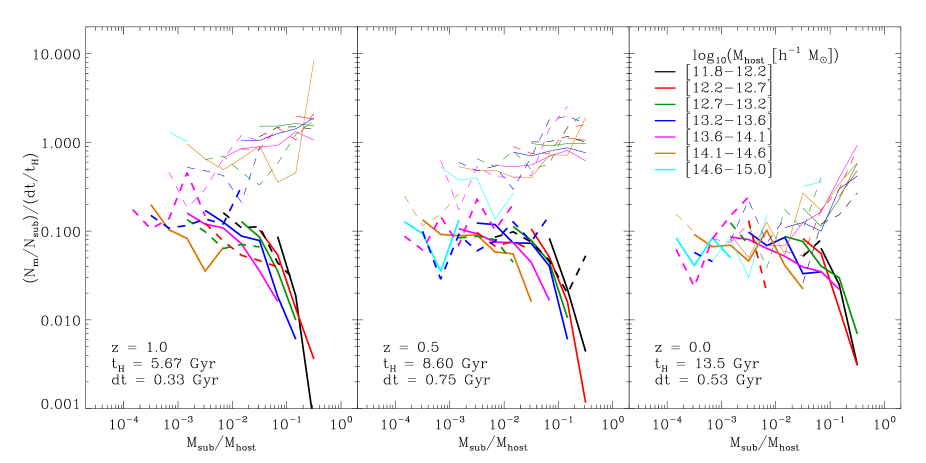
We first consider the distribution of subhalo masses - the subhalo mass function. The top panels of Fig. 1 show the mean number of substructures within dark matter haloes, per host halo, per logarithmic interval in subhalo mass. The results are displayed as a function of subhalo mass relative to the mass of the halo in which it resides, . In this way we can easily compare results across a range of halo masses. In the ranges of overlap, the results from the MS and HS agree well; this provides a useful, but limited, test of the convergence of our results.
For the redshifts plotted in Fig. 1 there is only a small variation of the subhalo mass function with host halo mass. Indeed, a universal function describes the behaviour reasonably well over the range of subhalo mass resolved by our simulations:
| (2) |
where is the number of subhaloes per host halo. The values of , and in this overall fit at each redshift are given in the legend of Fig. 1. For this overall fit, we have forced the slope to have the same value independently of redshift. In general, we find that is a good approximation to the best fit from to . It is also important to note that the power-law fit widely used in the literature, (e.g. Gao et al. 2004) is only valid over a limited range of fractional subhalo masses, . We also see that the maximum subhalo mass for which a power-law successfully describes the mass function decreases at higher redshifts, at and at . The bottom panels of Fig. 1 show the relative difference between the fit given by Eq. (2) and the mass function of subhaloes measured in host haloes of different masses.
| [] | |||||
| MS | |||||
| HS | |||||
We have also fitted Eq. 2 to the subhalo mass functions in each halo mass bin, this time letting the slope vary; we list the best-fit parameters for in Table 1. At the low fractional mass end, where the subhalo mass function behaves as a power-law, we generally find slopes that are lower than the critical value, (which separates divergent from convergent mass functions). The slopes we find are in broad agreement with previous estimates of the power-law index of the subhalo mass function, which range from to (Moore et al., 1999; Ghigna et al., 2000; De Lucia et al., 2004; Gao et al., 2004; Diemand et al., 2004; Shaw et al., 2007; Diemand et al., 2007). In particular, our results agree with those from the much higher resolution simulations of individual galactic halos of Springel et al. (2008), but are inconsistent with the steeper slope advocated, also for galactic halos, by Diemand et al. (2008).
At the high mass end, the subhalo mass function departs from a power-law and decreases exponentially. This behaviour was previously detected in N-body simulations (at lower significance) by Giocoli et al. (2008) (and predicted analytically by van den Bosch et al. 2005). However, this feature was not apparent in earlier studies which used resimulations of individual haloes. Resimulations of single objects have the advantage that computational effort can be focused. A halo can be resolved with a vast number of particles and its substructures identified over a large range of masses. Unfortunately, this approach comes at the price of losing the rich information contained in the variety of assembly histories, relaxation states and, more importantly, the population of high mass subhaloes. As can be seen from Fig. 1, the abundance of these objects is much lower than that of smaller subhaloes – usually we would find just a few in each halo. Because these halos are so rare, the damping of the power-law at high is missed in individual resimulations. By contrast, with the huge sample of haloes and their massive subhaloes in our analysis, we can robustly probe this subhalo mass range.
Even though the subhalo mass function appears roughly universal (e.g. Moore et al. 1999), we have detected at every redshift a small dependence on the mass of the host system. Small substructures of the same fractional mass are more abundant in high mass haloes than in low mass haloes. This correlation has also been seen in a number of other studies (e.g. Gao et al., 2004; Shaw et al., 2007; Diemand et al., 2007). However, we also find evidence that this trend holds only in the power-law region of the subalo mass function and actually reverses at the high mass end - low mass haloes seem to host relatively more massive subhaloes than do high mass haloes.
Perhaps surprisingly, the variety of features present in the mass function of subhaloes is consistent with a relatively simple picture. There are two key ingredients that shape the subhalo mass function: (i) the mass function of infalling objects and (ii) the dynamical evolution of subhaloes orbiting within the host halo due to dynamical friction and tidal stripping. The first of these is responsible for the universality described above and sets the subhalo mass function to first order. As first found by Lacey & Cole (1993) using the extended Press Schechter formalism, and confirmed by Giocoli et al. (2008) using N-body simulations, the mass function of subhaloes at infall is almost independent of host halo mass and redshift when expressed as a function of , and can be described as a power-law with a high mass cut-off.
After subhaloes fall into a host halo, their orbits sink due to dynamical friction and, at the same time, the subhaloes lose mass due to tidal stripping. These processes cause the subhalo mass function to evolve away from its form at infall. The rates for these processes depend on the fractional mass of the subhalo, , and on the dynamical timescale of the host halo. Therefore, if all haloes had identical structure and assembly histories, these processes would preserve a universal form for the subhalo mass function, independently of . However, haloes of different masses on average assemble at different redshifts in spite of the similar mass function of subhaloes at infall, and this breaks the universal shape of the subhalo mass function, as discussed by van den Bosch et al. (2005) and Giocoli et al. (2008). On average, massive haloes are younger than their less massive counterparts and they are more likely to have experienced recent mergers (Lacey & Cole, 1993). These provide a fresh source of substructures which have had less time for orbit decay due to dynamical friction and to be tidally stripped. High mass haloes are therefore expected to have more substructures than low mass haloes. Another effect which acts in the same direction is that small haloes tend to accrete their subhaloes at higher redshifts when dynamical timescales are shorter. As a result, they strip out mass from the substructures more quickly than large haloes, where massive substructures can survive for longer.
3.2 Most massive subhaloes
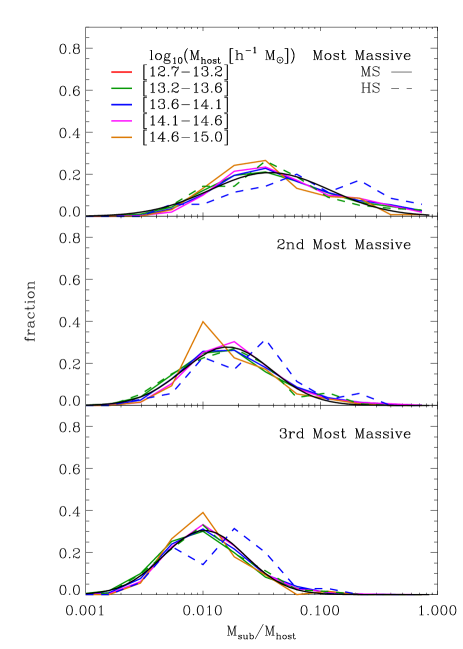
The high-mass tail of the distribution of substructure is examined in greater detail in Fig. 2. The three panels in this plot display the distribution of the fractional mass, , for the first, second and third largest substructures within haloes of different mass at . As before, results from the MS and HS agree very well.
In contrast to the results presented in the previous subsection, the distributions of fractional masses seem to be independent of the host halo mass. (We have also checked that they are independent of redshift.) In particular, in every halo, the fractional masses follow a log-normal distribution with mean , and , and standard deviation , and for the each of the three largest subhaloes respectively. Albeit with considerable scatter, these values imply that the most massive substructure contains typically of the total mass of the halo while the second and third most massive subhaloes contain and of the mass respectively.
Due to the large dispersions, the distributions can only be measured reliably in haloes resolved with a large number of particles. For instance, the mean fractional mass of subhaloes is overestimated for haloes resolved with fewer than particles (the exact limit depends on the scatter and mean of the true distribution), i.e. in the MS and in the HS. The upward bias is caused by the finite resolution of the simulations (there is a limit on the smallest subhalo that we can identify) which truncates the low mass tail of the distribution of fractional masses.
Hints of a universal behaviour of the fractional masses of the largest subhaloes were already detected by De Lucia et al. (2004) (although they claim a weak dependence with host halo mass). Our results are broadly consistent with theirs but, with the large halo catalogues from the MS and HS, we are able to probe the full probability distribution function robustly.
The apparently universal shape of these distributions could, in principle, be understood within the broad picture just discussed. Presumably it reflects the distribution of masses of the infalling haloes which, as we have seen, is independent of the host halo mass (Lacey & Cole, 1993; Giocoli et al., 2008). The large scatter must then result from the large range of accretion histories at a given host halo mass. We leave further investigation of these ideas for future work.
3.3 Radial distribution of subhaloes
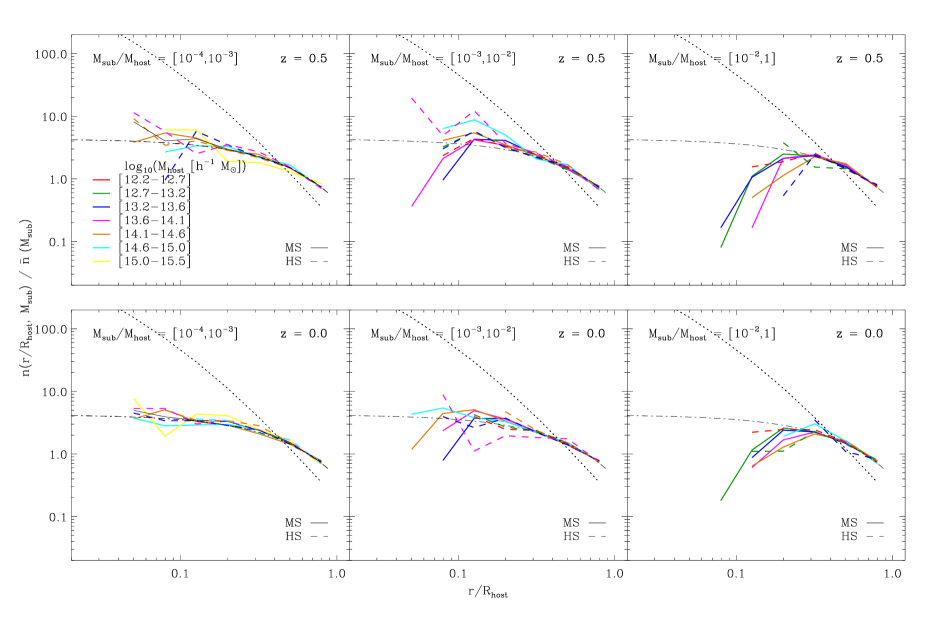
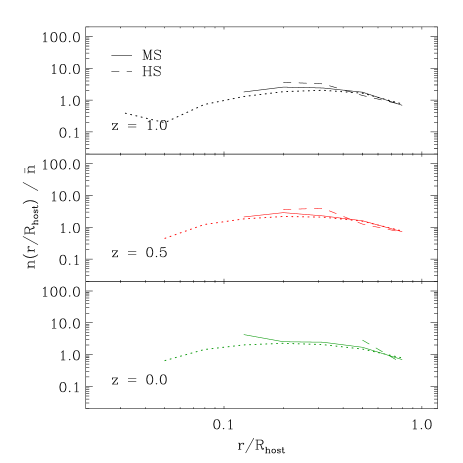
Fig. 3 shows the number density of subhaloes as a function of radius, relative to the mean number density of substructures within in the same fractional mass range. Each panel focuses on substructures of different masses, from small subhaloes () in the leftmost panel to large ones () in the rightmost panel. As in previous plots, lines of different colours show results for subhaloes that reside in haloes of different mass, and the different line types (solid and dashed) indicate the results for the two simulations. We also plot the radial profile of the dark matter as a black dotted line in each panel.
Comparison of the MS and HS indicates that our results are insensitive to the mass resolution (although the overlap between the two simulations is limited). As in previous studies (e.g. Gao et al. 2004), we find that the radial distribution has little dependence on the host halo mass at a given . This is quite remarkable since each panel mixes subhaloes that: (i) are resolved by numbers of particles that differ by orders of magnitude and (ii) occupy haloes which are in a variety of dynamical states (age, relaxation, etc). We also see that in all cases, the radial distribution of subhaloes is less centrally concentrated than the dark matter, as was also found in previous studies (e.g. Ghigna et al., 1998, 2000; Gao et al., 2004; Diemand et al., 2004; Nagai & Kravtsov, 2005; Shaw et al., 2007; Springel et al., 2008).
In addition, we see a significant difference between the distribution of massive subhaloes () and that of small ones (). While the overall radial profiles seem to be fairly independent of subhalo mass, the more massive subhalos tend to avoid the central regions of the host halo, while the less massive ones have a more centrally concentrated distribution (see also De Lucia et al., 2004). However, the distributions agree in the outer parts of the halo. Springel et al. (2008) found a similar effect to ours in the Aquarius set of simulations of galactic halos which, although limited in number, span a huge dynamic range in subhalo mass.
These dissimilar density profiles for different subhalo masses have a simple dynamical explanation (e.g. Tormen et al., 1998; Nagai & Kravtsov, 2005). Once a halo falls into a more massive system, dynamical friction and tidal striping start to act. The accreted subhalo will rapidly be stripped of its outer layers and will lose a significant fraction of its mass during the first pericentric passage. This mechanism naturally differentiates the radial distribution of substructures of different masses: massive structures sink more rapidly due to dynamical friction and, as a result, also lose mass more quickly by tidal stripping. Therefore they do not survive long in the central regions, in contrast to small subhaloes. The massive subhaloes which are present in the halo must have been accreted more recently than the average low mass subhalo. The timescale for dynamical friction depends on the relative mass of the subhalo and its host halo, not on their absolute values, which would explain the approximate independence of the distribution on the host halo mass.
3.4 Angular distribution of subhaloes
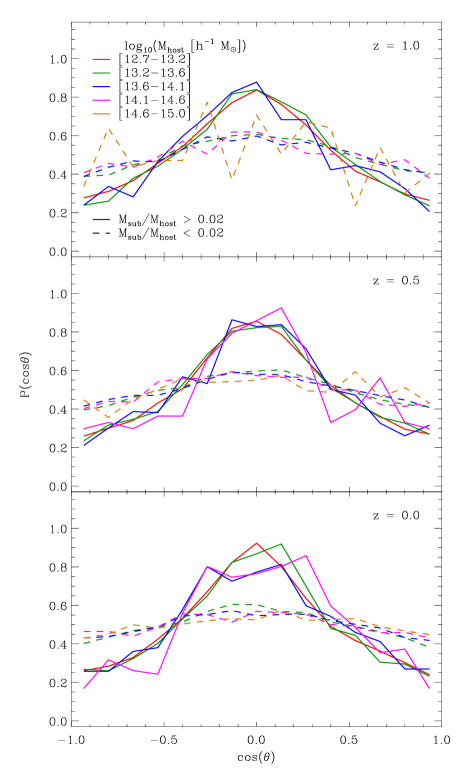
To end this section we investigate the angular distribution of subhaloes within dark matter haloes. Previous work has examined the relationship between the angular distribution of substructures and the shape of the host halo (Tormen, 1997; Libeskind et al., 2007; Knebe et al., 2008a, b). Here, we examine instead the orientation relative to the spin axis of the host halo. Fig. 4 shows the probability distribution function of the cosine of the angle between the angular momentum vector of the host halo and the vector joining its centre with that of the subhalo. We show results for two separate ranges of subhalo mass: subhaloes with mass smaller than of the host halo mass (dashed lines) and those with masses greater than (solid lines). We distinguish different host halo masses by different colours, and show different redshifts in different panels. Note that we only display results for the MS simulation for clarity.
As shown by Bett et al. (2007), the accuracy of the measurement of spin direction in the MS degrades significantly (uncertainty ) for haloes resolved with fewer than particles or for those where the spin magnitude, , is such that:
| (3) |
where is Newton’s gravitational constant. Although the inclusion of haloes that do not satisfy these criteria does not seem to affect our results quantitatively, we have chosen to show only those haloes that met these requirements, so that the angle relative to the spin axis can be reliably determined.
We see from Fig. 4 that the angular distribution of subhaloes tends to be aligned perpendicular to the spin axis of the host halo. (We remind the reader that in this plot, an isotropic angular distribution would correspond to a horizontal line, while a distribution aligned at to the spin axis will peak around .) The strength of this alignment effect depends on the fractional subhalo mass, , being much stronger for higher mass subhaloes. We also see that the angular distribution for a given is almost independent of the host halo mass and the redshift (see also Kang et al. 2007).
We can understand this behaviour qualitatively as reflecting the growth of haloes by the accretion of dark matter (in halos or more diffuse form) along filaments. The central regions of haloes acquire most of their angular momentum at a relatively late stage from the orbital angular momentum of this infalling material, and so will tend to have spin axes perpendicular to the current filament (e.g Shaw et al., 2006; Aragón-Calvo et al., 2007). On the other hand, insofar as the subhaloes “remember” the direction from which they fell in once they are orbiting inside the host halo, then their spatial distribution will tend to be aligned with the filament from which they were accreted, and so will be perpendicular to the spin axis. We can also understand the dependence of the strength of this alignment on subhalo mass in this picture. Subhaloes with large on average have been orbiting in the host halo for less time than haloes of lower , due to the combined effects of dynamical friction (which causes higher mass subhaloes to sink faster) and tidal stripping (which converts high-mass subhaloes to low mass). We expect subhaloes increasingly to lose memory of their initial infall direction the longer they have orbited in the host halo (which in general is lumpy and triaxial). Since high subhaloes have undergone fewer orbits, their current angular distribution should be more closely aligned with their infall direction, and therefore with the current filament, compared to subhaloes of lower mass.
Our results seem generally consistent with previous simulation results on the alignment of the subhalo distribution with the shape of the host halo, and the relationship between the shapes and the spin axes of halos. Tormen (1997) found that the angular distribution of subhaloes as they fall into a host halo (crossing through ) is anisotropic, and tends to be aligned along the major axis of the host halo. Previous studies (e.g. Knebe et al., 2004; Zentner et al., 2005; Libeskind et al., 2007) found that the angular distribution of subhaloes within a host halo is aligned along the major axis of the host halo. On the other hand, Bett et al. (2007) showed that the angular momentum of a halo is generally aligned with its minor axis and perpendicular to its major axis. Putting these results together, we would expect the subhalo distribution to be aligned perpendicular to the spin axis of the host halo, but ours is the first study to demonstrate this directly, and also to demonstrate that the strength of the alignment depends on subhalo mass.
4 Mergers between subhaloes
As we have seen, once a halo is accreted by a larger one, its outer layers are rapidly stripped by tidal forces. However, the core generally survives the accretion event and can still be recognized as a substructure or satellite subhalo within the host halo for some time afterwards. Furthermore, not only may the main infalling halo survive, but also substructures within it. In this case, there are substructures inside substructures.
While orbiting inside the halo, dynamical friction causes the orbit of a subhalo to lose energy and to sink towards the centre of the host halo. As the subhalo sinks, it suffers further tidal stripping. Eventually, the subhalo may be totally disrupted: there is a merger between the satellite subhalo and the central subhalo. Nevertheless, on its way to destruction, a subhalo can survive for several orbits during which it may experience a merger with another satellite subhalo. In the following subsections we will investigate the merging of these substructures.
The interaction between subhaloes was previously investigated in cosmological simulations by Tormen et al. (1998), who studied the rate of penetrating encounters between satellite subhaloes, but not the merger rate. Makino & Hut (1997) derived an expression for the merger rate between subhaloes in galaxy clusters based on an entirely different approach, motivated by the kinetic theory of gases. In this case, the merger rate per unit volume between halos of mass and is , where and are the respective number densities, is the relative velocity, and is the merger cross-section. They used N-body simulations of isolated spherical halos to derive merger cross-sections for equal-mass halos as a function of their relative velocity, and then assumed that mergers in clusters occurred between pairs of subhaloes drawn from random uncorrelated orbits, with a Maxwellian distribution of relative velocities. The Makino & Hut expression was then extrapolated to the case of unequal subhalo masses and incorporated into a semi-analytical model of galaxy formation by Somerville & Primack (1999) and Hatton et al. (2003). We will investigate below whether the Makino & Hut (1997) kinetic theory approach has any applicability to subhalo mergers in a realistic cosmological context.
4.1 Subhalo merger rate
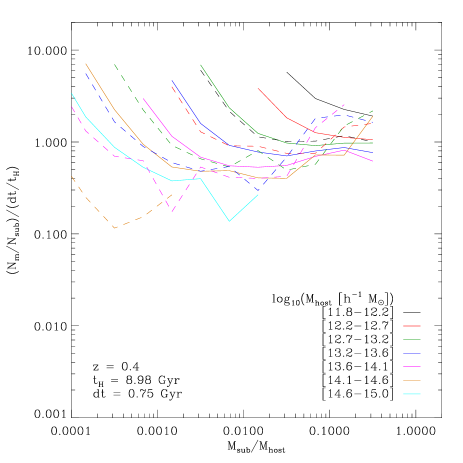
Fig. 5 shows the mean merger rate of satellite subhaloes, plotted against the fractional mass of its progenitor. This is the mass of the satellite before accretion divided by the mass of the host halo at the time of the merger. The rate is normalized per subhalo, with time in units of the age of the universe at that redshift. This normalized rate is thus roughly equal to the probability that a satellite subhalo will merge over one Hubble expansion time. A rate higher than unity indicates that the process happens on a timescale shorter than a Hubble time. There are two sets of curves in this figure: (i) the thinner, higher amplitude lines which show mergers between a satellite and a central subhalo, as a function of the subhalo mass, and (ii) the thick lines which correspond to satellite-satellite mergers, plotted as a function of the mass of the smaller subhalo. As in previous plots, different line colours show different host halo masses, and different line styles (solid and dashed) show the two simulations used.
We see from Fig. 5 that over most of the subhalo mass range resolved by our simulations (for ), it is more likely for a satellite subhalo to merge with the central subhalo than with another more massive satellite subhalo. For instance, at , taking into account all host haloes, there are satellites which merge with a central subhalo over one timestep, while the number of satellites involved in a merger with another satellite over the same period is , a ratio of . The situation is similar at even though the ratio decreases to ( vs ). In general, the likelihood of both merger rates slightly decreases at lower redshifts. This may reflect the slower build-up of structure (relative to the Hubble time) as the universe becomes dominated by vacuum energy.
As we consider smaller subhalo masses, we see a decrease in the destruction rate (see the appendix for a discussion of overmerging effects due to insufficient mass resolution). This may be due to the inefficiency of dynamical friction for low mass structures. On the other hand, there is an increase in the satellite-satellite merger rate as the subhalo mass decreases. Presumably this is due to the increasing number of potential merger partners, reflecting the form of the subhalo mass function. Additionally, the abundance of both types of mergers is similar in the range . Unfortunately, at this point our results from low mass haloes become limited by resolution (i.e. we cannot identify smaller substructures) and the results from high mass haloes become dominated by Poisson noise (i.e. less than one merger event in the whole simulation). Over the range that is reliably covered, we can see no strong systematic differences in Fig. 5 between the results derived from host haloes of different masses. This agreement is quite remarkable given the relatively large dynamical range resolved in the simulations.
A merger between two objects is not always a straightforward quantity to define in numerical simulations. The problem originates from the fact that any definition is intrinsically linked to the mass and time resolution of the simulation. For instance, if in a higher resolution simulation we identify the remnant of a subhalo down to a smaller mass threshold, then the mass ratio of the merger, as well as the time at which it happens, could, in principle, disagree with the values measured in a lower resolution simulation. Similarly, with better time resolution, one could follow the mass loss of a subhalo more accurately which, in principle, could also change the measured mass ratio of the merger. To avoid these problems, we have chosen to use in Fig. 5 the mass of the satellite before accretion, rather than the mass at the moment of the merger.
For all these reasons it is very important to note the agreement in Fig. 5 between the results from the MS (solid lines) and those from the HS (dashed lines). This agreement gives us confidence that our results are not sensitive to mass resolution. (Note that this is not true for subhaloes resolved with fewer particles as shown in the appendix.) Furthermore, the weak dependence of the quantities plotted in Fig. 5 on host halo mass confirms this conclusion. In practice, a subhalo of in a host of exhibits the same behaviour as a subhalo of the same fractional mass but in a halo of even though the latter is resolved with times more particles. This is quite remarkable.
One of the reasons for the insensitivity to mass resolution comes from our definition of a merger (see §2.2). We do not tag an event as a merger when we cannot identify the subhalo anymore, but rather when it has lost a fixed fraction of its most bound mass. This definition responds more to dynamical processes than to numerical ones.
The implications of discrete time measurements are less clear for our definition of a merger. As an example, consider the case of very poor time resolution, and a halo that is just about to fall into a larger one. If tidal forces stripped off more than % of its mass before the next snapshot, then we would have identified this event as a merger. On the other hand, if the time resolution were good enough, we could have identified the subhalo at intermediate stages, updating its mass and the corresponding most bound 10 percent. As long as stripping does not occur on a timescale much shorter than the time resolution, it is even possible to imagine that the line of descendants continues indefinitely. However, since a merger is not a discrete event, better time resolution does not necessarily imply a more accurate determination of a merger. With infinite time resolution, we would follow most of the merging process down to the point when mass resolution becomes important, i.e. every subhalo disruption would be caused by lack of mass resolution.
However, the typical timescale for dynamical friction and tidal disruption is for (Jiang et al., 2008), i.e. much longer than the time spacing of our simulation outputs (Myr). Furthermore, subhalo mergers seem to take place very fast. Both these factors suggest that time resolution is not an issue for this study. In fact, we have checked that our results do not change if we choose snapshots that are twice as widely spaced as those used to build the merger trees. Nevertheless, we advise the reader to keep these limitations in mind.
4.2 Characterization of subhalo-subhalo mergers
In most cases the subhalo-central merger occurs very close to the potential minimum of the host halo. The spatial location of satellite-satellite mergers, on the other hand, has a very distinctive distribution. In the following subsection we investigate this further.
4.2.1 Radial distribution of satellite-satellite mergers
First, in Fig. 6 we look at the spherically averaged radial distribution of satellite-satellite mergers. The figure shows the number density of mergers, relative to the mean density of subhaloes within , as a function of the distance to the centre of the halo. We also display, as dotted lines, the distribution of all the substructures from the MS111At first sight, the distribution of all substructures seems to disagree with the results of Section 3.3. Since the subhalo population is dominated by small mass objects, one would naively expect the distribution of all substructures to follow that of the smallest subhaloes; as seen in Fig. 3, this has a slope which is always negative. However, in practice, the dominant effect is the high abundance of low mass host haloes in which only massive substructures can be resolved. As a result, the distribution of all subhaloes in the MS resembles the distribution of the most massive substructures..
At every redshift plotted, the radial distribution of mergers is proportional to the radial distribution of subhaloes. This implies that most of the mergers between subhaloes do indeed occur in the outer regions of the host halo. Note that in these regions the background density is lower than in the inner regions, making it easier to identify subhaloes. For this reason, we can follow satellite-satellite mergers down to structures resolved with particles, as opposed to the minimum of particles we require for central-satellite mergers.
Our results do not appear consistent with the naive expectation from a gas kinetic theory approach that the number density of mergers should be proportional to the number density of subhalo pairs, i.e . This discrepancy indicates that most of the satellite-satellite mergers do not occur because of random encounters between two unrelated substructures. We investigate this idea further in the following subsection, where we look back at the orbits of the subhaloes that merge.
4.2.2 Orbits of merging satellites
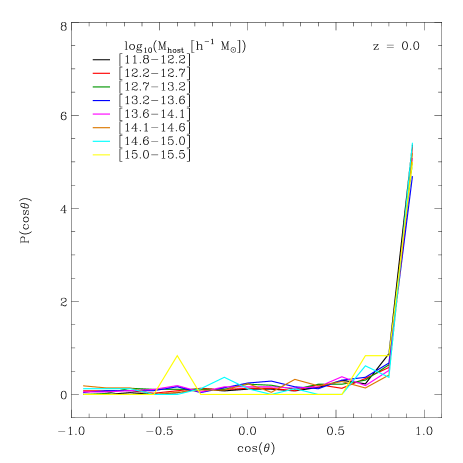
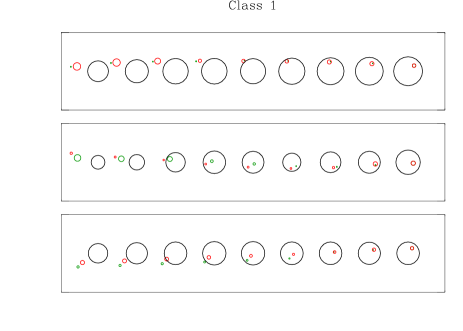
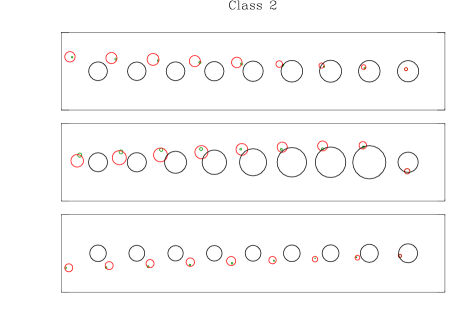
Fig. 7 shows the distribution function of the separation angle between the progenitors of subhaloes involved in a merger. The angle is measured from the centre of the host halo in which the merger is going to take place, at the last snapshot in which both subhaloes were identified outside the halo that later hosts the satellite-satellite merger. It thus represents the angle between the subhaloes at the time they fall into the host halo. The first point to note is that the distribution seems to be universal in the sense that it is roughly independent of the mass of the host halo. (We have also checked that it is roughly independent of redshift.) However, the most important feature is that the distribution is clearly dominated by small separation angles. About % of the mergers occur between subhaloes that were separated by less than at the moment of accretion. (This percentage increases to % for an angle of .) This demonstrates that the mergers are mostly between two or more systems that were already dynamically associated before they fell into the larger system. If the gas kinetic theory approach of Makino & Hut (1997) applied to this case, then the mergers would be between subhaloes on random orbits, and we would expect a more uniform distribution in . (It would not be completely uniform since the subhalo population is not isotropic, as shown in Fig. 4.)
More information about the orbits of merging subhaloes is given in Fig. 8, where we display three representative examples of the two most common configurations of a satellite-satellite merger. These examples correspond to real sequences found in the MS. The plot tracks the position of substructures up to the snapshot of the merger (which happens at the rightmost position), starting on the left, snapshots earlier. We show as a black circle the halo that hosts the satellite-satellite merger and, as green and red circles, the progenitors of the subhaloes involved in the merger. The red circle at the end of the sequence indicates the subhalo resulting from the merger. The radii of the circles are proportional to the half-mass radius of the subhalo.
The two most common configurations are as follows: Class 1: the progenitors of the subhaloes correspond to two separate haloes which were accreted at approximately the same time. Note that, as shown by Fig. 7, these haloes were spatially close at the time of accretion. Class 2: the merger occurs between two substructures that were part of the same halo before it fell into the host halo. In other words, there is a halo that contains two substructures which survived the accretion and subsequently merged. The merger event which started outside the main halo is completed inside it, as a subhalo-subhalo merger.
Most subhalo mergers occur between substructures that are accreted close together both in time and location. Generally, they were already part of the same system before it was accreted into a larger one, or were part of two separate haloes that were about to merge. This is probably a requisite for a subhalo merger to occur. The potential generated by the other satellite has to be at least comparable to that of the main halo. Hence, satellites accreted at different angles will follow relatively independent dynamical histories and are much less likely to merge.
4.2.3 The mass ratio of subhalo mergers
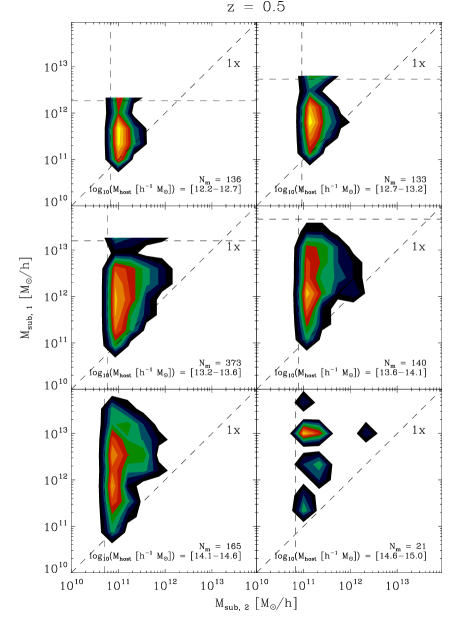
In Fig. 9, we inspect the relative masses of the satellite subhaloes which merge. The -axis indicates the mass of the smaller subhalo and the -axis shows the mass of the larger one. Interestingly, we find that, for the range of host halo masses plotted, the most common merger is that between two substructures of dissimilar masses, . Note that this trend is contrary to the naive expectation whereby the mergers are simply proportional to the abundance of substructures, in which case the maxima would be located around the line . However, it is roughly consistent with the idea that substructure mergers happen between two structures that were part of the same halo before accretion. For instance, if the most common merger happens between the main subhalo and its most massive substructure, then, as we have seen, we would expect to find a mass ratio of 1:25 (see Fig. 2) and the maxima of Fig. 9 along
4.3 Merger probability since accretion
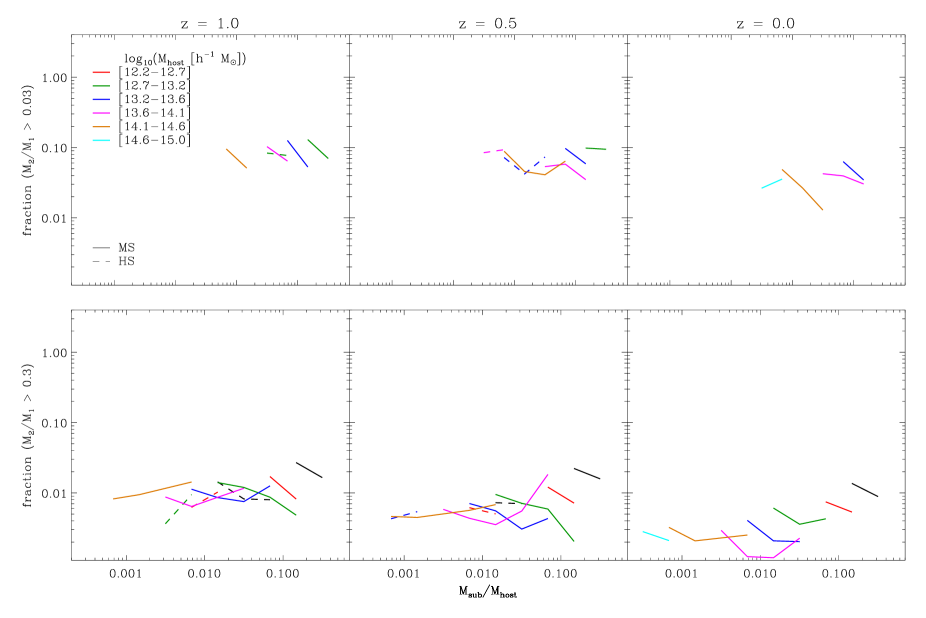
Finally, in Fig. 10 we plot the fraction of subhaloes at a given redshift that have had a merger with another satellite subhalo since accretion into the current host halo. The top panels show mergers between satellites with a mass ratio greater than , i.e. in which the less massive subhalo has, at least, % of the mass of the larger one. In the bottom panels we consider mergers between subhaloes with more similar masses: the minimum mass ratio is .
The fraction of current subhaloes which have experienced a merger in the past is a quantity strongly affected by resolution. For instance, in the history of a subhalo resolved with particles, because of our particle mass cut on subhaloes, we can only record mergers with other subhaloes which account for at least one fifth of the final subhalo mass. On the other hand, if our current subhalo is resolved with particles, then a much wider range of merger mass ratios can be tracked. These considerations are further complicated by the fact that we expect the measured mass of a subhalo to be less than the mass of its progenitors at infall, due to tidal disruption and stripping; hence an object that is below our particle limit at a particular redshift could have been above this mass cut when it experienced the subhalo-subhalo merger.
To improve statistics, whilst at the same time attempting to avoid building a resolution dependence into our results, we relax the particle number constraint on subhaloes for this exercise. At the redshift a subhalo is identified (i.e. the redshift plotted in Fig. 10), we consider subhaloes of particles or more. At the redshift of the subhalo merger, the progenitors must both have particles or more to be counted.
Fig. 10 shows that the probability of a subhalo merger is constant for subhaloes of different mass. About percent of subhaloes have had a merger with another subhalo with a mass ratio . For a mass ratio , this fraction increases to . We also note that these fractions show a weak decrease with redshift.
5 Summary and conclusions
We have used the Millennium simulation, together with a simulation which has times better resolution but about times smaller volume, to investigate the general properties of the substructures within dark matter haloes, including their merger rates. Our main findings can be summarized as follows:
In agreement with previous studies, we find that the mass function of low and intermediate mass subhaloes follows roughly a power-law. However, we also find an exponential cut-off in the mass function at high subhalo masses. We have provided an expression, Eq. 2, that describes this behaviour accurately. We also detect a small but systematic dependence of the number of subhaloes on the mass of the host halo. On average, at a given fractional mass, , high mass haloes contain more low and intermediate mass substructures than their less massive counterparts. In contrast, we find evidence that high mass haloes contain fewer high mass subhaloes than do low mass haloes. In spite of this, the fractional mass of the first, second and third most massive substructures is insensitive to the mass of the host halo and of the redshift.
We confirm that the radial and angular distributions of subhaloes are roughly independent of the host halo mass and redshift. However, we find that the radial distribution does depend on the subhalo mass relative to that of the host halo. The subhalo distribution is less concentrated than the dark matter, but the radial distribution of low mass subhaloes tends to be more concentrated than that of high mass subhaloes. This difference can be understood as resulting from the different efficiency of dynamical friction in subhaloes of different mass. On the other hand, these discrepancies between the radial distributions of low and high mass subhaloes disappear in the outer parts of the halo, as seen in recent ultra-high resolution simulations of galactic halos (Springel et al., 2008).
The angular distribution of subhaloes tends to be aligned perpendicular to the spin axis of the host halo. This is probably due to an anisotropic mass accretion - mergers happen preferentially along filaments. The alignment is strong for the most massive subhaloes, but is much weaker for low mass substructures since, on average, they have spent a few orbital times inside the halo which would randomize their orientation.
We have found that satellite-satellite mergers do occur. Over most of the mass range resolved in our simulations, they are subdominant when compared with mergers between satellites and the central subhalo. However, we see some indication that satellite-satellite mergers are equally likely to satellite-central mergers for the lowest mass subhaloes (). As for many other subhalo properties, the merger rates appear to be a function of the fractional subhalo mass only, and are independent of the particular host or subhalo mass.
The radial distribution of satellite-satellite subhalo mergers closely follows the radial distribution of subhaloes. This implies that most of the subhalo mergers happen in the outer layers of the halo. For the most part, these mergers involve subhaloes that are already dynamically associated before accretion into the main halo, i.e. they were either part of the same halo, or of two separate haloes that were accreted at similar times and locations. At every redshift, most of these subhaloes which subsequently merged were closer together than as seen from the centre of the halo that hosts the merger, at the time they fell in.
Finally, we find that a small fraction of the high-mass subhaloes has experienced a merger with another subhalo since accretion into the current host halo. The values depend on the mass ratio of the merger, but vary from a few percent for mass ratios greater than to for mass ratios greater than .
In spite of using some of the largest simulations to date, our results could still be affected to some extent by numerical resolution. Due to the rarity of the events we are trying to study, it is difficult to find a range of substructure and host halo masses where we have, at the same time, (i) enough particles to resolve substructures well, (ii) enough haloes to distinguish real trends from cosmic variance, and (iii) enough subhaloes to establish their properties and dynamics. Fortunately, as we have shown, many properties can be described as a function of only the fractional subhalo mass. In these cases we are observing the same system resolved with many different numbers of particles, so it is reassuring that we find the same trends for different host halo masses. This gives us confidence that these results are robust. On the other hand, quantities which scale with halo mass are much less reliable and could still be affected by resolution effects. Much larger simulations, currently beyond reach, will be needed to check them.
Acknowledgements
We are grateful to Adrian Jenkins and John Helly for providing us with the high resolution simulation and merger trees used in this paper. We also acknowledge Phil Bett, Liang Gao and Shaun Cole for helpful discussions, and Lydia Heck for indispensable computing support. The Millennium simulation was carried out as part of the programme of the Virgo Consortium on the Regatta supercomputer of the Computing Centre of the Max-Planck Society in Garching. REA is supported by a PPARC/British Petroleum sponsored Dorothy Hodgkin postgraduate award. CMB is funded by a Royal Society University Research Fellowship. CSF acknowledges a Royal Society-Wolfson Research Merit award. This work was supported in part by a rolling grant from STFC to the ICC.
References
- Aragón-Calvo et al. (2007) Aragón-Calvo M. A., van de Weygaert R., Jones B. J. T., van der Hulst J. M., 2007, ApJ, 655, L5
- Bett et al. (2007) Bett P., Eke V., Frenk C. S., Jenkins A., Helly J., Navarro J., 2007, MNRAS, 376, 215
- Davis et al. (1985) Davis M., Efstathiou G., Frenk C. S., White S. D. M., 1985, ApJ, 292, 371
- De Lucia et al. (2004) De Lucia G., et al., 2004, MNRAS, 348, 333
- Diemand et al. (2007) Diemand J., Kuhlen M., Madau P., 2007, ApJ, 667, 859
- Diemand et al. (2008) Diemand J., Kuhlen M., Madau P., Zemp M., Moore B., Potter D., Stadel J., 2008, Nature, 454, 735
- Diemand et al. (2004) Diemand J., Moore B., Stadel J., 2004, MNRAS, 352, 535
- Frenk et al. (1988) Frenk C. S., White S. D. M., Davis M., Efstathiou G., 1988, ApJ, 327, 507
- Frenk et al. (1985) Frenk C. S., White S. D. M., Efstathiou G., Davis M., 1985, Nature, 317, 595
- Gao et al. (2004) Gao L., De Lucia G., White S. D. M., Jenkins A., 2004, MNRAS, 352, L1
- Ghigna et al. (1998) Ghigna S., Moore B., Governato F., Lake G., Quinn T., Stadel J., 1998, MNRAS, 300, 146
- Ghigna et al. (2000) —, 2000, ApJ, 544, 616
- Giocoli et al. (2008) Giocoli C., Tormen G., van den Bosch F. C., 2008, MNRAS, 386, 2135
- Harker et al. (2006) Harker G., Cole S., Helly J., Frenk C., Jenkins A., 2006, MNRAS, 367, 1039
- Hatton et al. (2003) Hatton S., Devriendt J. E. G., Ninin S., Bouchet F. R., Guiderdoni B., Vibert D., 2003, MNRAS, 343, 75
- Jiang et al. (2008) Jiang C. Y., Jing Y. P., Faltenbacher A., Lin W. P., Li C., 2008, ApJ, 675, 1095
- Kang et al. (2007) Kang X., van den Bosch F. C., Yang X., Mao S., Mo H. J., Li C., Jing Y. P., 2007, MNRAS, 378, 1531
- Klypin et al. (1999a) Klypin A., Gottlöber S., Kravtsov A. V., Khokhlov A. M., 1999a, ApJ, 516, 530
- Klypin et al. (1999b) Klypin A., Kravtsov A. V., Valenzuela O., Prada F., 1999b, ApJ, 522, 82
- Knebe et al. (2004) Knebe A., Gill S. P. D., Gibson B. K., Lewis G. F., Ibata R. A., Dopita M. A., 2004, ApJ, 603, 7
- Knebe et al. (2008a) Knebe A., Yahagi H., Kase H., Lewis G., Gibson B. K., 2008a, arXiv:astro-ph/0805.1823, 805
- Knebe et al. (2008b) Knebe A., et al., 2008b, MNRAS, 386, L52
- Komatsu et al. (2008) Komatsu E., Dunkley J., Nolta M. R., Bennett C. L., Gold B., Hinshaw G., Jarosik N., Larson D., Limon M., Page L., Spergel D. N., Halpern M., Hill R. S., Kogut A., Meyer S. S., Tucker G. S., Weiland J. L., Wollack E., Wright E. L., 2008, arXiv:astro-ph/0803.0547, 803
- Lacey & Cole (1993) Lacey C., Cole S., 1993, MNRAS, 262, 627
- Libeskind et al. (2007) Libeskind N. I., Cole S., Frenk C. S., Okamoto T., Jenkins A., 2007, MNRAS, 374, 16
- Makino & Hut (1997) Makino J., Hut P., 1997, ApJ, 481, 83
- Moore et al. (1999) Moore B., Ghigna S., Governato F., Lake G., Quinn T., Stadel J., Tozzi P., 1999, ApJ, 524, L19
- Moore et al. (1996) Moore B., Katz N., Lake G., 1996, ApJ, 457, 455
- Nagai & Kravtsov (2005) Nagai D., Kravtsov A. V., 2005, ApJ, 618, 557
- Neto et al. (2007) Neto A. F., et al., 2007, MNRAS, 381, 1450
- Percival et al. (2001) Percival W. J., Baugh C. M., Bland-Hawthorn J., Bridges T., Cannon e. a., 2001, MNRAS, 327, 1297
- Power et al. (2003) Power C., Navarro J. F., Jenkins A., Frenk C. S., White S. D. M., Springel V., Stadel J., Quinn T., 2003, MNRAS, 338, 14
- Sánchez et al. (2006) Sánchez A. G., Baugh C. M., Percival W. J., Peacock J. A., Padilla N. D., Cole S., Frenk C. S., Norberg P., 2006, MNRAS, 366, 189
- Shaw et al. (2006) Shaw L. D., Weller J., Ostriker J. P., Bode P., 2006, ApJ, 646, 815
- Shaw et al. (2007) —, 2007, ApJ, 659, 1082
- Somerville & Primack (1999) Somerville R. S., Primack J. R., 1999, MNRAS, 310, 1087
- Spergel et al. (2003) Spergel D. N., Verde L., Peiris H. V., Komatsu E., Nolta M. R., Bennett C. L., Halpern M., Hinshaw G., Jarosik N., Kogut A., Limon M., Meyer S. S., Page L., Tucker G. S., Weiland J. L., Wollack E., Wright E. L., 2003, ApJS, 148, 175
- Springel (2005) Springel V., 2005, MNRAS, 364, 1105
- Springel et al. (2008) Springel V., Wang J., Vogelsberger M., Ludlow A., Jenkins A., Helmi A., Navarro J. F., Frenk C. S., White S. D. M., 2008, arXiv:astro-ph/0807.1770
- Springel et al. (2005) Springel V., White S. D. M., Jenkins A., Frenk C. S., Yoshida N., Gao L., Navarro J., Thacker R., Croton D., Helly J., Peacock J. A., Cole S., Thomas P., Couchman H., Evrard A., Colberg J., Pearce F., 2005, Nature, 435, 629
- Springel et al. (2001) Springel V., White S. D. M., Tormen G., Kauffmann G., 2001, MNRAS, 328, 726
- Stoehr et al. (2002) Stoehr F., White S. D. M., Tormen G., Springel V., 2002, MNRAS, 335, L84
- Tormen (1997) Tormen G., 1997, MNRAS, 290, 411
- Tormen et al. (1998) Tormen G., Diaferio A., Syer D., 1998, MNRAS, 299, 728
- van den Bosch et al. (2005) van den Bosch F. C., Tormen G., Giocoli C., 2005, MNRAS, 359, 1029
- Zentner et al. (2005) Zentner A. R., Berlind A. A., Bullock J. S., Kravtsov A. V., Wechsler R. H., 2005, ApJ, 624, 505
Appendix: numerical effects
Numerical artifacts can pose serious problems in obtaining a robust estimate of various properties of the population of subhaloes. For instance, two-body encounters, particle heating, or force softening could easily dilute substructures that are not resolved with enough particles (Moore et al., 1996). These problems translate into an overestimation of the number of satellite-central subhalo mergers in each timestep.
Such a feature is clear in Fig. 11, which is similar to Fig. 5, but for satellite-central mergers only and including subhaloes with less than particles. For these objects, we can see a strong disagreement between the merger rate of substructures in the simulations with different resolution which is manifest as an upturn in the curves. However, the upturn disappears for subhaloes with which is the limit set in this paper.
An overestimation of the destruction rate also has implications for other quantities such as the abundance and radial distribution of subhaloes. For instance, the subhalo mass function shows a cut-off at low masses compared with the expected power-law behaviour when we include subhaloes resolved with fewer than particles. (This quantity is less affected since most of the subhaloes are in the outer layers of the halo.) On the other hand, the inner part of the radial distribution is more sensitive to these effects. Once subhaloes with fewer than 200 particles are included in Fig. 3 the distribution becomes less centrally concentrated.
Our convergence study indicates that 200 particles is the limit below which results are unduly affected by resolution. This is why we have adopted this minimum particle count throughout this chapter, except when otherwise stated explicitly. This choice should minimize finite-resolution effects.