Two New Variable Hot DQ Stars
Abstract
We have discovered periodic variations in the light curves of two hot DQ stars from the Sloan Digital Sky Survey, SDSS J220029.08-074121.5 and SDSS J234843.30-094245.3. These are the second and third variables detected among the hot DQs and confirm the existence of a new class of variable white dwarf stars. The amplitudes of the variations are one half as large as those detected in the first discovered variable, SDSS J142625.71+575218.3, and required high signal-to-noise photometry to detect. The pulse shapes of the stars are not like those of known white dwarf pulsators but are similar to the first hot DQ variable, SDSS J142625.71+575218.3.
1 An Abundance of Variables Among the Hot DQs
Hot DQ stars are a recently-discovered class of white dwarfs with atmospheres composed primarily of carbon and devoid of significant amounts of hydrogen and helium (Dufour et al., 2007). Recently, Montgomery et al. (2008) announced the discovery of the first variable hot DQ star, SDSS J142625.71+575218.3 (hereafter SDSS J1426). The star was one of six selected from the Sloan Digital Sky Survey (SDSS) and observed using the Argos high-speed photometer on the Otto Struve 2.1 m telescope at McDonald Observatory. Based on theoretical arguments that couple the existence of non-radial oscillations with the presence of a surface convection zone in the models, Montgomery et al. (2008) identified SDSS J1426 as the only likely pulsator. In agreement with this expectation, the remaining five candidates did not exhibit variations at the 5 mma level.
Fontaine et al. (2008) examined the asteroseismological potential of this class of white dwarfs using a full nonadiabatic approach. They found that pulsational modes are excited in certain models with carbon-dominated atmospheres with the region of pulsational instability depending on the chemical composition, surface gravity, and effective temperature. Dufour et al. (2008a) used SDSS spectra and photometry to determine these parameters for a sample of nine hot DQ stars. Based on these fits and using the general models of Fontaine et al. (2008), Dufour et al. (2008a) predicted that only SDSS J1426 should exhibit pulsations. To test this prediction, we initiated a program to observe the hot DQs not observed by Montgomery et al. (2008). Fortunately, we are in the process of commissioning the Goodman Spectrograph on the 4.1 m SOAR telescope and were able to apply several engineering nights to time-series photometric observations. This observing technique is indispensable for diagnosing tracking, flexure, and image-quality problems in the telescope-instrument system. Over the course of two runs in June and July 2008, we attempted to observe three hot DQ stars from the SDSS. For one of these targets, we did not acquire a sufficient quantity of data under photometric conditions with a properly-functioning instrument and, therefore, cannot set useful limits on the existence of variations. The other two stars show periodic variations with amplitudes around 7 mma, contrary to the expectations of Dufour et al. (2008a).
Our observations bring the total number of known variable hot DQs to three out of a sample of only eight studied. This high fraction of variables and the failure of the predictions of Dufour et al. (2008a) do nothing to strengthen the pulsational hypothesis. The unusual harmonic structure and pulse shape of SDSS J1426 suggested to Montgomery et al. (2008) that the star might be an interacting binary white dwarf akin to AM CVn (Provencal et al., 1995), but with carbon-atmosphere white dwarfs. In this case, the variations could be related to the binary orbital period or the precession of an accreting disk. This model is attractive because it would neatly explain all three unusual properties of the star: periodic variations, a carbon-dominated atmosphere, and broadened spectral lines. It would also account for the high fraction of variables because the same mechanism that makes the atmosphere carbon-dominated requires some measure of variability. Nevertheless, the presence of surface convection in the models at the right temperature is a compelling argument in favor of pulsations; every other known class of white dwarfs with surface convection zones exhibits non-radial pulsations.
2 Observations
The Goodman Spectrograph is an imaging spectrograph constructed for one of the Nasmyth ports of the SOAR 4.1 m telescope. In imaging mode, which was the only mode employed for our observations, the camera-collimator combination re-images the SOAR focal plane with a focal reduction of approximately three times. This yields a plate scale of 0.15 arcsec/pixel at the detector. The camera contains a 4k x 4k Fairchild 486 back-illuminated CCD, with electronics and dewar provided by Spectral Instruments Inc. of Tucson, AZ. The entire system is optimized for high throughput from 320 to 850 nm and uses optics of fused silica, CaF2, and NaCl. Details of the instrument can be found in Clemens et al. (2004).
We observed over two separate engineering weeks in June and July of 2008; a log of our observations is shown in Table 1. Each data set consists of an uninterrupted run of time-series photometry, with the exception of the 27 July observation of SDSS J220029.08-074121.5 (hereafter SDSS J2200), for which there is a five-minute gap in the data. Although one data set for each object was obtained through an S8612 filter, the rest of our runs were unfiltered. The S8612 filter has a bandpass of 300 to 700 nm, similar to BG40. The CCD readout was unbinned for the 31 July observation of SDSS J234843.30-094245.3 (hereafter SDSS J2348) but binned 2x2 for all other data. In order to reduce the cycle time of the exposures, we restricted the readout of the CCD to a subsection of the detector and used an intermediate readout speed (100 kHz). The seeing averages for the runs ranged from 1” to 2.5”, and there was significant moonlight in many of the runs.
For the runs acquired in June, there were three problems with the spectrograph. The first of these was a periodic pattern in the bias frames with an amplitude of approximately 20 electrons. The second was poor control over shutter timing, rendering the FITS header time stamps accurate only to one second from UTC as measured by the facility GPS. Finally, the CCD subsection used in the SDSS J2200 frames contained a rectangular area of higher counts spanning the length of the serial direction and around 100 pixels in the parallel direction. In all cases, we positioned the target well outside of this region and were cautious not to employ comparison stars near the boundary of this anomalous section of the chip. The primary objective of our engineering was to resolve these problems, and the discoveries presented in this Letter are a byproduct of this effort. Before the July run, we diagnosed and eliminated the bias noise, but the the other two issues are still under study. We do not believe any of these problems produced misleading artifacts in the data; nonetheless, we have taken care to present for each variable candidate the amplitude spectrum of a comparison star reduced in the same way as the candidate photometry. In no case do the comparison stars show significant periodic signals. Moreover, the variable candidates showed the same oscillation frequencies in all of the observations.
3 Reduction and Analysis
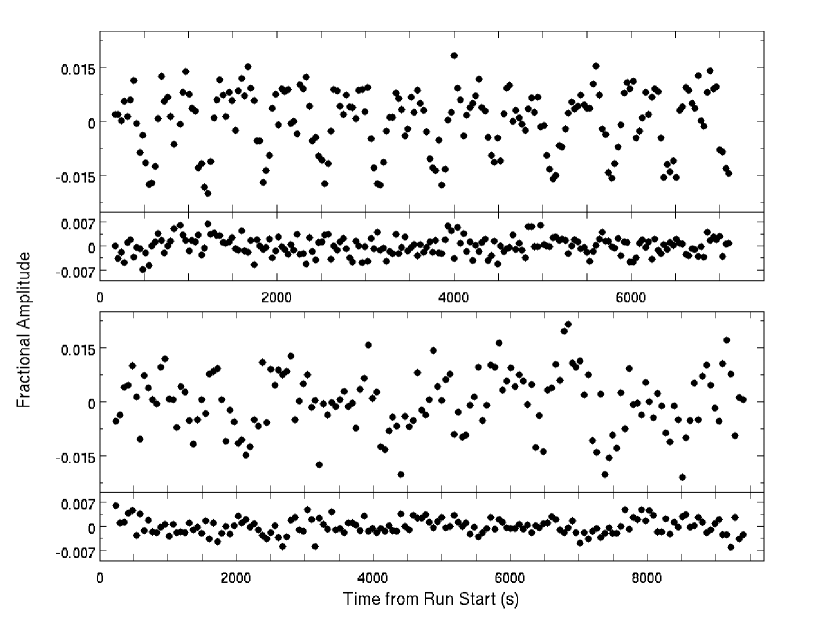
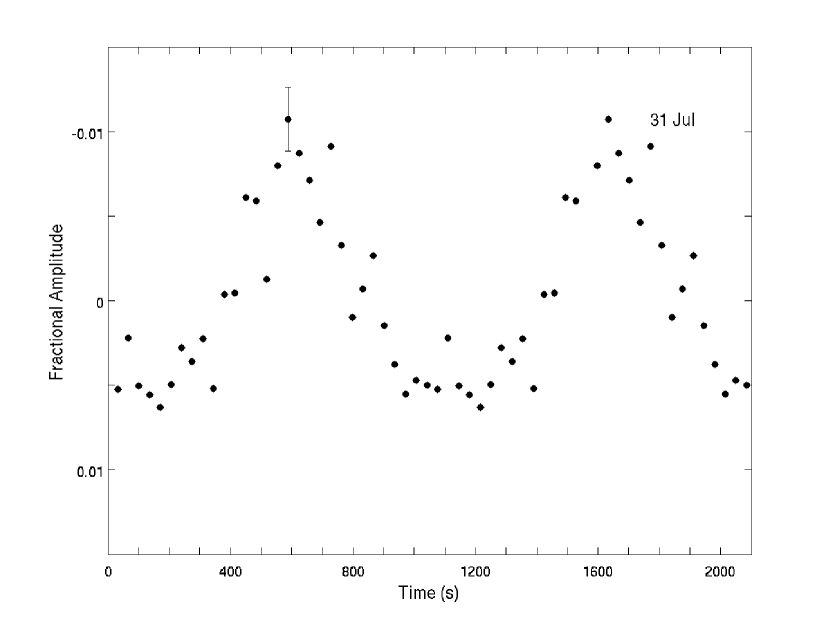
We extracted our photometry using the external IRAF package CCD_HSP developed by Antonio Kanaan, which employs the aperture photometry preferred by O’Donoghue et al. (2000). The extraction parameters used maximized the S/N ratio in the light curves. The aperture widths ranged from 1.7 to 2 times the seeing width, while sky annuli started approximately 3” from the center of the stars and had widths around 1.5”. To correct for small-scale transparency variations, we divided our light curves by those of constant comparison stars and normalized the resulting curves with parabolas. We did not flat-field or bias-subtract any of the frames, due to superb telescope guiding and the instrumental issues mentioned in §2. Unsmoothed light curves of the longest runs for SDSS J2348 and SDSS J2200 are presented in Figure 1.
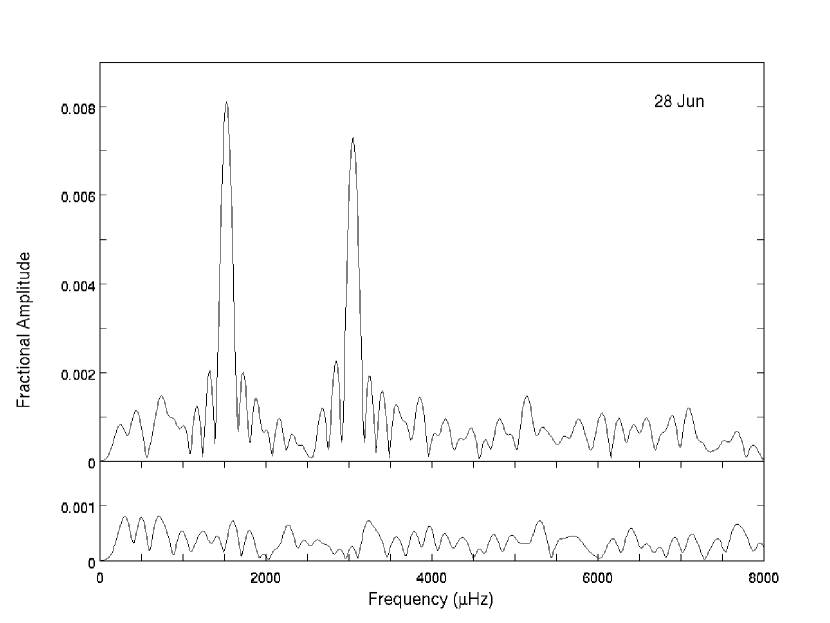
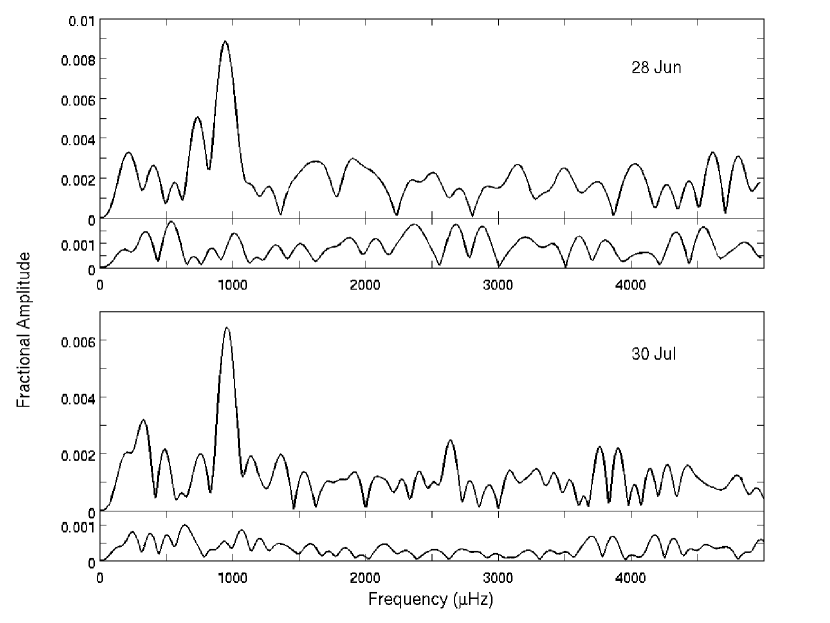
We analyzed the reduced light curves using two tools: the discrete Fourier transform and least-squares fitting of sine waves to the light curves444footnotetext: These tools were employed via the WQED suite (http://www.physics.udel.edu/darc/wqed/index.html). Figures 2 and 3 present amplitude spectra for SDSS J2200 and SDSS J2348, respectively, displayed above those for nearby comparison stars reduced in the same manner. Table 2 summarizes the parameters derived from the least-squares fittings. The errors shown in Table 2 are from the least-squares fittings and implicitly assume uncorrelated noise. For correlated noise, as produced by transparency variations in the atmosphere, the errors may be three times as large (see Montgomery & O’Donoghue 1999).
The amplitude spectrum of SDSS J2200 exhibits a large signal near 1524 Hz (656 s) and its first harmonic (3055 Hz). The probability that a signal this large could occur by chance (the “false alarm” probability, Horne & Baliunas 1986), is less than 10-14. Moreover, a time span of more than four weeks separates the first and last observations, and the frequency measurements agree to within the errors. The amplitude spectra do not show any other statistically significant periodicities, nor are there any in the comparison stars.
SDSS J2348 is 1.3 g magnitudes fainter than SDSS J2200, so the noise in the amplitude spectra is larger. Nonetheless, we detect a variation near 951 Hz (1052 s) in both runs (see Figure 2). In addition, there is a large sidelobe in the 28 June run and a formally significant signal at 2641 Hz (379 s) in the 31 July run. The sidelobe corresponds in frequency to a feature in the window function (not shown), so we cannot regard it as the detection of an independent frequency. The signal at 379 s is not harmonically related to the 1052 s variation or any window feature and is potentially suggestive of multi-periodic pulsations. The false alarm probability for this frequency is 15% (as a comparison, the largest peak has a false alarm probability less than 10-6). However, this signal appears in only one of our two runs and does not behave like a variation in the star should when we degrade the signal-to-noise ratio. We do this by successively increasing the aperture size used in the photometry and recalculating the amplitude spectrum. The amplitude of the 1052 s variation remains approximately constant as the noise around it increases, but the amplitude of the 379 s signal increases significantly with larger aperture size. Therefore, we cannot claim to have detected a second independent frequency in the light curve of this star, however interesting such a detection might be.
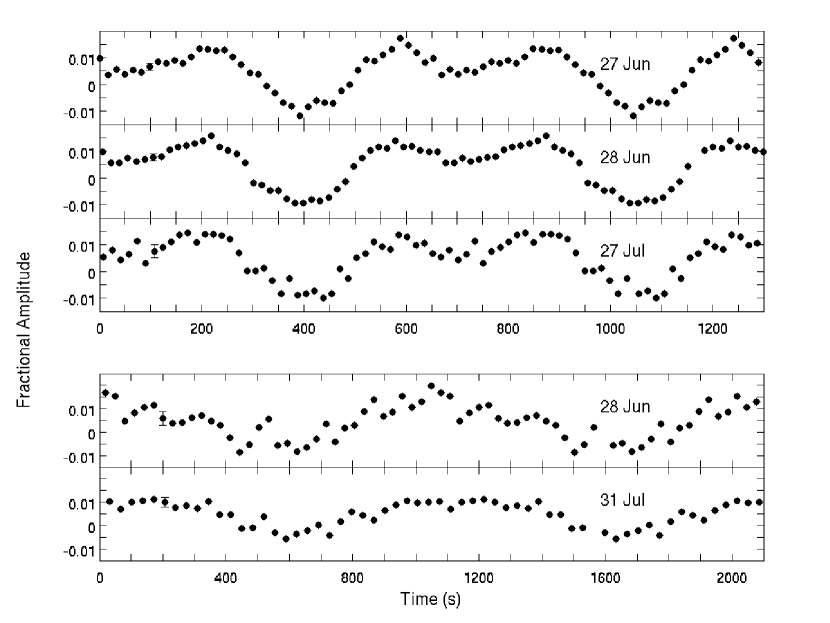
The large harmonic present in SDSS J2200 suggests it would be fruitful to look at the folded pulse shape. In Figure 4 we show folded light curves for both objects. The pulse shape for SDSS J2200 resembles the pulse shape for SDSS J1426 (see Figure 4 of Montgomery et al. 2008) more than it resembles that of a typical pulsating white dwarf. The shape for SDSS J2348 looks like the light curve of a ZZ Ceti when we plot it upside-down (see Figure 5). This reinforces the point made by Montgomery et al. (2008) that while in a typical white dwarf pulsator the harmonic phase makes the peaks higher and the valleys shallower, in the hot DQ variables the phase makes the peaks lower and valleys deeper. While this does not rule out pulsation, it does add the requirement that any pulsational model explain this difference.
4 Two Proposed Mechanisms Remain Viable
We have conducted high signal-to-noise time-series photometry for two hot DQs not studied by Montgomery et al. (2008). Two out of two targets observed with a 4 m telescope show periodic variations. Overall, three out of eight targets studied to date show variations. This raises a question about this class of stars: does that which makes them hot DQs also make them vary? If they are interacting binaries transferring C or C-O, then the unusual composition and the photometric variations are caused by the same phenomena. If they are pulsators, Dufour et al. (2008c) have also proposed a connection between the surface composition and the variations through the existence of convection in the models. They propose that the C convection zone that develops mixes and dilutes a thin, overlying He layer. The same convection could drive pulsations (Brickhill, 1990; Goldreich & Wu, 1999). A problem with this picture is raised by Dufour et al. (2008b), who report the presence of a strong magnetic field in SDSS J1426. They note that a magnetic field could supress convection and, perhaps, pulsation, and this has not been treated self-consistently in the pulsation models. In either case, the results of this Letter show that the pulsation models have not yet yielded a predictive success. Whether this is a consequence of poor atmospheric parameter determinations or whether it means the variable hot DQs are not pulsators is unclear. At this moment, there is no a priori reason to prefer pulsations over other explanations for hot DQ variations. The best evidence for pulsations would be the convincing detection of multiple incommensurate frequencies, and we are pursuing observations to further increase the signal-to-noise ratio in the amplitude spectra. Citing as yet unpublished data (E.M. Green 2008, in preparation), Dufour et al. (2008b) report a probable detection of an incommensurate period in SDSS J1426, which could strengthen the case for pulsations.
As an alternative to pulsations, the interacting binary white dwarf hypothesis proposed by Montgomery et al. (2008) has lost none of its appeal. Montgomery et al. (2008) have already pointed out that the pulse shape in SDSS J1426 resembles AM CVn, a known interacting binary white dwarf. Likewise, the pulse shapes of SDSS J2200 in our Figure 4 are reminiscent of V803 Cen (O’Donoghue & Kilkenny, 1989), a binary whose amplitude spectrum shows a fundamental at 1611 s and multiple harmonics. Interestingly, it also shows an incommensurate period at 175 s whose origin is unclear. Clearly, time-series photometry alone will not be sufficient to arrive at a definitive model for the hot DQ variables. The binary hypothesis also offers an attraction the pulsation models do not; it predicts that a large fraction of the hot DQs will be variables, which is what we have found in our sample. Conversely, it does not directly predict that the stars will have similar temperatures, and so the pulsational interpretation is more successful in explaining the temperature clustering (see Dufour et al. 2008c) of the hot DQ stars.
References
- Brickhill (1990) Brickhill, A. J. 1990, MNRAS, 246, 510
- Clemens et al. (2004) Clemens, J. C., Crain, J. A., & Anderson, R. 2004, in Presented at the Society of Photo-Optical Instrumentation Engineers (SPIE) Conference, Vol. 5492, Ground-based Instrumentation for Astronomy. Edited by Alan F. M. Moorwood and Iye Masanori. Proceedings of the SPIE, Volume 5492, pp. 331-340 (2004)., ed. A. F. M. Moorwood & M. Iye, 331–340
- Dufour et al. (2008a) Dufour, P., Fontaine, G., Liebert, J., Schmidt, G. D., & Behara, N. 2008a, ArXiv e-prints, 805
- Dufour et al. (2008b) Dufour, P., Fontaine, G., Liebert, J., Williams, K., & Lai, D. K. 2008b, ArXiv e-prints, 807
- Dufour et al. (2007) Dufour, P., Liebert, J., Fontaine, G., & Behara, N. 2007, Nature, 450, 522
- Dufour et al. (2008c) Dufour, P., Liebert, J., Fontaine, G., & Behara, N. 2008c, in Astronomical Society of the Pacific Conference Series, Vol. 391, Hydrogen-Deficient Stars, ed. A. Werner & T. Rauch, 241–+
- Fontaine et al. (2008) Fontaine, G., Brassard, P., & Dufour, P. 2008, A&A, 483, L1
- Goldreich & Wu (1999) Goldreich, P., & Wu, Y. 1999, ApJ, 511, 904
- Horne & Baliunas (1986) Horne, J. H., & Baliunas, S. L. 1986, ApJ, 302, 757
- Montgomery & O’Donoghue (1999) Montgomery, M. H., & O’Donoghue, D. 1999, Delta Scuti Star Newsletter, 13, 28
- Montgomery et al. (2008) Montgomery, M. H., Williams, K. A., Winget, D. E., Dufour, P., DeGennaro, S., & Liebert, J. 2008, ApJ, 678, L51
- O’Donoghue et al. (2000) O’Donoghue, D., Kanaan, A., Kleinman, S. J., Krzesinski, J., & Pritchet, C. 2000, Baltic Astronomy, 9, 375
- O’Donoghue & Kilkenny (1989) O’Donoghue, D., & Kilkenny, D. 1989, MNRAS, 236, 319
- Provencal et al. (1995) Provencal, J. L., Winget, D. E., Nather, R. E., Robinson, E. L., Solheim, J.-E., Clemens, J. C., Bradley, P. A., Kleinman, S. J., Kanaan, A., Claver, C. F., Hansen, C. J., Marar, T. M. K., Seetha, S., Ashoka, B. N., Leibowitz, E. M., Meistas, E. G., Bruvold, A., Vauclair, G., Dolez, N., Chevreton, M., Barstow, M. A., Sansom, A. E., Tweedy, R. W., Fontaine, G., Bergeron, P., Kepler, S. O., Wood, M. A., & Grauer, A. D. 1995, ApJ, 445, 927
| Object | UT Date | Start Time | Texp | Tcycle | Length | Filter |
|---|---|---|---|---|---|---|
| (2008) | (UTC) | (s) | (s) | (s) | ||
| SDSS J2200 | 27 Jun | 06:57:56 | 30 | 34.8 | 7314 | none |
| 28 Jun | 06:00:00 | 30 | 34.8 | 7380 | S8612 | |
| 27 Jul | 02:31:44 | 25 | 29.6 | 6170 | none | |
| SDSS J2348 | 28 Jun | 08:47:18 | 90 | 95.5 | 7446 | S8612 |
| 31 Jul | 05:57:30 | 55 | 59.5 | 9520 | none |
| Object | UT Date (2008) | Frequency (Hz) | Amplitude (mma) | PhaseaaThe uncertainties shown are lower limits. (cycles) |
|---|---|---|---|---|
| SDSS J2200 | 27 Jun | 1531.2 8.7 | 6.68 0.75 | 0.88 0.02 |
| 3053.3 7.1 | 7.60 0.71 | 0.48 0.02 | ||
| 28 Jun | 1527.4 6.5 | 8.04 0.66 | 0.09 0.01 | |
| 3052.9 7.6 | 7.30 0.70 | 0.89 0.02 | ||
| 27 Jul | 1512 11 | 7.40 0.93 | 0.29 0.02 | |
| 3060 11 | 7.26 0.94 | 0.41 0.02 | ||
| SDSS J2348 | 28 Jun | 944 12 | 8.8 1.3 | 0.27 0.02 |
| 31 Jul | 958 6.7 | 6.4 0.8 | 0.38 0.02 | |