Hydrophobic Interactions and Dewetting between Plates with Hydrophobic and Hydrophilic Domains111In Press, J. Phys. Chem. C
Abstract
We study by molecular dynamics simulations the wetting/dewetting transition and the dependence of the free energy on distance between plates that contain both hydrophobic and hydrophilic particles. We show that dewetting and strength of hydrophobic interaction is very sensitive to the distribution of hydrophobic and hydrophilic domains. In particular, we find that plates characterized by a large domain of hydrophobic sites induce a dewetting transition and an attractive solvent-induced interaction. On the other hand, a homogeneous distribution of the hydrophobic and hydrophilic particles on the plates prevents the dewetting transition and produces a repulsive solvent-induced interaction. We also present results for a kind of “Janus interface” in which one plate consists of hydrophobic particles and the other of hydrophilic particles showing that the inter-plate gap remains wet until steric constraints at small separations eject the water molecules. Our results indicate that the Cassie equation, for the contact angle of a heterogeneous plate, can not be used to predict the critical distance of dewetting. These results indicate that hydrophobic interactions between nanoscale surfaces with strong large length-scale hydrophobicity can be highly cooperative and thus they argue against additivity of the hydrophobic interactions between different surface domains in these cases. These findings are pertinent to certain protein-protein interactions where additivity is commonly assumed.
I Introduction
The hydrophobic interaction is one of the major driving forces in various self-assembly processes such as protein folding, the formation of membranes and micelles, molecular recognition and surfactant aggregation.ball_2003 ; Scheraga_jbsd98 ; Fersht-folding ; pratt3 ; chandler_nature05 The nature of the hydrophobic effect is length-scale dependent. While hydrophobicity at small length-scales is associated with small distortions of the hydrogen bond connectivity between the water molecules, large-scale hydrophobicity is driven by a significant disruption of the hydrogen bonds network of interfacial waters. stillinger ; berne1 ; Lee_jcp84 ; LCK_jpcb99 ; bratko ; Berne3_2003 ; thirumalai1 ; Huang_pnas00 ; Huang_jpcb02 The crossover from small to large scale behavior occurs when the radius of the hydrophobe is about 1 nm. One of the signatures of large-scale hydrophobicity is the existence of a dewetting (drying) transition; on bringing two large hydrophobic plates from far apart into contact, a critical distance exists below which the water confined between the two plates is unstable in its liquid state and evaporates. The dewetting transition has been predicted theoreticallychandler4_1998 ; LCK_jpcb99 ; Huang_jpcb02 ; Berne3_2003 ; Ashbaugh_rmp06 and observed in computer simulationsLum97 ; Wallqvist_jpc95 ; Bolhuis_2000 ; Wolde_pnas02 ; chandler_jpcb03 ; Berne3_2003 ; hummer ; Li_jacs06 ; Ronen_jacs07 ; Hua_jpcb07 ; Liu_nature05 ; chandler_pnas07 ; chandler_jpcb07 ; Chandler_jpcb08 . In a recent experiment using interfacial-force microscopysandia06 , a nanoscale bubble was directly observed between superhydrophobic surfaces. Nevertheless, the drying transition is sensitive to the magnitude of the solute-solvent interaction. This was demonstrated by showing that a small change of the attraction between the wall of a nonpolar carbon nanotube and water can induce a wetting transitionhummer . In this case, the transition point is characterized by a two-state model; in one state the channel is filled with water and in the other it is emptychandler_jpcb03 . As the solute-solvent attractive interaction increases, the dewetting transition becomes less pronounced and eventually disappears.Huang_jpcb02 ; Berne3_2003 ; Zhou_science04 ; chandler_jpcb07 In some cases the kinetic pathway for dewetting in the cavitation transition has been studied using the powerful transition path sampling methodBolhuis_2000 and the string methodchandler_pnas07 . The hydrophobicity of a surface is related to the value of the contact angle of a water droplet on that surface. Based on Young’s equation, a surface with a contact angle larger than 90∘ is defined as hydrophobic. It is interesting to point out that, a hydroxylated silica surface with its partial atomic charges scaled by a factor of less than 0.4 was found to be macroscopically hydrophobicRossky_jpcb07 . In addition, it has been argued that the mechanism for attractive mean forces between the plates is very different depending on the nature of the solute-solvent interactionChoudhury05 .
Both morphology and structure of the interacting hydrophobic surfaces are important to the existence and kinetics of dewetting. Luzar_jcp00 ; Christ01 ; Rossky_jpcb07 ; chandler_fd08 In general, the surface of proteins is non-homogeneous with respect to hydrophobicity, roughness and topology. For example, simulations indicate that protein surfaces can be characterized by hydrophobic regions that are heterogeneously “small” or “large” based on the length-scale dependence of hydrophobic hydration.Cheng_nature98 . Thus, it is very challenging to predict the existence of the drying transition and determine its role in protein folding from the properties of the protein interface alone. In a recent study, we found that a simple hydrophobic scoring function, based on aligned hydrophobic surface areas, is not sufficient to predict whether the assembly of protein units will exhibit dewetting or not. Hua_jpcb07 Further improvement of the scoring function should, therefore, include contributions from factors which were not taken into account, such as surface roughness and heterogeneity.
A macroscopic theory relates the critical distance of the dewetting transition to the value of the contact angle of a water droplet on the surface, Berne3_2003
| (1) |
where is the liquid/vapor surface tension for water, is the contact angle of water on the hydrophobic plate, is the pressure of the liquid (water), is the vapor pressure of water, and is the radius of the plates. For plates of nanoscale size, the term in the denominator is much smaller than and can be ignored, yielding,
| (2) |
Thus, a knowledge of the contact angle of a heterogeneous surface is enough to predict the critical distance for dewetting. The contact angle on a heterogeneous solid surface can be approximately predicted by the Cassie equationCassie_dfs48 ; Cassie_dfs52 . For a two-component surface,
| (3) |
where, is the fractional area of the surface with a contact angle of . Simulations of droplets on heterogeneous patterned surfaces indicate that the Cassie equation holds for domains that are sufficiently small relative to the droplet. On the other hand, when the size of the heterogeneous domains is much larger than that of the droplet, there is a breakdown of the Cassie equation. Lundgren_07 ; Brandon_03 ; Padday_78 In the current work, we are interested in cases in which the size of the domains is small compared with the size of a typical macroscopic droplet. For example: under what conditions is the Cassie equation obeyed?; and how does the distribution of hydrophobic and hydrophilic domains (in terms of size and shape) determine the averaged contact angle for a given ?
Recent studies on hydrophobic hydration and hydrophobic interactions between hybrid polar/nonpolar nanoassembliesKoishi_prl04 ; Koishi_jcp05 ; Rossky_jpcc07 show that the pattern of nonpolar-site distribution is very important for the dewetting transitions to occurKoishi_jcp05 . Hydrophilic borders surrounding a nanoscale hydrophobic patch reduce considerably the patch’s ability to repel water from the first hydration layer. In fact, even a single hydrophilic site at the center of the surfaces prevents complete drying of the confined regionRossky_jpcc07 . In addition, it was found that an increase in the pressure of the bulk water blurs the difference between interfacial water density next to hydrophilic and hydrophobic surfacesRossky_jpcc07 . However, none of these studies quantitatively addressed the correlation between the distribution of hydrophobic sites and dewetting as well as the strength of hydrophobic interactions. The related problem of how water behaves next to single heterogeneous surfaces has been addressed in a recent study using coarse grained modeling of the interace between water and heterogeneous surfaceschandler_fd08 .
It is also of great interest to investigate the extreme case where one plate is highly hydrophobic and the other hydrophilic. In an intriguing experiment Granick and coworkers investigated just such a system. They studied a Janus interface in which a water slab is trapped between a hydrophobic wall on one side and a hydrophilic wall on the othergranick1_2002 and found that it prevents any macroscopic drying or cavitation of the liquid, which in any case would be strongly affected even by relatively weak van der Waals forces.
Much work has been done on the non-additivity of hydrophobic interactions through calculations of PMF between simple small hydrophobic solutes in dilute solution. Rank_ps97 ; Czaplewski_ps00 ; Czaplewski_jcp02 ; Czaplewski_ijqc02 ; Czaplewski_bc03 ; Shimizu_jcp01 ; Shimizu_pro02 ; Chan_jacs05 ; Palma_cpl96 ; Palma_ebj98 ; Levitt_ps97 ; Levitt_pnas01 ; Ghosh_jpcb03 ; Hummer_jacs99 It has been suggested that long range hydrophobic interactions caused by the many-body character of the PMF Martorana_bpj97 is relevant for the energetics within Moza_pnas06 ; Keskin_jmb05 ; Reichmann_pnas05 or between Moza_pnas06 distinct “hot regions” of interacting protein surfaces. This is very important for the prediction and modulation of protein-protein interactions. Although the non-additive effect was found to be insensitive to the strength of the solute-solvent van der Waals interaction Czaplewski_ijqc02 , it was shown to increase with the size of the hydrophobic solutes Ghosh_jpcb03 ; Czaplewski_ijqc02 . The neglect of the length-scale dependence of hydrophobic solvation results in the failure to predict cooperativity for three-body hydrophobic association in current surface area based nonpolar models Chen_pccp08 . Previous studies of non-additivity were performed for simple hydrophobic solutes like methane, where the sizes of the clusters that form are small. Since proteins surfaces are heterogeneous with mixed “small” and “large” hydrophobic regions, it is of interest to study the non-additive effect in the association of nanoscale hydrophobic assemblies in a heterogeneous context.
Our aim in this paper is to determine how the distribution of the constituent hydrophobic and hydrophilic particles determines the hydrophobic interaction between such amphiphilic surfaces. We perform systematic molecular dynamics simulations of different surfaces characterized by the same size and same number of hydrophobic and hydrophilic particles, which are distributed in different patterns. Our results show that the behavior of water confined between two identical amphiphilic plates greatly depends on the distribution of the hydrophobic and hydrophilic particles on the plates. This effect is manifested by the existence or absence of a dewetting transition as well as by attractive or repulsive solvent induced interactions between the plates. We propose a parameter, the average number of hydrophobic nearest neighbors of a hydrophobic particle, to describe the degree of clustering of the hydrophobic particles on the surface, and show that the behavior of confined water (dewetting or cavitation) is correlated with the value of this parameter. We also observe that for drying to occur the minimum area for clustered hydrophobic particles on the surface is (1.041.04) nm2 and we call this the critical area for the drying transition. These results demonstrate a strong cooperativity in the hydrophobic interaction between surface hydrophobic domains of varied length scale. In addition, our results show that it is not possible to predict the critical distance for dewetting between heterogeneous surfaces by using the contact angle obtained by the Cassie equation (Eq.(3)) in Eq.(1). We also carried out simulations of water confined to a Janus interface (where one plate is hydrophobic and the other is hydrophilic). In these simulations we find that the gap between these plates remains wet if the partial charges on the hydrophilic plates are sufficiently large. However, for small partial charges a drying transition is observed. In this case, the critical distance for dewetting can be obtained from the average of the critical distance for the pure hydrophobic system (where the two plates are hydrophobic) and that for the pure hydrophilic system.
II Methods
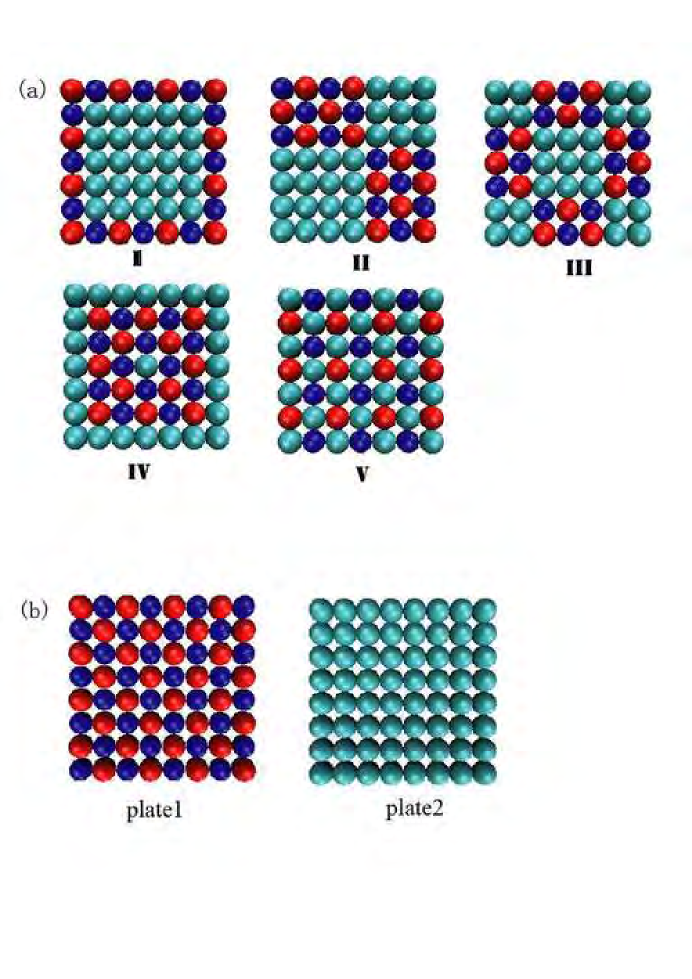
We studied the thermodynamics of the association process of two identical large amphiphilic plates composed of hydrophobic and hydrophilic particles. Each surface is represented by, a single-layered plate of, 49 atoms arranged in a 77 square lattice with a bond length of 0.32 nm. Each plate has 25 hydrophobic atoms and 24 hydrophilic atoms. The Lennard-Jones (LJ) parameters for the interaction between plate atoms on different plates are nm and kJ/mol, values lying in the same range as in our previous work.Zangi06 ; Ronen_jacs07 We represent hydrophilic atoms in two ways. In the first approach, the hydrophilic particles are represented by the same LJ parameters as for hydrophobic particles, however, they have nonzero partial charges. Since all the surfaces we generated are electrically neutral, the number of positive and negative particles is the same. In one set of simulations we studied hydrophilic particles with partial charges of Q= e, and in another set with partial charges of Q= e. In the second approach, we represented hydrophilic particles with a large well-depth of the LJ potential (1.30–2.0 kJ/mol), which is considerably larger than that for the hydrophobic particles (0.5–1.0 kJ/mol). Nevertheless, the LJ diameter was taken to be the same as that for the hydrophobic particles, nm. We investigated five different patterns of hydrophobic/hydrophilic particle distributions on the plates (pattern I-V) (see Figure 1(a)).
The two plates were solvated in 1147 water molecules. We chose the SPC/E modelBerendsen87 of water and used combination rules (arithmetic average for and geometric average for ) to calculate the water-plate interactions. Analysis of the water density profile next to the plates suggests that the strength of the attraction between the water molecules and these plates is very similar to that of water and a hydrocarbon monolayer described at atomic levelLi06 . In addition, recent simulationsZangi08 investigating the contact angle of water on the most hydrophobic surface studied here, 0.5 kJ/mol, find its value to be 119∘. This value is similar to the values obtained for self-assembled octadecanethiol monolayer on silverZhu02 (117∘), and on goldPlant95 (105∘) surfaces.
During simulations, the positions of the plate atoms are held fixed, interactions between atoms on the same plate are excluded, and the orientation of the two plates with respect to each other is parallel and in-registry. The alignment of the surface patterns with respect to each other is such that hydrophobic particles on one plate are superimposed on hydrophobic particles on the other plate. For hydrophilic particles, positive charged particles on one plate are superimposed on negative charged particles on the other plate.
We used the Molecular Dynamics (MD) package GROMACS version 3.1.4Lindahl01b to perform the computer simulations, with a time step of 0.002 ps. The bond distances and angle of the water molecules were constrained using the SETTLE algorithmMiyamoto92 . The system was maintained at a constant temperature of 300 K and pressure of 1.0 bar using the Berendsen thermostatBerendsen-thermo . The electrostatic forces were evaluated by the Particle-Mesh Ewald method (with grid spacing of 0.12 nm and quadratic interpolation) and the LJ forces by a cutoff of 1.0 nm.
The potential of mean force (PMF) between the two plates was computed from the mean force acting on each of the platesPangali78 ; Watanabe86 . Then the mean force acting between the plates along their axis of separation was integrated as a function of the distance between the plates, , to yield the free energy profile. As the PMF represents only relative values, it was shifted such that the free energy of the state at the largest separation corresponds to zero. For each pattern (I-V), we performed 46 simulations with different values of plate separation, , ranging from 0.36–2.0 nm. At each value of , the system was equilibrated for 2.0 ns and data was collected for 4.0 ns. At points where the force converged slowly (around the wetting/drying transition), the data collection stage was extended for an additional 5.0 ns. In the analysis of the hydration of the plates at each for each pattern, the error in the quantities obtained from the simulations was estimated using the block averaging methodFlyvbjerg89 .
III Results
The dependence of solvation on the distribution of hydrophobic particles
The behavior of water molecules between two amphiphilic plates depends on the distance between the plates, the distribution of hydrophobic particles on the surface, and the nature and strength of the interaction between the particles (hydrophilic and hydrophobic) and water. Zhou_science04 First we study plates in which the hydrophilic sites are charged spheres with either e or e to represent weak and strong hydrophilic particles, respectively.
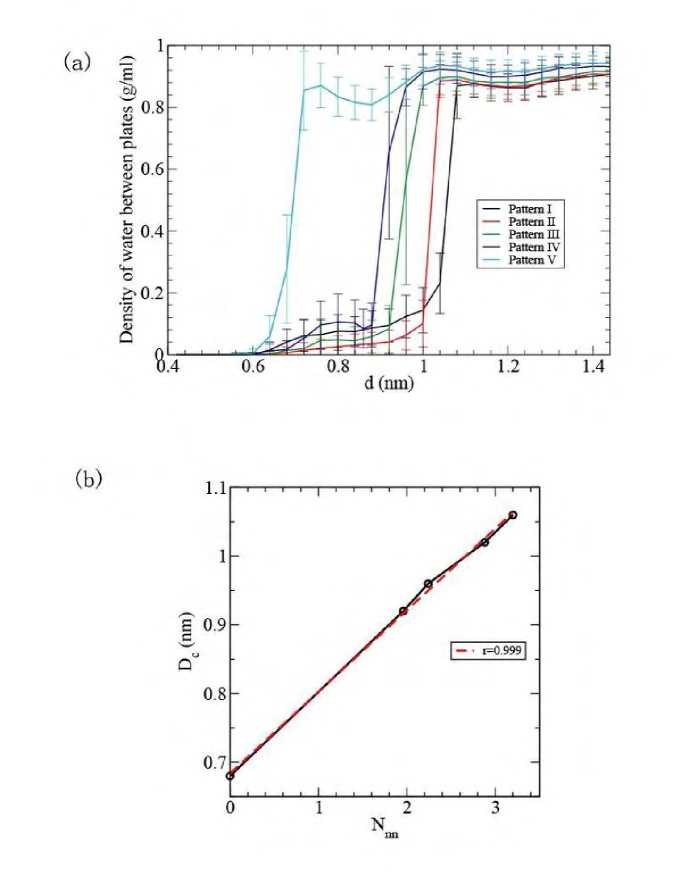
Figure. 2 (a) shows the density of water between two plates for the five different distribution patterns (shown in Figure 1(a)) as a function of the inter-plate distance when the magnitude of the partial charge of the hydrophilic particles is equal to 0.4 e. Dewetting transition was observed in the inter-plate region for all the patterns except for pattern V, which is characterized by a uniform distribution of hydrophobic and hydrophilic particles. An absence of a drying transition for a uniform distribution of polar and non-polar sites was reported by Koishi et alKoishi_jcp05 . In pattern V, the sharp decrease of water density near nm is due to steric effects, i.e. at nm a layer of water cannot fit between the two plates. Note that is the distance between the center of mass of the particles on each plate along the -axis. Thus, the available space between the plates is, approximately, . Interestingly, pattern IV with charged particles arranged in the center of the plates can dewet when . Dewetting in this pattern might be due to surface dipoles of small magnitude formed by charged particles in which the distance between neighboring positive and negative charged particles is small. This is in agreement with the finding that a silica surface, with partial charges scaled by 0.4, is macroscopically hydrophobic. Rossky_jpcb07 The critical distance, , for dewetting for each pattern is listed on Table 1.
In order to correlate the geometrical pattern of each plate with its critical distance, we propose a parameter, the average number of hydrophobic nearest neighbors () to characterize each pattern. We define as follows:
| (4) |
Where is the number of nearest hydrophobic neighbors of hydrophobic particle , which has the maximum value of 4, and =25 is the number of hydrophobic particles. We assume that the closer the hydrophobic cluster is to the center of the plate the larger will be the critical distance for dewetting, but due to the small size of the plates in our system, might not be sensitive to the distance between a hydrophobic particle and the center of the plate. Based on Equ.4, we find a strong linear correlation between and with the correlation coefficient of 0.999 (see Fig. 2 (b)). Thus, as a measure of the degree of clustering for the assembly of hydrophobic particles on the plate, is capable of discriminating between the different patterns with respect to the solvation between two plates.
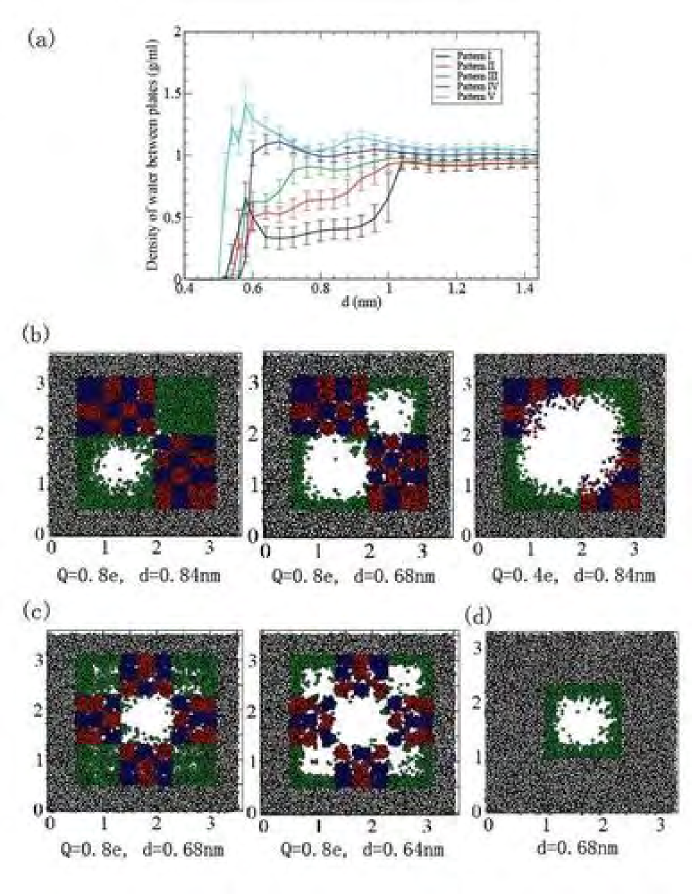
When the magnitude of the charge of the hydrophilic particle is e, a similar trend was found for the effect of the distributions of hydrophobic particles on the solvation of the inter-plate region as in the case for e. However, a dewetting transition is suppressed in most patterns. Water depletion was found in patterns I–III and the extent of depletion is linearly proportional to for each pattern at the same plate-plate separation. Patterns IV–V stay hydrated until water is expelled because of steric effects. Note that water molecules are trapped more tightly in pattern V than in pattern IV, leading to a higher density of confined water than in the former, which is also consistent with their relative values of (see Fig. 3). For all the patterns water density does not decrease to zero at nm as in the case of e, that is due to the strong electrostatic attractive interaction between water and the charged particles which reduces the distance for steric expulsion.
Although we did not observe strong dewetting transitions for most patterns when e, we did observe stepwise cavitations for pattern II and pattern III. These patterns are characterized by multiple hydrophobic domains of different size distributed on the plate surfaces. Pattern II, which has the second largest , contains two hydrophobic domains arranged in 44 (1.361.36 nm2) and 33 (1.041.04 nm2) square lattice domains. During the association of two plates, a big cavity is first formed between the larger hydrophobic domains (see Fig. 3 (b) when nm). This is followed by the formation of a second cavity between the smaller hydrophobic domains at smaller plate-plate distance (see Fig. 3 (b) when nm). For 0.68 nm the hydrophobic domains are dry, and the water molecules between the hydrophilic domains are finally squeezed out into the bulk. It is interesting to point out that we did not find any stepwise cavitation for this pattern for weak hydrophilic particles ( e). Instead, a large cavity forms without preference for the particles’ hydrophobicity, covering hydrophobic and hydrophilic regions at the same time (see Fig. 3 (b) when nm). The stepwise cavitation we observe for pattern II is also observed for pattern III when e. However, in this case the cavities appear at smaller plate-plate distances, which almost can not contain more than one layer of water, compared with that for pattern II (see Fig 3 (c)). Thus, strongly hydrophilic particles restrain cavities locally to regions between hydrophobic domains and the cavities occur one after another based on the size of hydrophobic domains when bringing two plates from far apart into contact. These observed stepwise cavitations might be related to the size dependence of the amplitude of interfacial capillary-wave fluctuations as well as the probability of tube formation bridging vapor-film interfaces involved in the dewetting dynamics in the confined region.chandler4_1998 The smallest hydrophobic domain area capable of inducing a cavity between the two plates, is found to be 1.041.04 nm2 (see Fig 3 (d)), which is consistent with the first cavitation in pattern III (Fig 3 (c) when nm). Comparing the distances at which each cavity is formed during the association of the two plates for pattern II and pattern III, we find that stepwise cavitation for each pattern occurs at inter-plate distances which are linearly correlated with . Thus, the larger the value of for the entire pattern, the larger will be the gap distances of the stepwise cavitation.
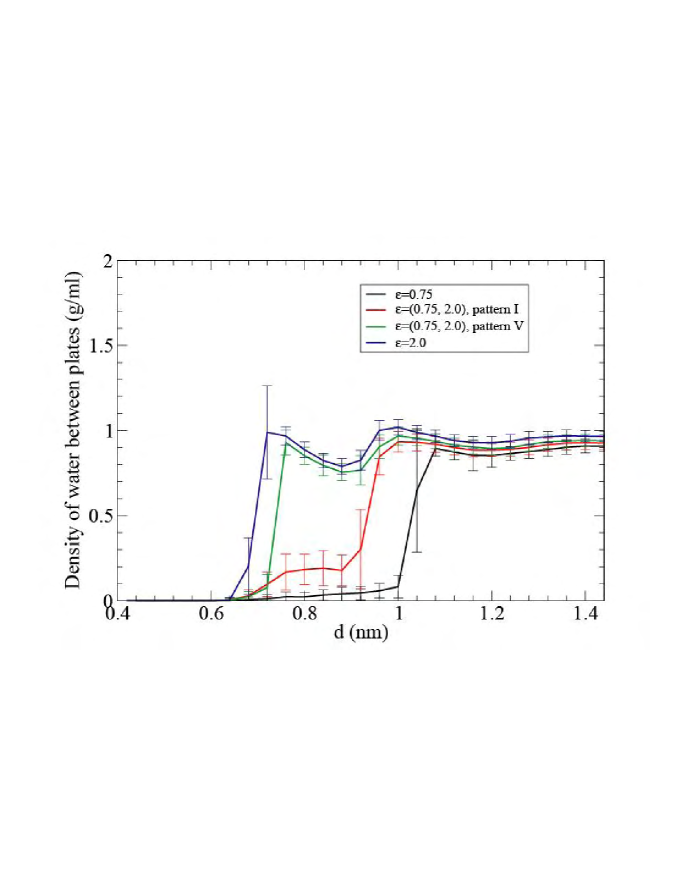
In order to investigate the sensitivity of these results to the nature of the particle’s hydrophilicity, we repeated these simulations, for the case where the hydrophilic particles were uncharged (neutral LJ particles), but with a larger attractive interaction, , than for hydrophobic particles. In order to probe which values of can be regarded as hydrophilic and which hydrophobic, we performed additional simulations where all of the particles were taken to be the same and found that the threshold value of below which a drying transition is observed is 1.0 kJ/mol. Thus, we define particles with 1.0 kJ/mol as hydrophobic and particles with 1.0 kJ/mol as hydrophilic. Returning to the studies on heterogeneous surfaces, we performed simulations with kJ/mol for hydrophilic particles and kJ/mol for hydrophobic particles. Fig. 5 shows the results for the two extreme cases of the distribution of hydrophobic/hydrophilic particles. We find that when hydrophobic particles are placed at the center of the plates as in pattern I, a strong dewetting transition is observed in the inter-plate region (red); whereas the inter-plate region remains hydrated if the distribution is uniform as in pattern V (green). These results are qualitatively the same as the case where the hydrophilic particles are represented as charged particles.
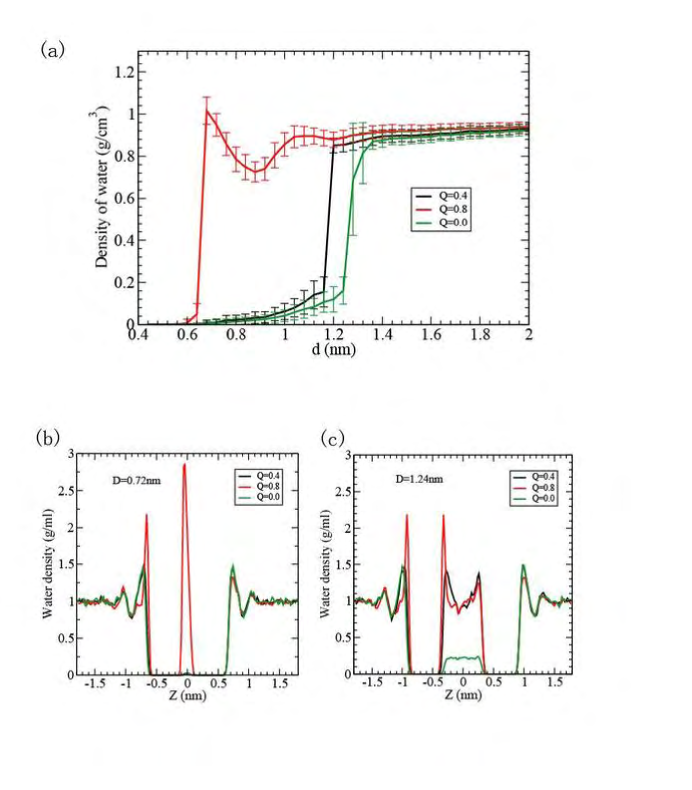
In pattern I-V, the alignment of the two plates with respect to each other is such that the coordinates of the hydrophobic and hydrophilic particles on one plate are the same as on the other plate. It is also interesting to examine the behavior of water between two different surfaces. We study an extreme case of two plates which form a Janus interface granick1_2002 (see Fig. 1(b)). One plate (plate1 in Fig. 1(b)) is hydrophilic with positive and negative charged particles uniformly distributed on an 88 square lattice with the same bond length as for pattern I-V, while the other plate (plate2) is purely hydrophobic. The same simulations were performed for this case as for each of the other patterns. The density of water in this Janus-interface is shown in Fig. 4(a) with respect to different partial charges . The Janus interface dewets when e and its critical distance for dewetting is about 1.18 nm, which is a little bit smaller than the one (1.28 nm) for e in which case both plates are purely hydrophobic. However, when the charges are increased to e, no dewetting is found between the two plates. Fig. 4 (b) and (c) show the density of water along the Z-axis of the simulation box (which is perpendicular to the plate surfaces) for inter-plate distances nm and nm, respectively. Only water molecules inside a rectangular box along the Z-axis of the simulation box with nm and nm (in the XY plane) are considered in these plots. (The origin of the coordinate system is the mid-point of the straight line connecting the centers of mass of the two plates. The hydrophilic plate is placed at the negative values of the -axis.) These distributions indicate that in the presence of one purely hydrophobic surface, the strong hydrophilic surface ( e) attracts water into the gap even when it would be geometrically impossible for this gap to accommodate one layer of water for e (see the sharp peak in red around nm in Fig. 4(b)). When e, the density of water near the outside surface (toward solvent) of the weak hydrophilic plate is similar to that near hydrophobic surface with e (see the peaks in black and green with similar magnitude near nm for nm and those near nm for nm). However, the density of water in the gap region increases for e compared to e for the plate-plate distance of 1.24 nm. These results are consistent with the observation of dewetting in pattern IV corresponding to e with hydrophilic particles distributed at the centers of the plates and hydrophobic particles on their borders. It also indicates that the weak hydrophilic plate with e is macroscopically hydrophobic. Thus, the behavior of water in the Janus interface depends on the polarity of the hydrophilic surface, i.e. the strength of the interactions between hydrophilic particles and water.
Based on the simple macroscopic theory (see Equ. 1), the average of () should be used in the calculation of for the two different plates in the Janus interface. To predict for the Janus case with e based on this simple theory, we repeated simulations for two identical, purely hydrophilic plates with partial charge e (same as plate1 in Fig. 1(b)). A dewetting transition was observed between these two plates and the critical distance for dewetting was found to be in the neighborhood of 1.10 nm. We then determined the critical distance for the Janus case with e from the average of for the pure hydrophilic plates ( nm) with e and for the pure hydrophobic plates ( nm). The average is 1.19 nm, essentially equal to the value ( nm) obtained from simulation of the Janus interface, indicating that the critical distance of dewetting in Janus interfaces can be predicted from the given for pure hydrophilic plates (same to plate1 in Fig. 1 (b)) and for pure hydrophobic plates (same as plate2 in Fig. 1 (b)).
III.1 Potentials of mean force
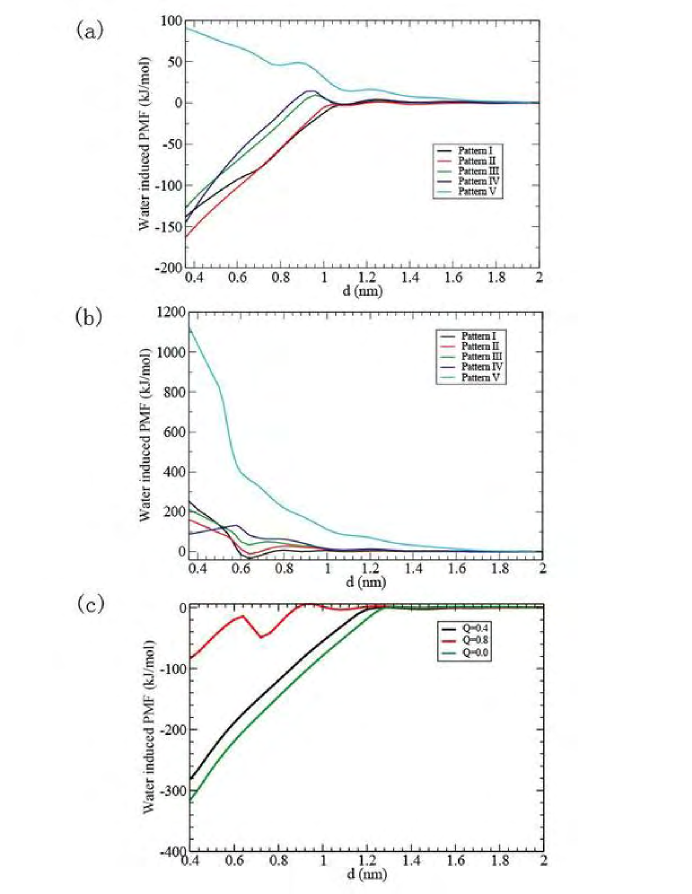
Figure 6 (a) and (b) show the water induced PMF of the amphiphilic plates for the different patterns (I-V), as a function of the plate-plate distance. For e (see Fig. 6 (a)), the water induced force between two plates is attractive for pattern I–IV, while repulsive for pattern V, which has the smallest value of among all five patterns and is the only one that does not display a dewetting transition. The difference in the water induced PMF for bringing the two plates from far apart to contact (=0.40 nm) between the different patterns is very large; it is about 230 kJ/mol between pattern I and pattern V. While patterns III and IV display free energy barriers for dewetting, patterns I and II do not. At small distances, the water induced PMF is less negative for pattern I than for pattern II, probably because the water molecules like to stay in the gap due to their strong electrostatic interaction with charged particles on the edges of plates in pattern I compared with that in pattern II. When the partial charge of the hydrophilic particles is increased to e, the water induced PMF is positive for almost all the patterns except for pattern I and pattern II in which the water induced force is attractive in a small range of inter-plate distance with a minimum at about nm (see Fig. 6 (b)). This corresponds to the cavitation or partial dewetting when two plates approach toward each other. The water induced repulsive force in the gap region for pattern V is very large in comparison with that for the case of e. This means that it is very hard to remove water molecules from the inter plate region with strong hydrophilic particles.
The solvent induced free energy of interaction (or the solvent induced part of the PMF) between two plates in the Janus interface as a function of their separation is shown in Figure 6 (c) for different partial charges on the hydrophilic plate. For both partial charges ( or e), the water induced interactions between the plates are attractive even though the Janus interface with e does not exhibit dewetting while the interface with e does. Nevertheless, for e the magnitude of the attractive interaction, as well as the shape of the curve which exhibits a solvent separated minimum and a barrier to remove this solvent layer, corresponds to an absence of dewetting. The difference in the solvent induced PMF for the Janus case and for the case with purely hydrophobic plates ( e) (which also shows dewetting) increases significantly as the partial charge on the hydrophilic plate increases. This difference can be as large as 240 kJ/mol when is e relative to that for e.
IV Discussion and Conclusions
Our previous studies of proteins Hua_jpcb07 indicated that although large matched and connected hydrophobic areas are correlated with a dewetting transition between two domains or oligomers, they are not sufficient to predict it. In this work, we aimed to determine a relationship between the magnitude of surface hydrophobicity and the spatial distribution of hydrophobic and hydrophilic domains on the surface. We determined the potential of mean force and through it the strength of the solvent induced interaction between two parallel identical amphiphilic plates, which should be regarded as an idealized model that might serve as a metaphor for protein inter-domain, or inter-oligomer interactions. The incorporation of hydrophilic particles in our model system was performed to mimic the effect of charged and polar side chains on the properties of the interface. We represented hydrophilic particles in two ways. The first is as particles with non-zero partial charges (), and the second is by LJ particles with a large well-depth (), significantly larger than that for the hydrophobic particles. Since the number of hydrophobic and hydrophilic particles is constant (and the alignment of the different type of particles on the two opposing surfaces is in-registry, see Section II), the differences in the behavior of water in the gap must arise from the different spatial distributions of the hydrophobic and hydrophilic particles on the plates (at the given strength of water-particle interactions).
We examined five different hydrophobic/hydrophilic particle distributions on the amphiphilic plates. Our results show that there are qualitative and quantitative differences in the behavior of the water for these different distributions. This is manifested by the existence or absence of a dewetting transition and by attractive or repulsive solvent induced interactions. Since the existence of a dewetting transition is sensitive to the strength of the solute-solvent attractions Zhou_science04 , we also studied how weak and strong hydrophilic particles affect the solvation of the inter-plate region for different plate patterns. In the case of weak hydrophilic particles (=0.4 e), most patterns exhibit a dewetting transition and the observed critical distance for dewetting, , varies for different patterns. The simulation results show a linear correlation between and a proposed order parameter that describes the spatial arrangement of the particles on the plates. This order parameter, the average number of hydrophobic nearest neighbors (), is a measure for the degree of cooperativity for an assembly of hydrophobic particles on a surface. For example, for a pattern with a large cluster of hydrophobic particles at the center of the plates (pattern I), and are both larger than for any other pattern. On the other hand, for a pattern where the hydrophobic/hydrophilic particles are uniformly distributed (pattern V), and are both found to be smaller than for any other pattern. In this case, no dewetting transition occurs. Our proposed parameter, , seems to be able to discriminate between the different patterns and correlates highly with the critical distance for dewetting. For amphiphilic plates with strongly hydrophilic particles (= 0.8 e), the dewetting transition is suppressed in most patterns. However, the extent of water depletion in each pattern at the same plate-plate distance is linearly proportional to . Thus, is a good estimation of overall surface hydrophobicity. In addition, stepwise cavitations are found in systems with large hydrophobic domains in regions defined by the clustered hydrophobic domains. We found that the minimum area of the hydrophobic domain necessary to induce an adjacent cavity is 1.041.04 nm2. Of course, the differences in the hydration of the inter-plate region corresponding to different patterns might lessen or disappear entirely if the hydrophilicity is made stronger. We did not investigate how the dewetting transition responds to misaligning the plates, but we expect it to be sensitive to their relative orientations. However we did investigate the behavior of water between two plates forming a Janus interfacegranick1_2002 consisting of one hydrophobic and one hydrophilic plate and found that the result depends on the polarity of the hydrophilic plate with the critical distance for dewetting being inversely correlated with the strength of hydrophilicity of the plate. The drying transition disappears entirely when the charges on the hydrophilic plate are sufficiently large ( e). Our observation is consistent with an intriguing experiment performed by Granick and coworkers who investigated the hydrophobicity of a Janus interface.granick1_2002 . They found that the hydrophobic surface prevents macroscopic drying or cavitation of the liquid. This allowed them to focus on more intrinsic local properties of interfacial water near extended hydrophobic and hydrophilic surfaces, and to compare and contrast water behavior in the different regions. Shear deformations produced by moving the hydrophobic surface resulted in very large noisy fluctuations consistent with the picture of damped capillary waves at the hydrophobic surface arising from partial dewetting. Film-spanning fluctuations that might lead to macroscopic dewetting between hydrophobic surfaces were suppressed by pinning of water at the hydrophilic wall. Our simulations give evidence that the critical distance of dewetting for the Janus interface can be predicted based on the simple macroscopic theory according to which it is the the average of ’s for two pure hydrophobic plates (same as the hydrophobic plate in the Janus interface) and two pure hydrophilic plates (same as the hydrophilic plate in the Janus interface).
In addition we also investigated the effect of the different patterns on the strength of the inter-plate interaction. This was done by calculating the PMF between the plates. In analogy to solvent induced interactions between hydrophobic particles, we found that for a pattern with a large hydrophobic cluster, the inter-plate water-induced interaction is attractive (qualitatively, similar to the solvent induced interactions between homogeneous hydrophobic particles). However, for a pattern where the hydrophobic/hydrophilic particles are uniformly distributed, the solvent induced interaction is repulsive. This effect is substantial; the difference in the free energy change for the association process between these two patterns can be as large as 230 kJ/mol. Physically, this qualitative difference in the induced potential of mean force can be attributed to the fact that for one pattern, it is easier, (negative induced PMF), on average, to strip off a water molecule from the plate interface than from around another water molecule in the bulk, while for another pattern it is harder (positive induced PMF). The solvent induced interaction between two plates which form a Janus interface is attractive (but less so for larger partial charges) even when the partial charges on the hydrophilic plate are large enough to suppress dewetting between plates. The free energy barrier for dewetting for the strong hydrophilic system ( e) reflects the free energy cost of stripping out the layer of water bound to the strongly hydrophilic surface as the plates approach each other. The PMFs of the Janus interface which display dewetting ( e) is qualitatively similar to other systems that exhibit drying. However, for the Janus interface with e, where the drying transition is absent, the curve of the PMF is different in shape and displays a minimum and a barrier that are associated with a solvent-separated layer.
It is known that in order to describe stable native structure of known protein folds in a united (amino-acid) residue description, pairwise additive interactions are insufficient Vendruscolo_pro00 ; Tobi_pro00 . It has been shown Chan_pro00 ; Sorenson_fd98 ; Plotkin_jcp97 ; Dill_jbc97 that only by including information about the many-body interactions, can one predict protein collapse or folding, similar to what is found in experiments. This cooperativity can arise from many groups in the protein. In this paper we demonstrated the importance of cooperativity for hydrophobic particles. Since non-additivity is likely to arise in systems with a strong solvent-induced effect, it is possible that the many-body effect found in proteins originates from the hydrophobic side-chain residues.
In summary, we used molecular dynamics to study the thermodynamics of water confined between two amphiphilic plates, and found that different distributions of hydrophobic and hydrophilic particles on the plates give rise to qualitatively different large scale water structures and water induced plate-plate forces. The results are sensitive to how strongly hydrophobic and hydrophilic the particles are. Our qualitative conclusions seem to be insensitive to whether the hydrophilic plates consist of particles which have coulomb interactions through partial charges or consist of particles that have strong LJ attractions with the solvent. Since for all patterns involved in the study of identical plates the number of hydrophobic and hydrophilic plate particles is the same, the results point to the breakdown of the Cassie equation and demonstrate that the hydrophobic interactions are strongly cooperative. We also investigated plate-plate interactions and the interplate large scale water structure in the Janus interface between a hydrophobic plate and a hydrophilic plate and found that when one of the plates is sufficiently hydrophilic it pins water molecules, eliminating the fluctuations that lead to drying.
Acknowledgments This research was supported by the National Science Foundation via grant (NSF-CHE-13401).
References
- (1) Ball, P. Nature 2003, 423, 25–26.
- (2) Scheraga, H. J. Biomol. Struct. Dyn. 1998, 16, 447–460.
- (3) Fersht, A. R. Structure and Mechanism in Protein Science; W. H. Freeman and Company: New York, 1999.
- (4) Hummer, G.; Garde, S.; Garcia, A. E.; Pratt, L. R. Chem. Phys. 2000, 258, 349–370.
- (5) Chandler, D. Nature 2005, 437, 640–647.
- (6) Stillinger, F. H. J. Solution Chem. 1973, 2, 141.
- (7) Wallqvist, A.; Berne, B. J. J. Phys. Chem. 1995, 99, 2893–2899.
- (8) Lee, C.; McCammon, J.; Rossky, P. Journal of Chemical Physics 1984, 80, 4448–4454.
- (9) Lum, K.; Chandler, D.; Weeks, J. D. J. Phys. Chem. B 1999, 103, 4570–4577.
- (10) Leung, K.; Luzar, A.; Bratko, D. Phys. Rev. Lett. 2003, 90, 65502(1–4).
- (11) Huang, X.; Margulis, C. J.; Berne, B. J. Proc. Nat. Acad. Sci. 2003, 100, 11953–11958.
- (12) Mountain, R. D.; Thirumalai, D. J. Am. Chem. Soc. 2003, 125, 1950–1957.
- (13) Huang, D.; Chandler, D. Proceedings of the National Academy of Sciences of the United States of America 2000, 97, 8324–8327.
- (14) Huang, D.; Chandler, D. Journal of Physical Chemistry B 2002, 106, 2047–2053.
- (15) Lum, K.; Chandler, D. Int. J. Thermophysics 1998, 19, 845–855.
- (16) Ashbaugh, H.; Pratt, L. Rev. Mod. Phys. 2006, 78, 159.
- (17) Lum, K.; Luzar, A. Phys. Rev. E 1997, 56(6), R6283–R6286.
- (18) Wallqvist, A.; Berne, B. J. Phys. Chem. 1995, 99, 2893–2899.
- (19) Bolhuis, P. G.; Chandler, D. J. Chem. Phys. 2000, 113, 8154–8160.
- (20) TenWolde, P.; Chandler, D. Proceedings of the National Academy of Sciences of the United States of America 2002, 99, 6539–6543.
- (21) Maibaum, L.; Chandler, D. J. Phys. Chem. B 2003, 107, 1189–1193.
- (22) Hummer, G.; Rasaiah, J. R.; Noworyta, J. P. Nature 2001, 414, 188–190.
- (23) Li, X.; Li, J.; Eleftheriou, M.; Zhou, R. J. Am. Chem. Soc. 2006, 128, 12439–47.
- (24) Hua, L.; Huang, X.; Liu, P.; Zhou, R.; Berne, B. Journal of Physical Chemistry B 2007, 111, 9069–9077.
- (25) Liu, P.; Huang, X.; Zhou, R.; Berne, B. Nature 2005, 437, 159–162.
- (26) Miller, T.; Vanden-Eijnden, E.; Chandler, D. Proc. Natl Acad. Sci. USA 2007, 104, 14559–14564.
- (27) Maibaum, L.; Chandler, D. J. Phys. Chem. B 2007, 111, 9025–9030.
- (28) Willard, A.; Chandler, D. J. Phys. Chem. B 2008, 112, 6187–6192.
- (29) Zangi, R.; Hagen, M.; Berne, B. J. Am. Chem. Soc. 2007, 129, 4678–4686.
- (30) Singh, S.; Houston, J.; Swol, F. V.; Brinker, C. J. Nature 2006, 442, 526.
- (31) Zhou, R.; Huang, X.; Margulis, C.; Berne, B. Science 2004, 305, 1605–1609.
- (32) Giovambattista, N.; Debenedetti, P. G.; Rossky, P. J. Phys. Chem. B 2007, 111, 9581 –9587.
- (33) Choudhury, N.; Pettitt, B. M. jacs 2005, 127(10), 3556–3567.
- (34) Luzar, A.; Leung, K. J. Chem. Phys. 2000, 113, 5836–5844.
- (35) Christenson, H.; Claesson, P. Advances in Colloid and Interface Science 2001, 91, 391–436.
- (36) Willard, A.; Chandler, D. Faraday Discuss. 2009, 141, 209–220.
- (37) Cheng, Y.; Rossky, P. Nature 1998, 392, 696–699.
- (38) Cassie, A. Discuss Faraday Soc. 1948, 3, 11.
- (39) Cassie, A. Discuss Faraday Soc. 1952, 75, 5041.
- (40) Lundgren, M.; Allan, N.; Cosgrov, T. Langmuir 2007, 23, 1187–1194.
- (41) Brandon, S.; Haimovich, N.; Yeger, E.; Marmur, A. J. Colloid Interface Sci. 2003, 263, 237.
- (42) Padday, J. Wetting, Spreading and Adhesion; Academic Press: New York, 1978.
- (43) Koshi, T.; Yasuoka, K.; Zeng, X.; Narumi, T.; Susukita, R.; Kawai, A.; Furusawa, H.; Suenaga, A.; Okimoto, N.and Futatsugi, N.; Ebisuzaki, T. Phys. Rev. Lett. 2004, 93, 185701–1,4.
- (44) Koshi, T.; Yasuoka, K.; Ebisuzaki, T.; Yoo, S.; Zeng, X. J. Chem. Phys. 2005, 123, 204707.
- (45) Giovambattista, N.; Debenedetti, P.; Rossky, P. J. Phys. Chem. C 2007, 111, 1323–1332.
- (46) Zhang, X.; Zhu, Y.; Granick, S. Science 2002, 295, 663–666.
- (47) Rank, J.; Baker, D. Protein Sci. 1997, 6, 347–354.
- (48) Czaplewski, C.; Rozdiewicz-Motowidlo, S.; Liwo, A.; Ripoll, D.; Wawak, R.; Scheraga, H. Protein Sci. 2000, 9, 1235–1245.
- (49) Czaplewski, C.; Rozdiewicz-Motowidlo, S.; Liwo, A.; Ripoll, D.; Wawak, R.; Scheraga, H. J. Chem. Phys. 2002, 116, 2665–2667.
- (50) Czaplewski, C.; Ripoll, D.; Liwo, A.; Rozdiewicz-Motowidlo, S.; Wawak, R.; Scheraga, H. Int. J. Quant. Chem. 2002, 88, 41–55.
- (51) Czaplewski, C.; Rozdiewicz-Motowidlo, S.; Dabal, M.; Liwo, A.; Ripoll, D.; Scheraga, H. Biophys. Chem. 2003, 105, 339–359.
- (52) Shimizu, S.; Chan, H. J. Chem. Phys. 2001, 115, 1414–1421.
- (53) Shimizu, S.; Chan, H. Proteins 2002, 49, 560–566.
- (54) Moghaddam, M.; Shimizu, S.; Chan, H. J. Am. Chem. Soc. 2005, 127, 303–316.
- (55) Bruge, F.; Fornili, S.; Malenkov, G.; Palma-Vittorelli, M.; Palma, M. Chem. Phys. Lett. 1996, 254, 283–291.
- (56) San Biagio, P.; Bulone, D.; Martorana, V.; Palma-Vittorelli, M.; Palma, M. Eur. Biophys. J. 1998, 27, 183–196.
- (57) Tsai, J.; Gerstein, M.; Levitt, M. Protein Sci. 1997, 6, 2606–2616.
- (58) Raschke, T.; Tsai, J.; Levitt, M. Proc. Natl. Acad. Sci. USA 2001, 989, 5965–5969.
- (59) Ghosh, T.; Garcia, A.; Garde, S. J. Phys. Chem. B 2003, 107, 612–617.
- (60) Hummer, G. J. Am. Chem. Soc. 1999, 121, 6299.
- (61) Martorana, V.; Bulone, D.; San Biagio, P.; Palma-Vittorelli, M.; Palma, M. Biophy. J. 1997, 73, 31–37.
- (62) Moza, B.; Buonpane, R.; Zhu, P.; Herfst, C.; Nur-ur Rahman, A.; McCormick, J.; Kranz, D.; Sundberg, E. Proc. Natl. Acad. Sci. USA 2006, 103, 9867.
- (63) Keskin, O.; Ma, B.; Nussinov, R. J. Mol. Biol. 2005, 345, 1281–1294.
- (64) Reichmann, D.; Rahat, O.; Albeck, S.; Meged, R.; Dym, O.; Schreiber, G. Proc. Natl. Acad. Sci. USA 2005, 102, 57–62.
- (65) Chen, J.; Brooks, C. I. Phys. Chem. Chem. Phys. 2008, 10, 471–481.
- (66) Zangi, R.; Berne, B. J. J. Phys. Chem. B 2006, 110, 22736–22741.
- (67) Berendsen, H. J. C.; Grigera, J. R.; Straatsma, T. P. J. Phys. Chem. 1987, 91, 6269–6271.
- (68) Li, X.; Li, J.; Eleftheriou, M.; Zhou, R. J. Am. Chem. Soc. 2006, 128(38), 12439–12447.
- (69) Zangi, R.; Berne, B. J. J. Phys. Chem. B 2008, 112, 8634–8644.
- (70) Zhu, Y.; Granick, S. Phys. Rev. Lett. 2002, 88, 106102.
- (71) Plant, A. L.; Brighamburke, M.; Petrella, E. C.; Oshannessy, D. J. Analytical Biochem. 1995, 226, 342–348.
- (72) Lindahl, E.; Hess, B.; van der Spoel, D. J. Mol. Mod. 2001, 7, 306–317.
- (73) Miyamoto, S.; Kollman, P. A. 1992, 13, 952–962.
- (74) Berendsen, H. J. C.; Postma, J. P. M.; van Gunsteren, W. F.; Haak, J. J. Chem. Phys. 1984, 81, 3684.
- (75) Pangali, C. S.; Rao, M.; Berne, B. J. In Computer Modeling of Matter; Lykos, P., Ed., ACS Symposium Series No. 86; ACS: Washington DC, 1978; page 29.
- (76) Watanabe, K.; Andersen, H. C. J. Phys. Chem. 1986, 90, 795–802.
- (77) Flyvbjerg, H.; Petersen, H. G. J. Chem. Phys. 1989, 91, 461–466.
- (78) Vendruscolo, M.; Najmanovich, R.; Domany, E. Proteins Struct. Funct. Genet. 2000, 38, 134–148.
- (79) Tobi, D.; Elber, R. Proteins Struct. Funct. Genet. 2000, 41, 40–46.
- (80) Chan, H. Proteins Struct. Funct. Genet. 2000, 40, 543.
- (81) Sorenson, J.; Head-Gordon, T. Folding Des. 1998, 3, 523.
- (82) Plotkin, S.; Wang, J.; Wolynes, P. J. Chem. Phys. 1997, 106, 2932.
- (83) Dill, K. J. Biol. Chem. 1997, 272, 701.
| Pattern | ||
|---|---|---|
| I | 3.20 | 1.06 (1.04-1.08) |
| II | 2.88 | 1.02 (1.00-1.04) |
| III | 2.24 | 0.96 (0.92-1.00) |
| IV | 1.96 | 0.92 (0.88-0.96) |
| V | 0.00 | 0.68 (0.64-0.72) |
Figure Captions
Fig. 1: (a) The hybrid hydrophobic/hydrophilic plates with five different patterns of particle distribution, pattern I-V. (b) Janus faced plates: plate1 and plate2. The sphere in cyan represents hydrophobic particle, blue represent positive charged particle, red represent negative charged particle.
Fig. 2: (a) The density of water in the inter-plate region for pattern I-V as a function of inter-plate distance when e for hydrophilic particles. (b) The critical distance of dewetting transition as a function of the average number of hydrophobic nearest neighbors for each pattern. The red line is a linear fitting to the curve with correlation coefficient of 0.999.
Fig. 3: (a) The density of water in the inter-plate region for pattern I-V as a function of inter-plate distance when e for hydrophilic particles. (b) The view of a slab of water between two plates for pattern II. The water molecules are superimposed for 150 frames and are classified by different color based on their location. Water between opposite hydrophobic domains are represented in green; water between charged domains are in red and blue; water in the bulk are in silver. (c) the same as (b) except for pattern III. (d) the same as (b) except for the system of two plates, each of which is composed by 9 hydrophobic particles arranged in 33 square lattice with a bond length of 0.32 nm.
Fig. 4: (a) The density of the water molecules confined between two plates which form a Janus interface, for different hydrophilicity (magnitude of the partial charge ) of the hydrophilic plate (plate1, see Fig. 1 (b)). Red corresponds to partial charge of e, black for e, and green for e in which case plate1 is purely hydrophobic. (b) The density profile of the water molecules along -axis of the simulation box when the inter-plate distance is 0.72 nm. The origin =0 nm is the middle point of two centers of mass of two plates, and the hydrophilic plate is located at the negative values of the -axis. Only water molecules inside a rectangular box along the Z-axis of the simulation box with nm and nm (in the XY plane) are considered in these plots. (c) The same as (b) except for =1.24 nm.
Fig. 5: The density of water between two plates where particles are the same (black, blue) and where particles are distributed in pattern I (red) and in pattern V (green). Here hydrophilic particles are represented as neutral LJ particles with kJ/mol and the same is applied to hydrophobic except kJ/mol.
Fig. 6: (a) The water induced PMF of two hybrid plates for pattern I-V as a function of inter-plate distance when e for hydrophilic particles. (b) The same as (a) except that the charge of hydrophilic particles is e (c) The water induced PMF of two plates which form Janus interfaces as a function of inter-plate distance with respect to different partial charge of the charged particles on plate1 (see Fig. 1 (b)). Black is for partial charge e, red is for e and green is for e in which case plate1 is purely hydrophobic and identical to plate2.