Lattice and electronic anomalies of CaFe2As2 studied by Raman spectroscopy
Abstract
We report inelastic light scattering experiments on CaFe2As2 in a temperature range of 4 to 290 K. In in-plane polarizations two Raman-active phonon modes are observed at 189 and 211 cm-1, displaying A1g and B1g symmetries, respectively. Upon heating through the tetragonal-to-orthorhombic transition at about K, the B1g phonon undergoes a discontinuous drop of the frequency by 4 cm-1 whereas the A1g phonon shows a suppression of the integrated intensity. Their linewidth increases strongly with increasing temperature and saturates above . This suggests (i) a first-order structural phase transition and (ii) a drastic change of charge distribution within the FeAs plane through .
pacs:
74.70.Kn, 75.30.Gw,76.60.-kThe recently discovered iron-based superconductors RxFeAsO1-xFx (R=La,Nd,Ga,Sm) have triggered a burst of experimental and theoretical research activities because of the potential relevance to high-temperature superconductors. Kamihara ; Takahashi ; chen ; Ren The Fe-based and cuprates superconductors have remarkable similarities in structural and magnetic aspects. grant The undoped compound has a two-dimensional electronic structure and a long range spin density wave (SDW) antiferromagntic order at 134 K. Cruz Doping an undoped parent compound leads to a suppression of the magnetic order while inducing superconductivity. Luetkens
More recently, the ternary AxM1-xFe2As2 (A=K,Na; M=Ca,Sr,Ba) compounds have shown to share similar structural, magnetic, and superconducting properties with the RxFeAsO1-xFx. Rotter ; Ni Although the superconducting transition temperatures are a little lower, the ternary compounds have an advantage in addressing intrinsic superconducting properties owing to the lack of oxygen and the ease of growing sizable single crystals. Among the AFe2As2 family CaFe2As2 manifests the clearest first order SDW and structural phase transition, Ni08 making it optimally suitable for investigating the interplay between lattice and spin degrees of freedom and superconductivity.
The undoped CaFe2As2 has the tetragonal ThCr2Si2-type crystal structure (space group I4/mmm) with lattice parameters and . Upon cooling, a structural phase transition takes place from the high temperature tetragonal to the low temperature orthorhombic phase (Fmmm) around K. Ni08 Drastic changes in resistivity, magnetic susceptibility, and lattice parameters as well as narrow hysteresis suggest that the structural phase transition is of first order. In contrast, the sister compounds SrFe2As2 and BaFe2As2 exhibit a gradual change in resistivity. Yan This is ascribed to an extreme sensitivity of the structural instability to chemical, structural perturbations, and the presence of Sn-flux. The sharpness of the structural transition implies that CaFe2As2 is nearly free from such impurities. Concomitant with the structural transition, a magnetic transition to a commensurate antiferromagnetic ordering is companied with a saturated Fe moment of 0.8 . Goldman 75As NMR measurements show a discontinuous formation of the energy gap associated with the SDW instability, giving evidence for a first order magnetic transition as well. Baek Inelastic neutron scattering measurements unveiled anisotropic three dimensional magnetic behavior and a substantial spin gap. McQueeney
In this brief report, we present Raman scattering measurements of CaFe2As2 single crystals. Raman-active phonon modes show an abrupt change in frequency and linewidth around . This is consistent with a first order nature of the structural phase transition. Significantly, the 211 cm-1 mode jumps by 4 cm-1 through . Since this mode involves the displacement of Fe atoms along c-axis, this is interpreted in terms of a sensitivity of the electronic change of the FeAs plane to the out-of-plane vibration. Furthermore, the strong decrease of their linewidth below evidences a drastic change of the electronic density of state at due to the SDW instability.
Single crystals of CaFe2As2 were grown out of Sn flux using high temperature solution growth technique. Ni08 The high quality of the studied crystals is confirmed by an extensive characterization by means of X-ray, neutron diffraction, thermodynamic and transport technique. Ni08 ; Goldman For Raman measurements, a plate-like single crystal with dimensions of was chosen. The sample was held in vacuum of an optical cryostat, which is cooled by a closed cycle refrigerator to helium temperature. Raman scattering experiments were performed using the three different excitation lines nm (ArKr+ Laser), nm (Nd:YAG solid-state Laser), and nm (HeNe Laser) in a quasi-backscattering geometry. The laser power of 5 mW was focused to a 0.1 mm diameter spot on the surface of the single crystal. The heating of the sample did not exceed a few K. The scattered spectra were collected by a DILOR-XY triple spectrometer and a nitrogen cooled charge-coupled device detector with a spectral resolution of cm-1.
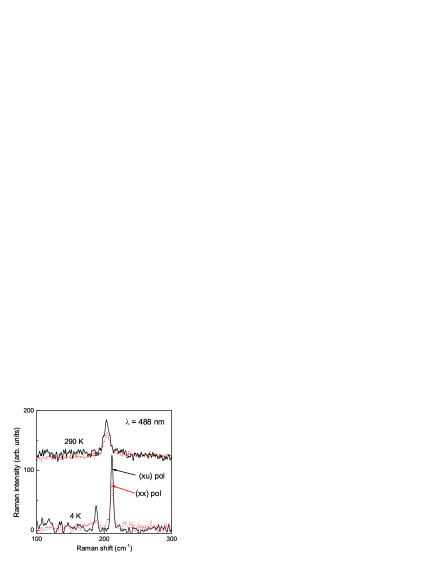
Figure 1 compares Raman spectra for (xx) and (xu) polarization at 4 and 290 K, respectively. In (xx) scattering geometry the incident and scattered light polarizations are parallel to the axis. In (xu) scattering configuration, the scattered light is not analyzed with respect to polarization. At room temperature we observe a single peak around 204 cm-1. At 4 K two sharp peaks at 189 and 211 cm-1 show up. The sharpness of the observed peaks testifies the high quality and homogeneity of the single crystal.
The factor group analysis yields four Raman-active phonon modes:
In the in-plane scattering geometry A1g and B1g modes are allowed, which correspond to the displacement of As and Fe atoms along the axis. The frequency and symmetry of the -point phonons are calculated by ab initio methods and compared to the experimental results of the isostructural compound SrFe2As2. Hadjiev ; Litvinchuk ; Yildirim Thus, by referring to the comparative study in SrFe2As2 we are able to identify the symmetry of the two peaks. The 189 and 211 cm-1 peaks are assigned to the A1g and B1g mode, respectively.
Here we note that the sample has a plate-like shape whose plane is perpendicular to the crystallographic c-axis. The observed Raman scattering intensity is extremely low and the sample thickness is of the order of the laser spot size. This restricts the scattering configuration to the plane. Furthermore, we collect the Raman spectra in the (xu) polarization because it gives a stronger intensity than the (xx) polarization and enables us to study the A1g and B1g modes simultaneously.
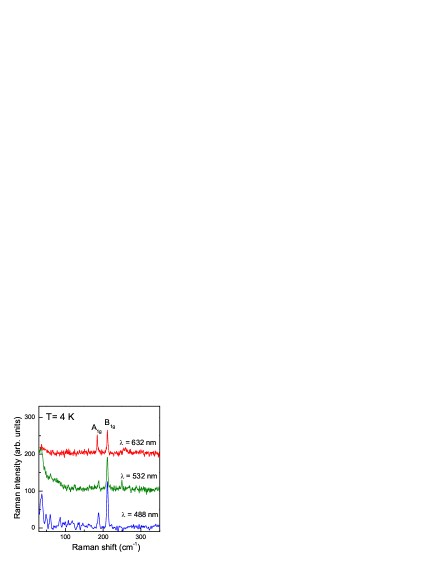
In Fig. 2 Raman spectra at three different laser lines are compared at 4 K. All laser lines show commonly the two sharp phonon peaks at 189 and 211 cm-1. For the blue and green laser lines, the intensity of the 189 cm-1 mode is weaker than that of the 211 cm-1 mode. The scattering intensity of both modes becomes comparable for the red laser line. Overall, the blue and green laser lines give stronger Raman intensity than the red one. Thus, detailed temperature dependence was measured using nm.
Before proceeding, we will discuss Raman scattering on electronic excitations. In simple metals light scattering by electrons is hardly observable at low energy because variations of the charge density are screened by itinerant electrons, and electrons will be collectively excited at a plasma frequency of several eV. Devereaux In contrast, correlated electron systems show distinct electronic excitations and collective modes in the optical phonon energy range. For examples, the cuprate and hydrated cobaltate NaxCoOH2O superconductors show similar flat, broad electronic continua in a certain doping range. Peter The studied system exhibits no appreciable electronic excitations at least in the energy range of 40 – 800 cm-1 within the resolution and sensitivity of our spectrometer. The absence of an electronic continuum might suggest that correlation effects are not as strong as the cuprate and cobaltate superconductors. In addition, the phonon modes remain sharp and have a typical Lorentz shape rather than a Fano line shape. This implies that coupling of the phonons to other excitations is small. According to a first principle calculation, Boeri electron-phonon coupling is evenly distributed among all of the phonon branches and the electron-phonon matrix elements are extremely small due to the strongly delocalized character of the Fe- states around the Fermi level, .
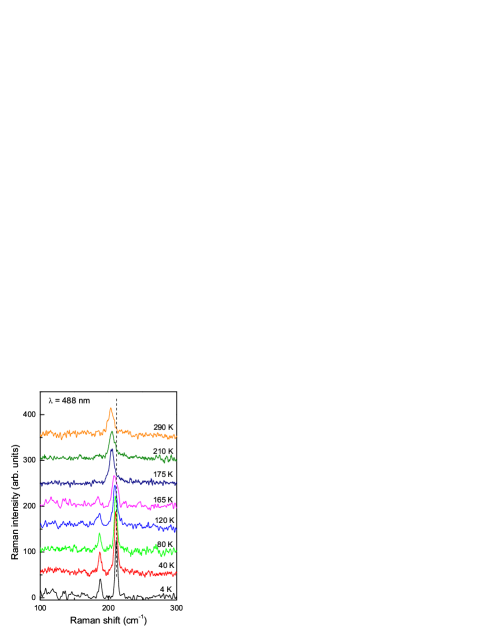
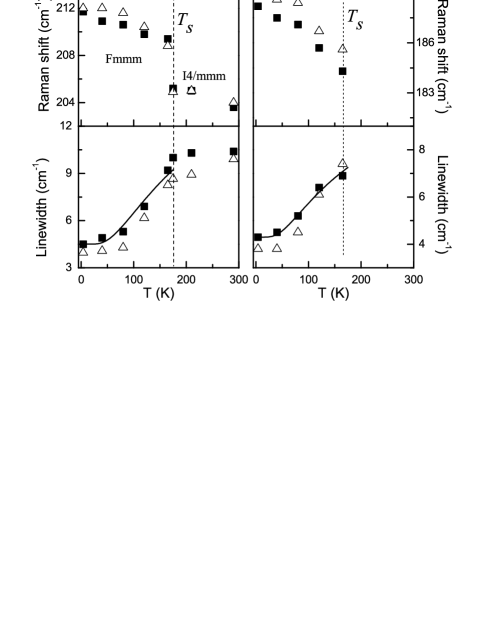
Figure 3 displays the temperature dependence of Raman spectra. With increasing temperature the intensity of the A1g phonon is strongly reduced around while the frequency of the B1g phonon abruptly changes. To obtain detailed information about the peak frequency and linewidth both phonons are fitted by Lorentzian profiles. The results are summarized in Fig. 4. The full square and open triangle symbols stand for the respective blue and green line data. The errors are of the symbol size.
In the temperature region below 173 K the 211 cm-1 B1g and the 189 cm-1 A1g modes soften by about 3 cm-1 with increasing temperature. In the narrow temperature interval around the 211 cm-1 mode shows an abrupt, large jump by 4 cm-1 and then undergoes a tiny softening by 1 cm-1 between and room temperature. Its linewidth () also shows a distinct change at about ; for the 211 cm-1 mode it increases strongly with increasing temperature and saturates above about 173 K. Below 173 K the 189 cm-1 mode also shows a strong broadening but the saturation cannot be identified due to a suppression of the scattering intensity. The discontinuous change of the phonon frequency and linewidth at demonstrates a first-order nature of the structural transition as consistent with other transport, thermodynamic, and magnetic studies. Ni08 ; Goldman
We now discuss possible origins of the observed phonon anomalies. They cannot be ascribed to the change of optical parameters since the intensity of the 211 cm-1 mode is largely temperature-independent (not shown here) although the 189 cm-1 mode is strongly suppressed above TS. Next, we consider the change of interionic distances. The 211 cm-1 phonon frequency jumps by around TS. The phonon frequency relies on a bond length, . Between room temperature and TS the -lattice parameter changes by . Thus, the lattice parameter change cannot fully explain the observed large jump of the phonon frequency. Although in-plane lattice parameters jumps by , it will not directly couple to the B1g mode, which involves the out-of-plane displacements of the Fe ions. Rather, it might be related to the change of a charge distribution in the FeAs planes through TS. This explains well the temperature dependence of the linewidth.
In a phonon-phonon interaction mechanism, the broadening of a phonon mode is given by the decay of the optical phonon into acoustic modes. Since anharmonic effects are described by Boltzmann functions, the temperature dependence of a phonon linewidth does not saturate in contrast to our case. Choi Thus, electron-phonon interactions should be taken into account. In this mechanism, the ratio is given by Axe
where is the electronic density of states at , is the frequency of the specific mode, and is the electron-phonon coupling parameter. As discussed above, the electron-phonon interactions are not strong due to the strong delocalization of the electronic density of state at . However, the structural phase transition can modify the electronic state and accordingly the strength of electron-phonon interactions can vary. Since electron-phonon interactions scale with the temperature dependence of the electronic density of sate , the strong reduction of the linewidth below can be attributed to an opening of a gap due to the SDW instability. We find that an activated function with provides a reasonable description to the temperature dependence of the linewidth (see the solid line of Fig. 4). However, this value should not be taken literally because we cannot separate this effect from the contribution of anharmonicity to the phonon broadening. Here we mention that recent NMR measurements show a jump of an electric field gradient in the direction and an abrupt change of spin-lattice relaxation at TS. This is interpreted in terms of the dramatic change of an on-site charge distribution in the As orbitals. Baek
To summarize, we present Raman scattering measurements of CaFe2As2. The frequency and linewidth of Raman-active phonon modes show a discontinuous change around . This confirms a first order nature of the structural phase transition. Significantly, the large shift of the 211 cm-1 mode by 4 cm-1 at and the strong decrease of the linewidth below give evidence for (i) a strong change of the electronic density of state at and (ii) a sensitivity of the electronic and magnetic change of the FeAs plane to the out-of-plane structure.
Acknowledgements.
This work was supported by DFG and ESF-HFM. One of us (K.Y.C.) acknowledges financial support from the Alexander-von-Humboldt Foundation. Work at the Ames Laboratory was supported by the Department of Energy, Basic Energy Sciences under Contract No. DE-AC02-07CH11358.References
- (1) Y. Kamihara, T. Watanabe, M. Hirano, and H. Hosono, J. Am. Chem. Soc. 130, 3296 (2008).
- (2) H. Takahashi, K. Igawa, K. Arii, Y. Kamihara, M. Hirano, and H. Hosono, Nature 453, 376 (2008).
- (3) X. H. Chen, T. Wu, G. Wu, R. H. Riu, H. Chen, and D. F. Fang, Nature 453, 761 (2008).
- (4) Z. A. Ren, W. Lu, J. Yang, W. Yi, X. Shen, Y. Li, G. Che, X. Dong, L. Sun, F. Zhou and Z.-X. Zhao, Chin. Phys. Lett. 25, 2215 (2008).
- (5) P. M. Grant, Nature 453, 1000 (2008).
- (6) C. de la Cruz, Q. Huang, J. W. Lynn, J. Li, W. Ratcliff ll, J. L. Zarestky, H. A. Mook, G. F. Chen, J. L. Luo, N. L. Wang and Pengcheng Dai, Nature 453, 899 (2008).
- (7) H. Luetkens, H.-H. Klauss, M. Kraken, F. J. Litterst, T. Dellmann R. Klingeler, C. Hess, R. Khasanov, A. Amato, C. Baines, J. Hamann-Borrero, N. Leps, A. Kondrat, G. Behr, J. Werner and B Buechner, arXiv:0806.3533 unpublished.
- (8) M. Rotter, M. Tegel, D. Johrendt, I. Schellenberg, W. Hermes, and R. Pöttgen, Phys. Rev. B 78, 020503(R) (2008).
- (9) N. Ni, S. L. Bud’ko, A. Kreyssig, S. Nandi, G. E. Rustan, A. I. Goldman, S. Gupta, J. D. Corbett, A. Kracher, and P. C. Canfield, Phys. Rev. B 78, 014507 (2008).
- (10) N. Ni, S. Nandi, A. Kreyssig, A. I. Goldman, E. D. Mun, S. L. Bud’ko, and P. C. Canfield, Phys. Rev. B 78, 014523 (2008).
- (11) J.-Q. Yan, A. Kreyssig, S. Nandi, N. Ni, S. L. Bud’ko, A. Kracher, R. J. McQueeney, R. W. McCallum, T. A. Lograsso, A. I. Goldman, and P. C. Canfield, Phys. Rev. B 78, 024516 (2008).
- (12) A. I. Goldman, D. N. Argyriou, B. Ouladdiaf, T. Chatterji, A. Kreyssig, S. Nandi, N. Ni, S. L. Bud’ko, P. C. Canfield, and R. J. McQueeney, Phys. Rev. B 78, 100506(R) (2008).
- (13) S.-H. Baek, N. J. Curro, T. Klimczuk, E. D. Bauer, F. Ronning, and J. D. Thompson, arXiv:0808.0744 unpublished.
- (14) R. J. McQueeney, S. O. Diallo, V. P. Antropov, G. D. Samolyuk, C. Broholm, N. Ni, S. Nandi, M. Yethiraj, J. L. Zarestky, J. J. Pulikkotil, A. Kreyssig, M. D. Lumsden, B. N. Harmon, P. C. Canfield, and A. I. Goldman, arXiv:0809.1410 unpublished.
- (15) V. G. Hadjiev, M. N. Iliev, K. Sasmal, Y.-Y. Sun, and C. W. Chu, Phys. Rev. B 77, 220505(R) (2008).
- (16) A. P. Litvinchuk, V. G. Hadjiev, M. N. Iliev, Bing Lv, A. M. Guloy, and C. W. Chu, arXiv:0807.2284 unpublished.
- (17) T. Yildirim, arXiv:0804.2252 unpublished.
- (18) T. P. Devereaux and R. Hackl, Rev. Mod. Phys. 79, 175 (2007).
- (19) P. Lemmens, K. Y. Choi, V. Gnezdilov, E. Ya. Sherman, D. P. Chen, C. T. Lin, F. C. Chou, and B. Keimer, Phys. Rev. Lett. 96, 167204 (2006).
- (20) L. Boeri, O. V. Dolgov, and A. A. Golubov, Phys. Rev. Lett. 101, 026403 (2008).
- (21) K.-Y. Choi, Yu. G. Pashkevich, K. V. Lamonova, H. Kageyama, Y. Ueda, and P. Lemmens, Phys. Rev. B 68, 104418 (2003).
- (22) J. D. Axe and G. Shirane, Phys. Rev. Lett. 30, 214 (1973).