Density-functional investigation of the rhombohedral to simple cubic phase transition of arsenic
Abstract
We report on our investigation of the crystal structure of arsenic under compression, focusing primarily on the pressure-induced A7 simple cubic (sc) phase transition. The two-atom rhombohedral unit cell is subjected to pressures ranging from 0 GPa to 200 GPa; for each given pressure, cell lengths and angles, as well as atomic positions, are allowed to vary until the fully relaxed structure is obtained. We find that the nearest and next-nearest neighbor distances give the clearest indication of the occurrence of a structural phase transition. Calculations are performed using the local density approximation (LDA) and the PBE and PW91 generalized gradient approximations (GGA-PBE and GGA-PW91) for the exchange-correlation functional. The A7 sc transition is found to occur at 211 GPa in the LDA, at 281 GPa in the GGA-PBE and at 291 GPa in the GGA-PW91; no volume discontinuity is observed across the transition in any of the three cases. We use -point grids as dense as 666666 to enable us to present reliably converged results for the A7 sc transition of arsenic.
pacs:
61.50.Ks, 61.66.Bi, 64.60.Ej, 71.15.NcI Introduction
It is currently de rigueur to examine, both experimentally and theoretically, the structure of materials subjected to extremely high pressures.McMahon and Nelmes (2006) The group–V semi-metals, which include arsenic, are of particular interest as they all exhibit a distinctive low-symmetry structure when uncompressed. With pressure, these elements experience transitions into structures of higher symmetry, with unusual intermediate phases — incommensurate or host-guest structures — occurring along the way.
The computational study of the high-pressure behavior of materials necessitates the ability to properly examine displacive phase transitions from one structure to another. Some structural phase transitions are straight-forward enough that the transition pressure can be determined by looking at where the enthalpy-pressure curves of the two structures cross, or by using the technique of the “common tangent” on the energy-volume curves of the two structures. However, the transition pressure cannot be determined in this way if the enthalpy-pressure (or energy-volume) curves of the two structures merge, as in the case of the A7 sc transition of arsenic (and for the same transition in the other group–V semi-metals). So if the phase transition between the two structures is a smooth one — such that the energy differences between the two structures in the region of the transition are extremely small — then how should such a transition be studied? High levels of convergence of the calculation of the quantities of interest are crucial.
In the past, the A7 sc transition pressure of arsenic has been the subject of experimental as well as theoretical dispute. Experimentally, there has been a long-standing question as to whether results obtained by Beister Beister et al. (1990) for this transition pressure are correct over those of Kikegawa and Iwasaki Kikegawa and Iwasaki (1987) — our results support the findings of the former. Existing theoretical studies of arsenic yield a wide range of possible values for the transition pressure. We believe that a great part of the reason for this spread of values is inadequate -point sampling of the Brillouin zone. The Fermi surface of arsenic is extremely complex: using values reported by Lin and Falicov Lin and Falicov (1966) for the cross-sectional area of a neck (the finest feature of the hole Fermi surface), we estimate that to sample the Fermi surface of arsenic at ambient pressures such that all of the features can be resolved — and are subsequently correctly weighted — a grid of at least 140140140 -points would be required. In practice, it is not necessary to use grids as dense as this but one would not know this without proper and thorough convergence testing with respect to -point grid size and amount of smearing used. As no such convergence testing of the A7 sc transition of arsenic appears in the literature, results of computational studies to date are unreliable and any agreement with experiment has been fortuitous. We undertake indepth studies of the convergence properties of this transition,sil which enable us to proffer reliably converged results.
This investigation is not only timely, given the current levels of interest in the field of high-pressure research, but it is also especially relevant to the study of pressure-induced insulator to metal or semi-metal to metal phase transitions. In particular, we find that inspection of such transitions demands careful convergence of the quantities of interest with respect to -point sampling and smearing, yet such testing is not always performed.
Using density functional theory (DFT) to study the high-pressure properties of materials furthermore necessitates an awareness of how different approximations to the exchange-correlation functional perform at such a task; to understand the differences encountered in the use of these functionals is in itself a motivation for undertaking theoretical investigations of materials at high pressures.Mujica et al. (2003) We thus compare the performance of the LDA with that of two GGA functionals, having achieved accurate results for each.
The paper is organized as follows. Section II contains the background material that pertains to our study, including a description of the A7 phase, a review of the structural transformation that yields the sc phase when a sufficiently high external pressure is applied, and a survey of the relevant findings published prior to this work. Section III deals with the computational details of our calculations. In Sec. IV, we present and discuss our results, contrasting them against those that appear in the literature. We begin by examining, using the nearest and next-nearest neighbor distances, the overall picture of the pressure-dependence of the phases of arsenic for the LDA and the GGA cases; the pressure-dependence of the lattice parameters is also explored. Next we focus on the A7 sc transition in particular, discussing it in more detail using energy-volume and pressure-volume curves. In Sec. V, we provide a brief discussion and conclusion.
II The Structures of Arsenic
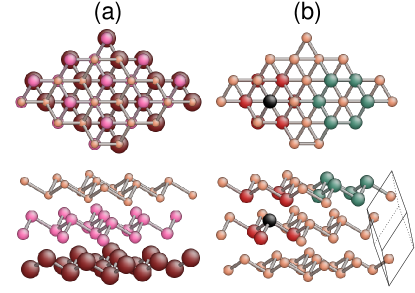
At ambient pressures, arsenic is a covalently bonded compound existing in the rhombohedral (A7) phase. The A7 phase, belonging to space group 166, is a low-symmetry, three-fold coordinated, layered structure (Fig. 1). Nearest neighbors exist within a common layer; bonding between nearest neighbors gives the structure its buckled appearance. Adjacent layers, which contain next-nearest neighbors, are weakly bonded. The stacking of the layers occurs in the [111] direction, as does the buckling.
The rhombohedral primitive cell of arsenic contains two atoms and is described by the length of the primitive lattice vectors, , the angle, , between each set of primitive lattice vectors, and by the atomic positional parameter, , which determines the positions of the two atoms along the cell’s body diagonal. The two atoms are located at (Wyckoff) positions and Wyckoff (1963) along the primitive lattice vectors, where the atomic positional parameter is a fractional coordinate. Together, and characterize the degree of buckling experienced by the A7 structure.
The A7 structure can be interpreted as a distortion of the six-fold coordinated sc structure;Falicov and Golin (1965); Needs et al. (1986); Mattheiss et al. (1986) a diagram charting the evolution of the sc structure into the A7 structure can be found in Ref. Beister et al., 1990. The sc lattice can be viewed as being composed of two interpenetrating face-centered cubic (fcc) lattices. The vertices of a sc cell along the [111] direction contain one atom from each of the fcc lattices. A rhombohedral cell is superimposed onto this in such a way that its origin lies central to, and contains, two of these alternate fcc lattice atoms. Its body diagonal is along the [111] direction (the trigonal axis). Along this direction, the atomic positional parameter can be thought of as the ratio of the distance from the origin to the first atom, divided by the length of the body diagonal. A shear is then applied along the trigonal axis so that the angle between sets of primitive lattice vectors decreases from its simple cubic value of . Finally, the two atoms are displaced from their original positions and away from each other such that decreases from its sc value of 0.25. The periodicity of the atoms in the [111] direction is now doubled; pairs of atoms in this direction repeat a pattern of being further apart and then nearer. In this way, the coordination number is reduced from six to three, as is consistent with the tendency of group–V semi-metals at normal pressures to form three bonds.
Subjected to sufficiently high pressures, arsenic undergoes a transition from semi-metallic A7 to metallic sc. At lower pressures, the stability of the A7 structure against that of the sc structure can be understood in terms of a Peierls-type distortion associated with the displacement of the atoms along the [111] direction from their original positions within the simple cubic lattice. This displacement corresponds to the longitudinal acoustic phonon mode at the point on the boundary of the simple cubic Brillouin zone.Chang and Cohen (1986) The breaking of symmetry causes a lowering of the energy of the electron states near the Fermi level, with the result that a gap is opened up, the band contribution to the total energy is reduced, and the structure is stabilized against the distortion. As the pressure is increased, ionic effects become more significant, and the Ewald contribution to the total energy increases. Changes in the Ewald energy eventually dominate over changes in the band energy, the A7 structure is destabilized such that the Ewald energy is lowered, and the sc structure is recovered.Needs et al. (1986); Chang and Cohen (1986) Within the framework of chemical bonding, at low pressures the nearly orthogonal bonds of the A7 structure indicate weak s-p hybridization, where valence electrons are localized within saturated covalent bonds. The splitting between s and p bands increases with pressure, until the s band is so deeply depressed with respect to the p band that unsaturated orthogonal bonds form, resulting in the metallic sc structure.Mattheiss et al. (1986); Littlewood (1980)
It is sometimes convenient to use the nonprimitive hexagonal (trigonal) representation of the unit cell of arsenic. The trigonal cell is described by the lattice vectors and , the trigonal axis which lies in the [111] direction and coincides with the body diagonal of the rhombohedral primitive cell, and by the same atomic positional parameter . The six atoms contained within the cell are located at Wyckoff positions .Wyckoff (1963) The lattice vector lengths and are related to the length of the primitive lattice vector and angle as follows: , and . Within this representation, can be thought of as locating, as a fraction of , the first atom from the origin along this axis.
From ambient conditions and with increasing pressure, the experimentally observed transition sequence for the phases of arsenic is A7 sc As-III bcc, where bcc is the body-centered cubic phase and As-III is an incommensurate structure. In the literature, the values reported for the pressure at which occurs the first structural transition of arsenic, from semi-metallic rhombohedral to metallic simple cubic, are spread out over a range of approximately 20 GPa. It has been theoretically predicted that arsenic should undergo a structural phase transition at 18 GPa;Schirber and Van Dyke (1971) early numerical studies of arsenic yielded for the transition pressure values of 35 GPa Chang and Cohen (1986) and 19 GPa.Mattheiss et al. (1986) This last result corresponded to (and was indeed found again very recently in a study of the lattice dynamics of arsenic to be the volume ratio at which a transition occurs Shang et al. (2007)), where is the volume of the compressed cell and is the uncompressed equilibrium volume. Investigating the pressure-induced superconductivity of arsenic, the experimental findings of Kawamura and Wittig Kawamura and Wittig (1985) suggest a transition at 24 GPa, while those of Chen, et al. Chen et al. (1992) support a transition pressure of 32 GPa, though they obtain 36 GPa via the theoretical component of their study. Performing energy-dispersive and angle-dispersive powder X-ray diffraction studies of arsenic up to 45 GPa, Kikegawa and Iwasaki Kikegawa and Iwasaki (1987) determined the A7 sc transition to be of first order, occurring somewhere in the interval of 31.4–36.6 GPa and resulting in a cell volume discontinuity of , where is the difference in the cell volume across transition, and is the volume of the cell just prior to the transition. Beister, et al., Beister et al. (1990) conducting an angle-dispersive powder X-ray diffraction study up to 33 GPa in addition to a Raman investigation, concluded that the transition occurs at 25 GPa, and that to within their experimental uncertainty no discernable change in volume is seen to occur: . More recently, theoretical investigations of the A7 sc transition of arsenic yielded for the transition pressure a range of GPa Da Silva and Wentzcovitch (1997) in one study, and 28 GPa Häussermann et al. (2002) in another. A molecular dynamics simulation of the A7 sc transition performed by Durandurdu Durandurdu (2005) yielded a transition pressure of 35 GPa and a volume discontinuity of , and most recently, transition pressures of 22 GPa Feng et al. (2007) and 26.3 GPa Zijlstra et al. (2008) have been found, with volume discontinuities of 0.8% and 0.4% respectively.
Experiments aimed at investigating the higher-pressure phase transitions of arsenic were first carried out by Greene, et al..Greene et al. (1995) Energy-dispersive powder X-ray diffraction experiments on arsenic up to 122 GPa yielded sc As-III and As-III bcc transition pressures of 4811 GPa and 9714 GPa, respectively. To within their experimental error of 1, no measurable volume discontinuities for either phase transition were observed. These results were reproduced rather closely in a theoretical study by Häussermann, et al.,Häussermann et al. (2002) in which the two pressures were found to be 43 GPa and 97 GPa. Reinterpration of diffraction patterns obtained in the experiments of Greene, et al. led Iwasaki Iwasaki (1997) (see also Ref. Iwasaki and Kikegawa, 1997) to suggest a tetragonal Bi-III-type or Sb-II-type structure, regarded as distorted bcc, for the As-III phase. More recently McMahon, et al.,McMahon et al. (2000) using angle-dispersive X-ray diffraction techniques, determined both the Bi-III and Sb-II phases to be Ba-IV-type structures, consisting of a body-centered tetragonal (bct) host structure containing a bct guest component that is incommensurate with the host along the tetragonal axis. They suggested that a modification of this structure in which the host component is bct and the guest is monoclinic would be appropriate for As-III. Degtyareva, et al. Degtyareva et al. (2004) later found that the As-III structure closely resembles that of Sb-IV, and proposed that it is possible that arsenic may undergo an incommensurate-to-incommensurate transition between the As-III and bcc phases similar to the Sb-IV Sb-II transition observed in their study.
III Computational Details
All calculations were performed using the CASTEP code.Clark et al. (2005) For the exchange-correlation functional, we use the local density approximation (LDA) Ceperley and Alder (1980) as parametrized by Perdew and Zunger, Perdew and Zunger (1981) the Perdew-Burke-Ernzerhof generalized gradient approximation (abbreviated as GGA-PBE)Perdew et al. (1996) and the Perdew-Wang generalized gradient approximation (GGA-PW91).Perdew and Wang (1992)
The interaction between the core and valence states of arsenic is described using scalar-relativistic ultra-soft pseudopotentials.Vanderbilt (1990) For the calculations to proceed efficiently, such pseudopotentials require the use of two FFT-grids: a standard grid, which is used to represent the pseudo wave-functions, and a fine grid, which is used to store the charge density, and thus the ultra-soft augmentation charge. The size of the standard grid is determined by the cut-off energy — the maximum energy accounted for in the plane-wave expansion of the wave-functions; the fine grid must be chosen dense enough such that the charge-density within the atomic cores is reproduced with sufficient detail — this is a requirement to ensure well-converged forces and stresses. Convergence tests on our system at atmospheric pressure led us to choose a cut-off energy of 450 eV; we chose our fine grid to be twice as dense as our standard grid. With these choices, our energies, forces and stresses are converged to within 0.003 eV/atom, 0.001 eV/Å and 0.01 GPa, respectively.
We apply pressures between 0 GPa and 200 GPa to the two-atom rhombohedral unit cell of arsenic, allowing cell lengths and angles in addition to atomic positions to vary. For each applied pressure, the enthalpy is minimized such that the system is relaxed from the structure that exists at atmospheric pressure as determined experimentally by Schiferl.Schiferl and Barrett (1969) The geometry optimizations are made to continue until the differences in the forces and stresses between iterations are less than 0.005 eV/Å and 0.05 GPa, respectively. Proper convergence studies in electronic structure calculations are important and the lack of such testing can lead to severe inaccuracies.Mehl (2000) Accordingly, we have thoroughly investigated the structural convergence of our system in the region of the A7 sc phase transition; we have examined the convergence with respect to -point grid size and amount of cold-smearing Marzari et al. (1999) used — the results of this convergence testing can be found in the supplementary material provided.sil In the vicinity of the A7 sc transition, the -point grids that have been studied are , where is 24, 25, 26, 33, 50 and 66 (all -point grids are unshifted, so that the gamma point has been included in the calculations), using cold-smearings of 0.1, 0.2 and 0.5 eV in the LDA and 0.1 eV in the GGA-PBE. At pressures outside the region of this phase transition (and for all pressures studied in the case of the GGA-PW91), a -point grid of 333333 is used, along with a cold-smearing of 0.1 eV. The symmetry of the initial A7 structure is maintained throughout the relaxation, as a highly symmetric path is assumed for the A7 sc transition, with atoms moving only along the [111] direction. Although it is irrelevant whether this assumption is valid for the As-III phase, because no attempt has been made here to properly model this incommensurate structure, it seems reasonable that imposing these constraints on the symmetry of the system will not affect the transition pressures observed since the incommensurate phase is bounded by two phases of higher symmetry than the original A7 structure.
Finally, all calculations are performed at K, and the zero-point vibrational energy, as well as the spin-orbit interaction, are neglected.
IV Results and Discussion
IV.1 Overview of the transitions of arsenic
We first take an overview of the behavior of the nearest and next-nearest neighbor distances as the pressure is increased from 0 GPa to 200 GPa. It has already been stated that for the A7 sc phase transition in particular, the behavior of these two quantities gives the clearest indication of when a structural phase transition has occurred. Fig. 2 reveals the results we obtained for each of the exchange-correlation functionals studied, and includes separate close-ups of the A7 sc phase transition for the LDA and for the GGA. Indeed, it is quite clear when this transition occurs in all cases, as it happens when the nearest and next-nearest neighbor distances become equal. From the insets of Fig. 2, we can conclude that the A7 sc phase transition of arsenic occurs at 211 GPa in the LDA, at 281 GPa in the GGA-PBE and at 291 GPa in the GGA-PW91 (note that the difference in the transition pressure that arises from the use of the GGA-PW91 over the GGA-PBE is negligible as it is within the uncertainty of 1 GPa). This result is more consistent with the experimental findings of Beister, et al.,Beister et al. (1990) who found the phase transition to occur at 251 GPa, than it is with those of Kikegawa and Iwasaki,Kikegawa and Iwasaki (1987) who found it to occur in the range of 31.4–36.6 GPa; it furthermore disagrees with the outcome of simulations performed recently by Durandurdu.Durandurdu (2005)
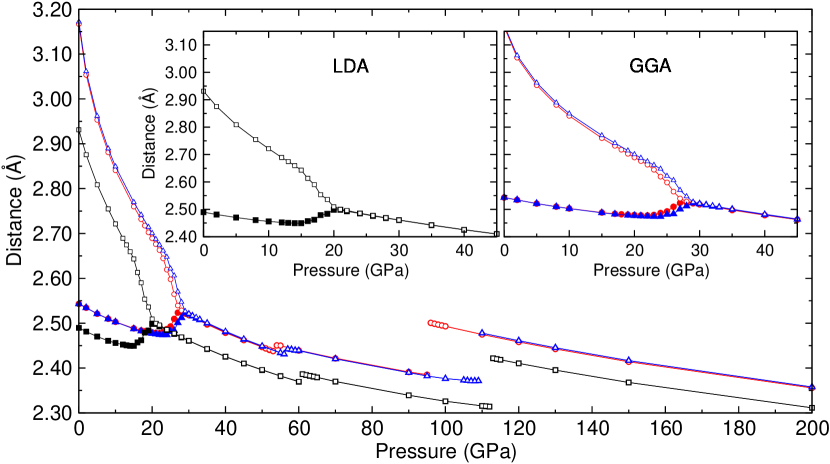
From this same figure we note incidentally that the GGA nearest and next-nearest neighbor distances are always larger than those resulting from the LDA. This is due to the well-known fact that the LDA tends to overbind systems, whereas the GGA tends to underbind them.Seifert et al. (1995) Thus cell volumes, cell parameters, and distances contained within the cell will tend to be lower for the LDA than for the GGA.
Our unit cell contains two atoms and is periodically repeated. We cannot hope to say anything about the incommensurate phase that occurs in the pressure-induced progression of phases of arsenic, and it is not our intention to do so in this paper; to acknowledge this point, we will use the abbreviation incomm. to represent what we find between the sc and bcc phases, and subsequently write the progression of phases as A7 sc incomm. bcc. We mention as an aside that we have chosen to work with the two-atom unit cell of arsenic in the interest of undertaking efficient calculations, but as we are guided by experiment and not primarily focused in this study on the incommensurate structure, a two-atom unit cell is sufficient for our needs. It is possible that were we to use unit cells containing arbitrary numbers of atoms we might discover other more complex or more closely-packed structures of arsenic at pressures higher than have yet been attained experimentally — this is an interesting point and although outside the scope of this work, would be an excellent candidate for the application of fully randomized structure prediction.Pickard and Needs (2006)
Having stated that we do not expect to reproduce the incommensurate phase of arsenic, we can still use our system to approximate the pressure at which the system ceases to be sc, as well as to approximate the pressure at which it becomes bcc, and compare with the most recent experimental findings. Thus, referring again to Fig. 2, we see that in the LDA the sc incomm. phase transition appears to occur at 60–61 GPa and the incomm. bcc at 112–113 GPa. In the GGA-PBE it is 53–54 GPa and 95–96 GPa, and in the GGA-PW91 it is 56–57 GPa and 109–110 GPa. Although our findings for the sc incomm. transition are about 10 GPa higher than those of Ref. Häussermann et al., 2002, and fall into the high-end of the range of values given in Ref. Greene et al., 1995, our results for the incomm. bcc transition agree closely with those from both works. Along with the findings that are present in the literature, our results for the transition pressures of arsenic are summarized in Table 1.
| Theory: | |||
| This work, LDA | |||
| This work, PBE | |||
| This work, PW91 | |||
| Ref. Chang and Cohen, 1986 (PP, LDA) | 35 | 0.72 | |
| Ref. Mattheiss et al., 1986 (LAPW, LDA) | 19 | 0.8 | |
| Ref. Chen et al., 1992 (PP, LDA) | 36 | ||
| Ref. Da Silva and Wentzcovitch, 1997 (PP, LDA) | 0.78 | 1 | |
| Ref. Häussermann et al., 2002 (PP, PW91) | 28 | 0.8 | |
| Ref. Durandurdu, 2005 (PP, LDA) | 35 | 3.2 | |
| Ref. Feng et al., 2007 (PP, PBE) | 22 | 0.8 | |
| Ref. Shang et al., 2007 (PP, PW91) | 0.8 | ||
| Ref. Zijlstra et al., 2008 (LAPW, PBE) | 26.3 | 0.4 | |
| Experiment: | |||
| Ref. Schirber and Van Dyke,1971 | 18 | ||
| Ref. Kawamura and Wittig,1985 | 24 | ||
| Ref. Kikegawa and Iwasaki,1987 | 31.4 – 36.6 | 0.744 | 5 |
| Ref. Beister et al.,1990 | 0.772 | 0.5 | |
| Ref. Chen et al.,1992 | 32 |
We break down the nearest and next-nearest neighbor distances into their constituent components in Fig. 3, which illustrates the behavior of the lattice parameter (top tier), the cell angle (middle tier), and the atomic positional parameter (bottom tier), for the LDA and the GGA-PBE. Each tier of Fig. 3 is composed of a close-up of the A7 sc phase transition (on the left) along with the behavior of the quantity over the entire range of pressures studied (on the right). Respectively, the high symmetry values of and , as can be confirmed in this figure, are 60∘ and 0.25 in the simple cubic case, and 90∘ and 0.25 in the bcc case. The sc phase is of higher symmetry than the A7 phase, and because we have constrained the symmetry of the system, once the sc phase has been reached the atomic positional parameter remains equal to 0.25. Thus, after the A7 sc phase transition has occurred, it is the angle that determines the phase of the structure as the applied pressure is increased.
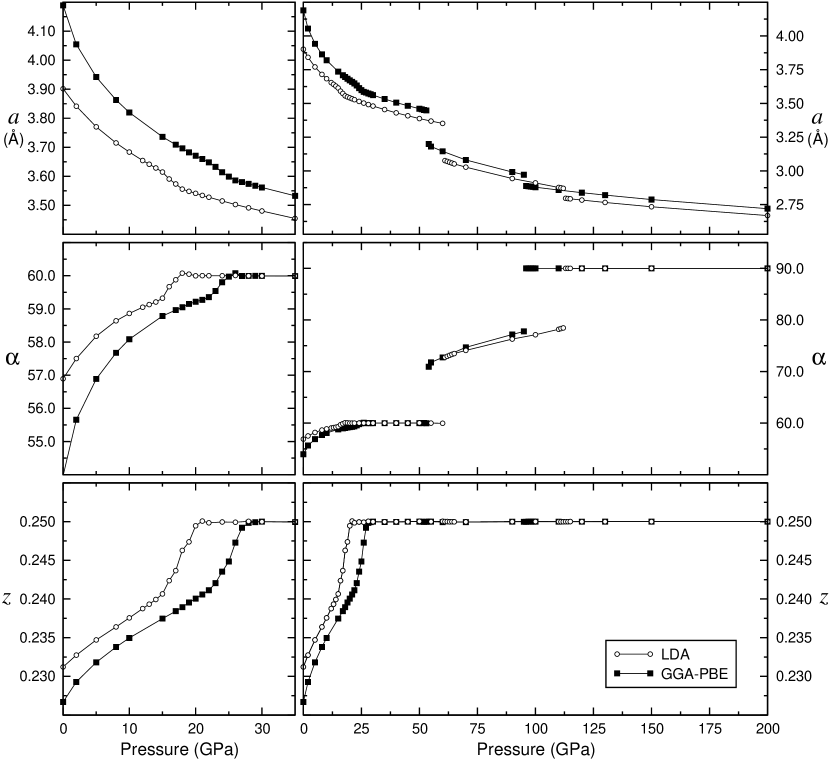
The first point to observe upon inspection of Fig. 3 is that the A7 sc transition appears to be continuous with respect to all three quantities: (top), (middle) and (bottom). We see from the set of right hand panels in the figure that the sc incomm. and the incomm. bcc transitions appear to be discontinuous with respect to lattice parameter and cell angle , for both the LDA and the GGA; in particular, these discontinuities subsequently manifest themselves in the nearest and next-nearest neighbor distances at these two transitions as can be seen in Fig. 2, and indicate when the cell angle has jumped away from 60∘ in the case of the former transition, and to 90∘ in the case of the latter. Before discussing the behavior with pressure of the cell parameters further, we first inspect more closely the A7 sc transition.
IV.2 The A7 sc transition of arsenic
Examining the left hand panels of Fig. 3, we see that and reach their high-symmetry values at lower pressures in the case of the LDA than in the GGA; this is to be expected as we noted earlier that the LDA A7 sc transition pressure is lower than the GGA transition pressure. However, we also note that in both cases, reaches 60∘ at a slightly lower pressure than reaches 0.25. This result was also found by Seifert, et al.Seifert et al. (1995) in their study of the A7 sc transition of antimony. In fact, there is no reason to assume that and must reach their high-symmetry values at the same pressure — yet we cannot rule out the possibility that this pressure discrepancy may be an artifact resulting from the use of smearing in our calculations. The difference in pressures between which and reach their high-symmetry values is slightly more pronounced for the LDA (approximately 3 GPa) than it is for the GGA (approximately 2 GPa for both the GGA-PBE and the GGA-PW91). The curves of the lattice parameter and the cell angle seemingly progress together. Thus the cell reaches its high-symmetry shape “before” the transition to sc takes place; since both and must reach their high-symmetry values for the transition to occur, the A7 sc transition pressure is consequently determined by the atomic positional parameter . Thus we see that reaches 0.25 at approximately 21 GPa in the LDA and at approximately 28 GPa in the GGA-PBE.
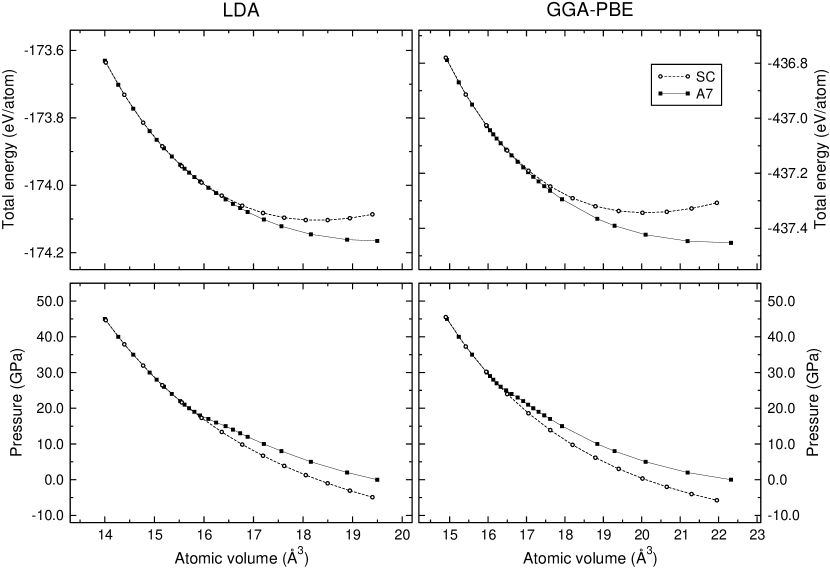
We consider next, for the LDA and the GGA-PBE, the energy-volume and pressure-volume curves of the A7 and sc structures over a pressure range of approximately 0–45 GPa, which includes only the A7 sc phase transition (Fig. 4). In all cases, the A7 and sc curves merge once the A7 sc phase transition has occurred, in other words, once the volume of the cell has been compressed beyond a particular value. This contradicts the recent results of Durandurdu.Durandurdu (2005) However, the sc A7 transformation is the result of two continuous distortions, so we would expect this transition also to be smooth and continuous. We do not expect to see metastable states, and we observe none — this agrees with the experimental findings both of Beister, et al.,Beister et al. (1990) and of Kikegawa and Iwasaki,Kikegawa and Iwasaki (1987) yet it disagrees with the theoretical findings of Da Silva, et al.Da Silva and Wentzcovitch (1997) We observe no discontinuities in these curves and so our results suggest that the A7 sc phase transition is of second order. Experimentally, both Beister, et al.Beister et al. (1990) and Kikegawa and Iwasaki Kikegawa and Iwasaki (1987) report that the A7 sc transition is of first order, where to within an experimental error of 0.5% no volume discontinuity is detected in the former study, whereas a volume discontinuity of 5% across the transition is found in the latter study. Da Silva, et al.Da Silva and Wentzcovitch (1997) report a transition that is weakly first order, and a volume discontinuity of less than 1%. We believe that if this transition appeared in the past to be of first order it was because of the coarse grained nature of the investigations performed at the time.
On the matter of the discrepancies that exist between our study and, for example, those of Durandurdu Durandurdu (2005) and Da Silva, et al.,Da Silva and Wentzcovitch (1997) it is clear that in those investigations the -point sampling of the Brillouin zone was insufficient: the most dense grid employed by Da Silva, et. al.Da Silva and Wentzcovitch (1997) in their study of arsenic was 131313 — Durandurdu Durandurdu (2005) uses only the gamma point for a unit cell containing 250 atoms, roughly corresponding to using a 555 -point grid for for a two-atom unit cell. Our investigations reveal that these calculations could not have been converged. Moreover, in addition to ensuring that the Brillouin zone is properly sampled, we believe that choosing an appropriate amount of smearing is also very important (once again consult the supplementary material for an indepth study of the convergence properties with respect to -point sampling and smearing of the A7 sc transition of arsenic).sil
Another point to be made about the insets of Fig. 2, is that at pressures just below the A7 sc transition, the nearest neighbor distance actually increases with pressure. This occurs over the range of approximately 15–20 GPa in the LDA and approximately 22–27 GPa in the GGA-PBE. The onset of this feature coincides with the point at which the , and versus pressure curves all begin to experience a kink or slight change of direction (see left-hand panels of Fig. 3). These pressure intervals also correspond to the regions where the A7 pressure-volume curves of Fig. 4 start dipping down (from right to left) toward those of the simple cubic phase. As the volume does not increase discontinuously across the transition, there must be significant atomic restructuring going on for the nearest neighbor distance to increase as the transition is approached. Although their nearest and next-nearest neighbor distances were estimates calculated according to an empirical relation for the atomic positional parameter, Beister, et al. Beister et al. (1990) noticed this point as well and noted that such behavior is not unexpected, as there is a tendency in covalently bonded solids to display increased nearest neighbor distances when undergoing pressure-induced breaking of directional bonds, accompanied by increased coordination numbers.
We have performed fits of the energy-volume curves using both the third-order Birch-Murnaghan Birch (1947) and Vinet Vinet et al. (1987) equations to yield values for the bulk modulus, , pressure derivative of the bulk modulus, , and equilibrium volume, , of arsenic for both the A7 and sc structures. We find that for the A7 phase, the values we obtain for and are extremely sensitive to the number of points included in the fit; this was also found to be the case for Needs, et al.Needs et al. (1986) It is also somewhat the case for the sc portion of the A7 curve, so we have quoted the values that we obtain when we fit curves resulting from compressions of the exact sc structure, rather than from geometry optimizations. Table 2 summarizes our findings, including the results we obtained for the equilibrium cell parameters from our geometry optimizations of arsenic at zero pressure, and compares them to those published in previous studies.
| A7 structure | (Å) | ) | (Å3) | (GPa) | ||
|---|---|---|---|---|---|---|
| Theory: | ||||||
| This work, LDA | 3.902 | 56.89 | 0.231 | , | ||
| This work, PBE | 4.189 | 53.96 | 0.227 | , | ||
| This work, PW91 | 4.195 | 53.90 | 0.227 | , | ||
| Ref. Needs et al., 1986 (PP, LDA) | 4.017 | 56.28 | 0.230 | 20.95 | 43 | |
| Ref. Needs et al., 1987 (PP, LDA) | 0.24 | |||||
| Ref. Mattheiss et al., 1986 (LAPW, LDA) | 4.084 | 55.9 | 0.2294 | 21.8 | 77 | |
| Ref. Seifert et al., 1995 (PP, LDA) | 4.0027 | 56.24 | 0.230 | 20.70 | 52 | |
| (PP, PB) | 4.32035 | 52.44 | 0.225 | 23.45 | 36 | |
| (PP, PW86) | 4.57449 | 52.01 | 0.224 | 27.49 | ||
| Ref. Da Silva and Wentzcovitch, 1997 (PP, LDA) | 4.031 | 56.3 | 0.230 | 21.18 | 59(1) | 4.2(3) |
| Ref. Durandurdu, 2005 (PP, LDA) | 23.57 | 64.49 | 3.99 | |||
| Ref. Feng et al., 2007 (PP, PBE) | 4.182 | 53.13 | 0.225 | 21.70 | 38.4 | 4.34 |
| Ref. Zijlstra et al., 2008 (LAPW, PBE) | 4.246 | 53.31 | 0.226 | 22.82 | ||
| Experiment: | ||||||
| Ref. Schiferl and Barrett,1969 | 4.1018(1) | 55.554(1) | 0.22764(4) | 21.303 | ||
| Ref. Morosin and Schirber,1972 | 0.22728(7) | |||||
| Ref. Kikegawa and Iwasaki,1987 | 4.133 | 54.12 | 0.227 | 21.53 | 55.6 | 4.4 |
| Ref. Beister et al.,1990 | 54.13 | 58(4) | 3.3(4) | |||
| Ref. Greene et al.,1995 | 56(3) | 3.7(2) |
| Simple cubic structure | (Å) | (Å3) | (GPa) | |
|---|---|---|---|---|
| Theory: | ||||
| This work, LDA | 2.635 | , | , | |
| This work, PBE | 2.719 | , | , | |
| This work, PW91 | 2.722 | , | , | |
| Ref. Needs et al., 1986 (PP, LDA) | 2.687 | 19.4 | 104 | 4.4 |
| Ref. Needs et al., 1987 (PP, LDA) | 2.68 | 19.25 | 122 | 2.32 |
| Ref. Mattheiss et al., 1986 (LAPW, LDA) | 2.717 | 20.06 | 87 | |
| Ref. Da Silva and Wentzcovitch, 1997 (PP, LDA) | 2.704 | 19.77 | 92(3) | 4.2(3) |
| Ref. Durandurdu, 2005 (PP, LDA) | 2.822 | 22.47 | 74.15 | 3.2 |
| Ref. Feng et al., 2007 (PP, PBE) | 2.674 | 19.12 | 88.2 | 3.93 |
| Ref. Zijlstra et al., 2008 (LAPW, PBE) | 2.731 | 20.37 | 78.107 | 4.317 |
V Conclusions
We have performed simulations of the two-atom unit cell of arsenic under compression to investigate its high-pressure behavior and compare with experiment. In the matter of the A7 sc transition, our results strongly support the experimental findings of Beister Beister et al. (1990) over those of Kikegawa and Iwasaki; Kikegawa and Iwasaki (1987) we furthermore find this transition to be of second order.
Our main critique of the current literature is that we believe that any results published until now concerning this semi-metal to metal phase transition are unconverged (as no thorough convergence studies have ever been published), and that any agreement with experiment has merely been fortuitous. This study has enabled us to present reliably converged results for the A7 sc transition of arsenic.
Using DFT to study any pressure-induced structural phase transition involving a metal demands convergence testing similar to that which we have carried out; sil for such purposes, -point sampling and smearing must be considered thoroughly.
VI Acknowledgments
We thank Richard Needs for helpful discussions. Computing resources were provided by the Cambridge High Performance Computing Service (HPCS).
References
- McMahon and Nelmes (2006) M. I. McMahon and R. J. Nelmes, Chem. Soc. Rev. 35, 943 (2006).
- Beister et al. (1990) H. J. Beister, K. Strössner, and K. Syassen, Phys. Rev. B 41, 5535 (1990).
- Kikegawa and Iwasaki (1987) T. Kikegawa and H. Iwasaki, J. Phys. Soc. Jpn. 56, 3417 (1987).
- Lin and Falicov (1966) P. J. Lin and L. M. Falicov, Phys. Rev. 142, 441 (1966).
- (5) See EPAPS Document No. […] for the convergence properties of the A7 sc phase transition. For more information on EPAPS, see http://www.aip.org/pubservs/epaps.html.
- Mujica et al. (2003) A. Mujica, A. Rubio, A. Muñoz, and R. J. Needs, Rev. Mod. Phys. 75, 863 (2003).
- Li (2003) J. Li, Modelling Simul. Mater. Sci. Eng. 11, 173 (2003).
- Wyckoff (1963) R. W. G. Wyckoff, Crystal Structures, vol. 1 (John Wiley & Sons, Inc., New York, 1963), 2nd ed.
- Falicov and Golin (1965) L. M. Falicov and S. Golin, Phys. Rev. 137, A871 (1965).
- Needs et al. (1986) R. J. Needs, R. M. Martin, and O. H. Nielsen, Phys. Rev. B 33, 3778 (1986).
- Mattheiss et al. (1986) L. F. Mattheiss, D. R. Hamann, and W. Weber, Phys. Rev. B 34, 2190 (1986).
- Chang and Cohen (1986) K. J. Chang and M. L. Cohen, Phys. Rev. B 33, 7371 (1986).
- Littlewood (1980) P. B. Littlewood, J. Phys. C 13, 4855 (1980).
- Schirber and Van Dyke (1971) J. E. Schirber and J. P. Van Dyke, Phys. Rev. Lett. 26, 246 (1971).
- Shang et al. (2007) S. Shang, Y. Wang, H. Zhang, and Z.-K. Liu, Phys. Rev. B 76, 052301 (2007).
- Kawamura and Wittig (1985) H. Kawamura and J. Wittig, Physica B 135, 239 (1985).
- Chen et al. (1992) A. L. Chen, S. P. Lewis, Z. Su, P. Y. Yu, and M. L. Cohen, Phys. Rev. B 46, 5523 (1992).
- Da Silva and Wentzcovitch (1997) C. R. S. Da Silva and R. M. Wentzcovitch, Comput. Mater. Sci. 8, 219 (1997).
- Häussermann et al. (2002) U. Häussermann, K. Söderberg, and R. Norrestam, J. Am. Chem. Soc. 124, 15359 (2002).
- Durandurdu (2005) M. Durandurdu, Phys. Rev. B 72, 073208 (2005).
- Feng et al. (2007) W. Feng, S. Cui, H. Hu, and H. Liu, Physica B 400, 22 (2007).
- Zijlstra et al. (2008) E. S. Zijlstra, N. Huntemann, and M. E. Garcia, New J. Phys. 10, 033010 (2008).
- Greene et al. (1995) R. G. Greene, H. Luo, and A. L. Ruoff, Phys. Rev. B 51, 597 (1995).
- Iwasaki (1997) H. Iwasaki, Phys. Rev. B 55, 14645 (1997).
- Iwasaki and Kikegawa (1997) H. Iwasaki and T. Kikegawa, Acta Crystallogr. Sect. B 53, 353 (1997).
- McMahon et al. (2000) M. I. McMahon, O. Degtyareva, and R. J. Nelmes, Phys. Rev. Lett. 85, 4896 (2000).
- Degtyareva et al. (2004) O. Degtyareva, M. I. McMahon, and R. J. Nelmes, Phys. Rev. B 70, 184119 (2004).
- Clark et al. (2005) S. J. Clark, M. D. Segall, C. J. Pickard, P. J. Hasnip, M. J. Probert, K. Refson, and M. C. Payne, Z. Kristallogr. 220, 567 (2005).
- Ceperley and Alder (1980) D. M. Ceperley and B. J. Alder, Phys. Rev. Lett. 45, 566 (1980).
- Perdew and Zunger (1981) J. P. Perdew and A. Zunger, Phys. Rev. B 23, 5048 (1981).
- Perdew et al. (1996) J. P. Perdew, K. Burke, and M. Ernzerhof, Phys. Rev. Lett. 77, 3865 (1996).
- Perdew and Wang (1992) J. P. Perdew and Y. Wang, Phys. Rev. B 45, 13244 (1992).
- Vanderbilt (1990) D. Vanderbilt, Phys. Rev. B 41, 7892 (1990).
- Schiferl and Barrett (1969) D. Schiferl and C. S. Barrett, J. Appl. Crystallogr. 2, 30 (1969).
- Mehl (2000) M. J. Mehl, Phys. Rev. B 61, 1654 (2000).
- Marzari et al. (1999) N. Marzari, D. Vanderbilt, A. De Vita, and M. C. Payne, Phys. Rev. Lett. 82, 3296 (1999).
- Seifert et al. (1995) K. Seifert, J. Hafner, J. Furthmüller, and G. Kresse, J. Phys.: Condens. Matter 7, 3683 (1995).
- Pickard and Needs (2006) C. J. Pickard and R. J. Needs, Phys. Rev. Lett. 97, 045504 (2006).
- Birch (1947) F. Birch, Phys. Rev. 71, 809 (1947).
- Vinet et al. (1987) P. Vinet, J. R. Smith, J. Ferrante, and J. H. Rose, Phys. Rev. B 35, 1945 (1987).
- Perdew and Wang (1986) J. P. Perdew and Y. Wang, Phys. Rev. B 33, 8800 (1986).
- Perdew (1986) J. P. Perdew, Phys. Rev. B 33, 8822 (1986).
- Becke (1988) A. D. Becke, Phys. Rev. A 38, 3098 (1988).
- Needs et al. (1987) R. J. Needs, R. M. Martin, and O. H. Nielsen, Phys. Rev. B 35, 9851 (1987).
- Morosin and Schirber (1972) B. Morosin and J. E. Schirber, Solid State Commun. 10, 249 (1972).