2 CIFS–Torino, Viale Settimio Severo 3, I-10133 Torino, Italy
3 Dip. di Fisica, Univ. di Roma “Tor Vergata”, Via della Ricerca Scientifica 1, I-00133 Roma, Italy
4 INAF, OATo, Via Osservatorio 20, I-10025 Pino Torinese (Torino), Italy
5 Dip. di Fisica and INFN Trieste, Via Valerio 2, I-34127 Trieste, Italy
6 INFN–Pavia, Via Bassi 6, I-27100 Pavia, Italy
7 Dip. di Fisica Nucleare e Teorica, Univ. di Pavia, Via Bassi 6, I-27100 Pavia, Italy
8 INAF/IASF–Bologna, Via Gobetti 101, I-40129 Bologna, Italy
9 INAF/IASF–Milano, Via E. Bassini 15, I-20133 Milano, Italy
10 ENEA–Bologna, Via dei Martiri di Monte Sole 4, I-40129 Bologna, Italy
11 INFN–Roma “La Sapienza”, Piazzale A. Moro 2, I-00185 Roma, Italy
12 INFN–Roma “Tor Vergata”, Via della Ricerca Scientifica 1, I-00133 Roma, Italy
13 Dip. di Fisica, Univ. dell’Insubria, Via Valleggio 11, I-22100 Como, Italy
14 ENEA–Roma, Via E. Fermi 45, I-00044 Frascati (Roma), Italy
15 ASI–ASDC, Via G. Galilei, I-00044 Frascati (Roma), Italy
16 ASI, Viale Liegi 26, I-00198 Roma, Italy
17 Department of Astronomy, University of Michigan, U. S.
18 Armenzano, Astronomical Observatory, I-06083 Assisi (Perugia), Italy
19 Astron. Inst., St-Petersburg State University, Russia
20 Circolo AStrofili Talmassons, Via Cadorna 57, I-33030 Talmassons (Udine), Italy
AGILE detection of intense gamma-ray emission from the blazar PKS 1510-089
Abstract
Context. We report the detection by the AGILE (Astro-rivelatore Gamma a Immagini LEggero) satellite of an intense gamma-ray flare from the source AGL J1511-0909, associated with the powerful quasar PKS 1510-089, during ten days of observations from 23 August to 1 September 2007.
Aims. During the observation period, the source was in optical decrease following a flaring event monitored by the GLAST-AGILE Support Program (GASP) of the Whole Earth Blazar Telescope (WEBT). The simultaneous gamma-ray, optical, and radio coverage allows us to study the spectral energy distribution and the theoretical models based on the synchrotron and inverse Compton (IC) emission mechanisms.
Methods. AGILE observed the source with its two co-aligned imagers, the Gamma-Ray Imaging Detector and the hard X-ray imager Super-AGILE sensitive in the 30 MeV 50 GeV and 18 60 keV bands, respectively.
Results. Between 23 and 27 August 2007, AGILE detected gamma-ray emission from PKS 1510-089 when this source was located off-axis, with an average flux of photons cm-2 s-1 for photon energy above 100 MeV. In the following period, 28 August - 1 September, after a satellite re-pointing, AGILE detected the source at off-axis, with an average flux (E 100 MeV) of photons cm-2 s-1. No emission was detected by Super-AGILE, with a 3- upper limit of 45 mCrab in 200 ksec.
Conclusions. The spectral energy distribution is modelled with a homogeneous one-zone synchrotron self Compton (SSC) emission plus contributions by external photons: the SSC emission contributes primarily to the X-ray band, whereas the contribution of the IC from the external disc and the broad line region match the hard gamma-ray spectrum observed.
Key Words.:
gamma-rays: observations – mechanism: non-thermal – quasars: individual (PKS 1510-089)1 Introduction
The radio source PKS 1510-089 was first identified optically as a quasar with an ultraviolet excess, a visual magnitude of 16.5 (Bolton Ekers 1966), and a redshift of z = 0.361 measured from its emission-line spectrum (Burbidge Kinnan 1966). PKS 1510-089 is a radio-loud highly polarized quasar (HPQ) belonging to the class of the flat spectrum radio quasar (FSRQ) in terms of its spectral energy distribution. Its radiative output is dominated by the gamma-ray component, while its synchrotron emission peaks around IR frequencies below a pronunced UV bump, presumably due to the thermal emission from the accretion disc (Malkan Moore 1986, Pian Treves 1993).
PKS 1510-089 has been extensively observed in X-rays by (Singh, Rao Vahia 1990, Sambruna et al. 1994), (Lawson Turner 1997), (Siebert et al. 1998), (Singh, Shrader George 1997) and (Gambill et al. 2003). The observed X-ray spectrum was very flat in the 2 10 keV band (photon index 1.3), but steepened in the bandpass below 2 keV ( 1.9). Observations by (Tavecchio et al. 2000) confirm the presence of a soft X-ray excess below 1 keV. A similar soft excess has been detected in other blazars such as 3C273, 3C279, and 3C454.3, and the origin of the soft X-ray excess is still an open issue.
PKS 1510 was recently observed by in August 2006 over approximately three days, and the campaign continued with Swift monitoring over 18 days (Kataoka et al. 2007). Swift-XRT observations reveal significant spectral evolution of the X-ray emission on timescales of one week: the X-ray spectrum becomes harder as the source gets brighter.
Gamma-ray emission from PKS 1510-089 was detected by the EGRET instrument on board with a integrated flux above 100 MeV between (13 5) and (49 18) 10-8 photons cm-2 s-1 and an energy spectrum modelled with a power law with a photon index 2.47 0.21. In this Letter we present the analysis of the AGILE data obtained during the PKS 1510-089 observations from 23 August 2007 to 1 September 2007.
2 AGILE observation of PKS 1510-089
The AGILE scientific Instrument (Tavani et al. 2008) is very compact and combines four active detectors yielding broad-band coverage from hard X-rays to gamma rays.
The Gamma-Ray Imaging Detector (GRID) consists of a combination of a silicon tracker (Prest et al. 2003, Barbiellini et al. 2001), a non-imaging Cesium Iodide Mini-Calorimeter (MCAL; Labanti et al. 2006) positioned under the silicon tracker and sensitive in the 0.3 100 MeV energy band, and a segmented anticoincidence system (ACS) made of a plastic shield which surrounds all active detectors (Perotti et al. 2006). A co-aligned coded-mask hard X-ray imager (SuperAGILE; Costa et al. 2001, Feroci et al. 2007) ensures coverage in the 18 60 keV energy band.
The GRID has a field of view of 2.5 sr, an angular resolution of 1.2∘ at 400 MeV (68 cont. radius), an effective area of 500 cm2 above 100 MeV, and an energy resolution EE 1 at 400 MeV. The silicon tracker and the on-board trigger logic are optimized for gamma-ray imaging in the 30 MeV 50 GeV energy band (Argan et al. 2004).
The AGILE observations of the PKS 1510-089 were performed from 23 August 2007 12:00 UT to 1 September 2007 12:00 UT, for a total of 84 hours of effective exposure time. In the first period, between 23 and 27 August, the source was located off the AGILE pointing direction. In the second period, between 28 August and 1 September, after a satellite re-pointing, the source was located at off-axis.
3 Data reduction and analysis
Level–1 AGILE-GRID data were analysed using the AGILE Standard Analysis Pipeline. The first step is to align all data times to terrestrial time (TT), and it performs preliminary calculations. In the second step, an ad-hoc implementation of the Kalman Filter technique is used for track identification and event-direction reconstruction in detector coordinates. Subsequently, a quality flag is assigned to each GRID event: (G), (P), (S), and (L), depending on whether it is recognised as a confirmed gamma-ray event, a charged particle event, a single-track event, or its nature is uncertain, respectively. The (L) event class includes events typically affected by an order of magnitude higher particle contamination than (G). The single-track (S) event class includes events for which only one track is reconstructed in the two orthogonal views of the tracker. Then, an AGILE log-file is created, containing all the information relevant to computating the exposure and live time. The third step is to create the AGILE event files, excluding events flagged as particles. This step also reconstructs the event direction in sky coordinates.
Once the above steps are completed, the AGILE Scientific Analysis Package can be run. Counts, exposure, and Galactic background gamma-ray maps are created with a bin-size of for photons with energy over 100 MeV. To reduce the particle background contamination, we selected only events flagged as confirmed gamma-ray events, and all events collected during the South Atlantic Anomaly were rejected.
We also rejected all the gamma-ray events whose reconstructed directions form angles with the satellite-Earth vector smaller than 80∘, reducing the gamma-ray Earth albedo contamination by excluding regions within from the Earth limb. We ran the AGILE maximum likelihood procedure (ALIKE) on the whole observing period, in order to obtain the average flux in the gamma-ray band.
4 Results
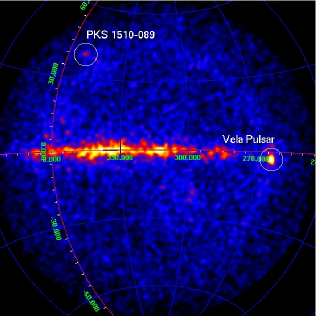
Figure 1 shows a Gaussian-smoothed count map in Galactic coordinates integrated over the observing period 2007 August 23 - 27 for photon energies over 100 MeV. In this period, AGILE detected gamma-ray emission from a position consistent with the quasar PKS 1510-089 at a significance level of 5.6- as derived from a maximum likelihood analysis using the PKS 1510-089 radio position . During this period the source was located off the AGILE pointing direction. Thanks to the large field of view of AGILE, during this period, the satellite simultaneously also detected the gamma activity of the source Vela Pulsar , about 90 degrees from PKS 1510-089. In addition, the two sources were characterised by an almost equal angular distance from the AGILE pointing direction. This allowed us to obtain an estimate of average flux of PKS 1510-089 through a direct calibration with the flux of the Vela Pulsar. In this way, the average flux (E 100 MeV) estimated for this first period was photons cm-2 s-1. The reduced effective area and the consequently reduced count statistics for these large off-axis angles makes it difficult to create a light curve and an average energy spectrum.
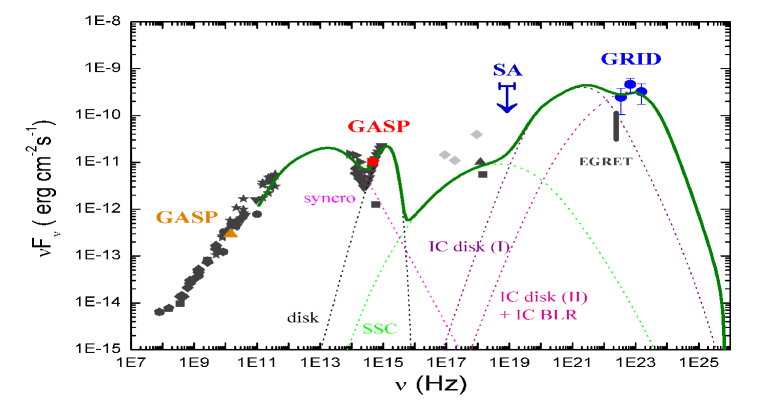
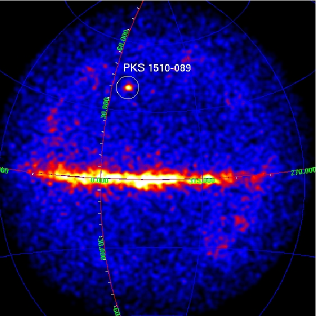
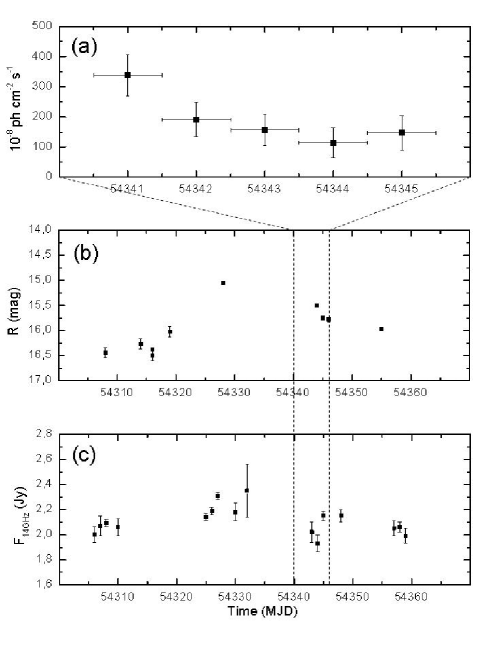
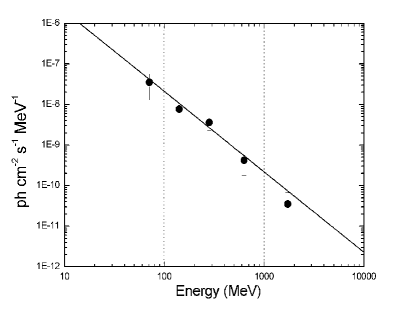
Figure 2 shows a Gaussian-smoothed count map in Galactic coordinates integrated over the observing period 2007 August 27 – September 1 for photon energies higher than 100 MeV. In this period the satellite detected the source at a significance level of 10.6-. With the likelihood method, the best position for the gamma-ray emission above 100 MeV is , with an average flux (E 100 MeV) over the period of photons cm-2s-1. The AGILE 95 maximum-likelihood contour level has a semi-major axis = 0.43∘ and semi-minor axis = 0.09∘. The overall AGILE error circle, taking both statistical and systematic effects into account, has a radius = 0.53∘. During this period the source was observed at off-axis. In Fig. 3 the gamma-ray light curve for this period with a 1-day resolution, the -band optical light curve as observed by the GASP of the WEBT for the observation period between 26 July and 11 September 2007, and the GASP radio light curve (from UMRAO) at 14.5 GHz for the observation period between 24 July and 15 September 2007 111The optical and radio data presented in this paper are stored in the GASP-WEBT archive (http://www.oato.inaf.it/blazars/webt). For questions regarding their availability, please contact the WEBT President Massimo Villata. are reported. Figure 4 reports the average energy spectrum for this second period, when only three energy bins were taken into account for the fit: 100 200 MeV, 200 400 MeV, 400 1000 MeV. The energy bins 50 100 MeV and 1000 3000 MeV have not be used in the spectral analysis waiting for on-flight calibration finalization that will include these two energy channels.
A simple power-law model can fit the data. We obtain a photon index 1.98 0.27 with the weighted least squares method.
Super-AGILE observed PKS 1510-089 for a total on-source effective exposure time of 200 ks. The source was not detected above 5- by the Super-AGILE Iterative Removal Of Sources (IROS) applied to the image, in the 20–60 keV energy range. A 3- upper limit of 45 mCrab was obtained from the observed count rate by a study of the background fluctuations at the position of the source and a simulation of the source and background contributions with IROS.
Finally, in Fig. 5 the spectral energy distribution is shown for the GRID observation period 2007 August 28 - September 1, including simultaneous GASP optical and radio data and the 3- Super-AGILE upper limit. Also non-simultaneous historical data over the entire electromagnetic spectrum are represented.
5 Discussion
During the AGILE observation period, the PKS 1510-089 optical flux appears to be decreasing in the range 15.5 15.8, following a bright state that reached at least = 15.0 (see Fig. 3). The contemporaneous gamma-ray flux decrease of about a factor 3 suggests that the two flux variations may be correlated. In agreement with Kataoka et al. (2007), in order to model the spectral energy distribution we used a homogeneous one-zone synchrotron self-Compton (SSC) model, plus the contribution of external seed photons originating both from the accretion disc and the broad line region (BLR). We obtained a representative fit for the spectral energy distribution with input parameters similar to those chosen by Kataoka et al. (2007). We consider a relativistic moving spherical blob of radius R = 2.5 1016 cm and an electron energy distribution described by a double power law:
| (1) |
for electron Lorentz factor 40 4 with spectral indices pre- and post-break and , a normalization factor K = 80 cm-3 and the break energy Lorentz factor = 400. We assumed a magnetic field B = 3 Gauss and a Doppler factor for the blob.
In order to interpret our gamma-ray data, an accretion disc characterised by a blackbody spectrum with a luminosity of erg s-1 at 0.1 pc from the blob is assumed as the source of external target photons. The inverse Compton (IC) contribution from the disc is calculated up to the second order, but it is not enough to account for the high gamma-ray state observed by AGILE. The addition of the IC emission from a BLR, represented by a spherical layer extending between 0.1 pc and 0.4 pc from the central black hole, reprocessing a 10 of the irradiating continuum can explain the high state observed by AGILE compared to the historical EGRET observations (see Fig. 5), and it reflects on the different photon index obtained in the AGILE and EGRET observations. In this model, the SSC emission primarily contributes to the X-ray band, whereas the IC contribution from the BLR can explain the observed hard gamma-ray spectrum.
Acknowledgements.
The AGILE Mission is funded by the Italian Space Agency (ASI) with scientific and programmatic participation by the Italian Institute of Astrophysics (INAF) and the Italian Institute of Nuclear Physics (INFN). This research has made use of the NASA/IPAC Extragalactic Database (NED) which is operated by the Jet Propulsion Laboratory, California Institute of Technology, under contract with the National Aereonautics and Space Administration.References
- Argan et al. (2004) Argan, A., et al. 2004, Proceedings IEEE-NSS, Vol. 1, 371
- Barbiellini et al. (2001) Barbiellini, G., et al. 2001, Amer. Inst. Phys. Conf. Series, Vol. 587, Gamma 2001: Gamma-Ray Astrophysics, ed. S. Ritz, N. Gehrels, & C. R. Shrader, 754
- Bolton, Ekers (1966) Bolton, J. G., & Ekers, J. 1966, Aust. J Phys., 19, 559
- Burbidge, Kinnan (1966) Burbidge, E. M., & Kinnan, T. D. 1966, ApJ, 145, 654
- Costa et al. (2001) Costa, E., et al. 2001, X-ray Astronomy: Stellar Endpoints, AGN, and the Diffuse X-ray Background, 599, 582
- Feroci et al. (2007) Feroci, M., et al. 2007, Nucl. Instr. Meth. Phys. Res. A, 581, 728
- Gambill,et al. (2003) Gambill, J. K., et al. 2003, AA, 401, 505
- Kataoka,et al. (2007) Kataoka, J., et al. 2007, ApJ, 671, 787
- Labanti et al. (2006) Labanti, C., et al. 2006, in Proc. SPIE, 6266, 62663Q
- Lawson, Turner (1997) Lawson, A. J., & Turner, M. J. L. 1997, MNRAS, 288, 920
- Malkan & Moore (1986) Malkan, M. A., & Moore, R. L. 1986, ApJ, 300, 216
- Perotti et al. (2006) Perotti, F., et al. 2006, Nucl. Instr. Meth. Phys. Res. A, 556, 228
- Pian & Treves (1993) Pian, E., & Treves, A. 1993, ApJ, 416, 130
- Prest et al. (2003) Prest, M., et al. 2003, Nucl. Instr. Meth. Phys. Res. A, 501, 280
- Sambruna, et al. (1994) Sambruna, R. M., et al. 1994, ApJS, 95, 371
- Siebert,et al. (1998) Siebert, J., et al. 1998, MNRAS, 301, 261
- Singh et al. (1990) Singh, K. P., Rao, A. R., & Vahia, M. N. 1990, ApJ, 365, 455
- Singh, Shrader, George (1997) Singh, K. P., Shrader, C. R., & George, I. M. 1997, ApJ, 491, 515
- Tavani, et al. (2008) Tavani, M., et al. 2008, Nucl. Instr. Meth. Phys. Res. A, 588, 52
- Tavecchio,et al. (2000) Tavecchio, F., et al. 2000, ApJ, 543, 535