do Sul, Av. Bento Gonçalves, 9500, CP 15051, Porto Alegre
11email: santiago@if.ufrgs.br
The star cluster system of the luminous elliptical galaxy NGC 1600
Abstract
Context. Luminous elliptical galaxies generally display a rich star cluster system, whose properties provide strong constraints on the physics of galaxy formation and evolution. Star cluster system studies, however, concentrate on galaxies located in nearby or rich galaxy clusters.
Aims. We acquired deep B and I images of NGC 1600, a luminous elliptical in a galaxy group to study its star cluster system. The images were obtained with the Optical Imager at the Southern Telescope for Astrophysical Research for an exposure time of 1.66hr in each filter.
Methods. The sample selection incompleteness was assessed as a function of magnitude and image background level. Source counts were measured for different elliptical annuli from the centre of NGC 1600, background subtracted, and fitted with a Gaussian function. Colour distributions were derived as a function of galactocentric distance for sources measured successfully in both filters. Typical ages and metallicities were estimated based on single stellar population models.
Results. A clear excess of point sources around NGC 1600 was found in relation to the nearby field. The source counts were consistent with a Gaussian distribution typical of other luminous ellipticals. The luminosity function fits provided an estimate of the density of clusters at the different annuli that could be integrated in solid angle, resulting in an estimated total population of star clusters. This yielded a specific frequency of . The colour distributions show a hint of bimodality, especially at kpc from the centre. Clusters in this region may be associated with a ring or shell perturbation. Finally, the star cluster candidates were cross-correlated to discrete X-ray sources and a coincidence rate of was found. These are likely to be globular clusters harboring low-mass X-ray binaries.
Conclusions.
Key Words.:
Galaxies: individual: NGC 1600 – Galaxies: clusters – Galaxies: elliptical and lenticular, cD Galaxies: formation – Galaxies: evolution –1 Introduction
Star cluster systems reveal significant information about their host galaxy formation and evolution. By far, luminous ellipticals display the most conspicuous cluster systems and have been the popular targets for studies of star cluster populations (Kundu et al 1999, Harris et al 2006). Studies are also concentrated on nearby galaxies, some in the field, but most often in galaxy clusters, such as Virgo and Fornax (Larsen et al 2001, Santiago & Elson 1996, Kissler-Patig et al 1997, Peng et al 2006a, Strader et al 2006). An important result of detailed analyses of extragalactic clusters is that clusters in luminous elliptical galaxies present bimodal colour distributions. These are often interpreted as evidence for separate episodes of star and cluster formation, often involving galaxy merging (Ashman & Zepf 1992, Cotê et al 1998; see recent review by Brodie & Strader 2006). Even though most studies refer to extragalactic star cluster systems as globular cluster systems, as in fact globular clusters dominate the cluster counts, the discovery of new classes of clusters, such as faint fuzzies (Larsen & Brodie 2000, Brodie & Larsen 2002) and diffuse star clusters (Peng et al 2006b) suggests that a broader terminology should be adopted.
Galaxies in lower density environments, such as galaxy groups, have also been studied for the presence of extragalactic star clusters (i.e., Kundu & Whitmore 2001, Chies-Santos et al 2006). However, many bright elliptical galaxies in groups still lack an investigation of their cluster system. One such case is the luminous elliptical galaxy NGC 1600.
NGC 1600 is the most luminous elliptical in its loose galaxy group, which also contains two other early-types: NGC 1601 and NGC 1603. Optical surface photometry, both photographic (Barbon et al 1984) and CCD (Mahabal et al 1995) imaging were obtained for the galaxy. Near infra-red surface photometry was completed by Rembold et al (2002). These studies revealed a flattened and boxy shape. Sivakoff et al (2004) obtained Chandra X-ray images and identified dozens of point sources superimposed on the diffuse emission. They tentatively associated the unresolved sources, some of which are classified as ultra-luminous in X-rays, with the population of globular clusters (GCs).
In this paper, we attempt to detect the star cluster system of NGC 1600 using deep imaging with the Southern Telescope for Astrophysical Research (SOAR). Our primary goal is to estimate the total number and specific frequency of clusters in NGC 1600, to derive their colour distribution and associate the star cluster sample with the X-ray point sources identified by Sivakoff et al (2004).
2 Data and Photometry
Deep images of NGC 1600 were taken with the SOAR telescope in B and I filters. The SOAR Optical Imager (SOI) consists of two E2V CCDs, each one with 2k x 4k pixels, covering a field of view of 5.5x5.5 arcminutes. A 2x2 binning was used, yielding a detector scale of 0.154 arcsec/pixel. A total of 6 x 1000s exposures (1.67 hr integration time) were taken in slow read-out mode with each filter during two nights. Photometric standards were also observed on the same nights, along with bias and flat-field images.
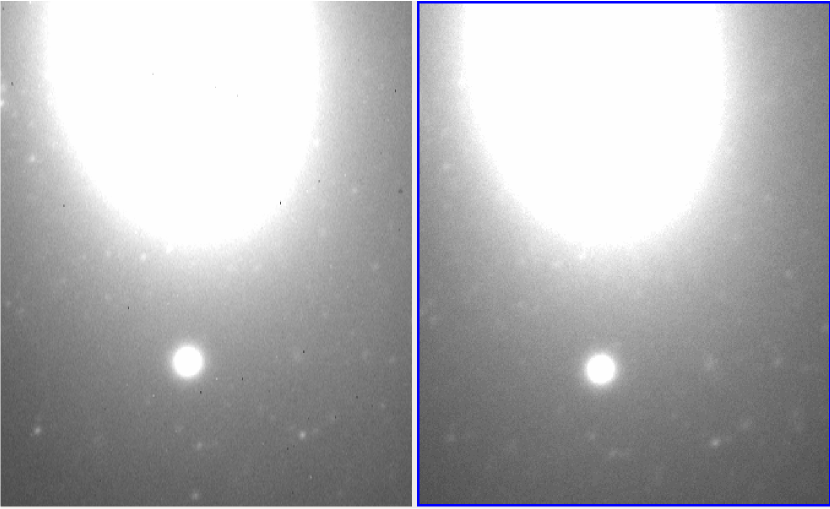
The individual exposures were bias-subtracted and flat-fielded using standard tasks from the Image Reduction and Analysis Facility (IRAF). The SOI I band images are affected by interference that causes a large-scale fringing pattern. These were corrected using the IRAF mscred.rmfringe task, which computes the pattern amplitude minimizing the difference between the target image and a fringe pattern image (usually blank sky), and corrects the former. The original Multiple Extension Format (MEF) files were converted into Flexible Image Transport System (FITS) files, again using the IRAF mscred package. The exposures from the same filter were aligned and combined into a final image, which was used for sample selection and photometry. Figure 1 shows a close-up of the southern side of NGC 1600 of the final I and B combined SOAR/SOI images. A large number of point sources are seen superimposed onto the galaxy’s diffuse light. These are the star cluster candidates. The northern side of the image is partly affected by a strong diffraction spike from a very bright star. Also present in the SOI field (but not in Fig. 1) are the two other galaxies belonging to the same group, NGC 1603 and NGC 1601.
The IRAF daophot package was used to identify point sources and measure their aperture magnitudes. This was completed separately in each of the B and I combined images. Sources with a detection confidence interval 2.5 above the sky background were automatically detected with daofind. An aperture of 4 pixels = 0.61 arcsec was adopted to measure the magnitudes in both filters using the task phot from the same package. The magnitudes were measured over the combined image used for source selection but after the diffuse light from NGC 1600 was modelled and subtracted-off. Isophote fitting with the IRAF task ellipse was applied to model the galaxy intensity distribution. This information was then used to generate a model of NGC 1600 with the task bmodel. This model was subtracted from the combined image to produce magnitude measurements that were unaffected by the steep gradient caused by NGC 1600 light profile. Since a low threshold above the background was adopted in daofind, a visual inspection of the model subtracted image revealed an insignificant amount of extra cluster candidates relative to the authomatic detection. This is important, because it is far easier to compute photometric incompleteness in a sample selected by an automatic procedure rather than by eye.
Photometric calibration was based on 36 magnitude measurements in each filter for 7 standard stars taken from Landolt (1992) and observed at different airmasses. The magnitudes were measured in the same aperture as the point sources in NGC 1600. The calibration fields used for this purpose were SA 95 and PG0231+051 listed in Landolt (1992). The calibration transformation from instrumental magnitudes into Johnson-Cousins system included a linear colour term, a linear airmass term, and a zero-point. A least squares fitting of the three coefficients was carried out for each filter separately. Saturated stars and deviant measurements were eliminated by applying a clipping algorithm iteratively to the magnitude residuals, until convergence. In the B band, a total of 11 measurements were eliminated in the clipping process; for the remaining 25 measurements, the final fit dispersion was . In the I-band, 16 measurements were used in the final fit, with a dispersion .

.
After calibration, magnitudes were corrected for foreground extinction in the direction towards NGC 1600. Schlegel et al (1998) quoted and . Burstein & Heilles (1982) quoted . The average of both determinations was taken, yielding . Correspondingly, . These values were used to correct the calibrated magnitudes and colours, when available.
2.1 Completeness analysis
Completeness experiments were performed on the combined images using the daophot.addstar task. Artificial stars spanning a wide range of B and I magnitudes were added to the combined images. These were created by fitting a moffat point spread function (with ) fitted to bright, isolated, and non-saturated point sources found in the images themselves. The fraction of recovered artificial stars depended not only on their magnitudes but also on their location, and was lower in regions close to the centre of NGC 1600, where the background was dominated by the galaxy light. The effect of NGC 1603 and NGC 1601 on sampling completeness in the B and I image was also modelled. The background level was locally contaminated by a strong diffraction spike towards the north of NGC 1600. This region was masked during the analysis, in addition to the saturated regions in NGC 1600, NGC 1603 (in I only), and NGC 1601 (in both B and I images).
From the completeness experiments, the completeness function could be modelled as a bivariate function of magnitude and background level. This was achieved as follows: for each point source found in a given filter, we first determined, by cubic spline fits to the completeness vs. magnitude relation, the completeness fraction at its measured magnitude for different sky levels. This yielded a completeness versus sky level relation at the source magnitude. Another cubic spline was then applied to this relation to evaluate completeness at the background level at the location of the source. Each star was then assigned a weight equal to the product where and are the completeness fractions calculated for the B and I images, respectively.

3 Luminosity functions
Source counts as a function of B and I magnitudes were then derived for several independent elliptical rings around NGC 1600. These are shown in Figs. 2 and 3 for the samples selected from the B and I images, respectively. The units are sources kpc-2 and the plots are in logarithmic scale. Since a bin size of was used, the numbers were doubled to be normalized to unit magnitude. Image surface was converted into physical surface assuming that NGC 1600 is at a distance of 63.0 Mpc (taken from NASA Extragalactic Database, NED111http://nedwww.ipac.caltech.edu/).This corresponds to a distance modulus of and yields a conversion of . The radial ranges given in the figure panels correspond to the inner and outer semi-major axis of each elliptical annulus used. Panel a shows the total counts, including the background sources located away from NGC 1600 and the other galaxies in its group. The remaining panels show the excess source counts around NGC 1600 after the field counts were subtracted at each elliptical annulus.
We assume that all excess counts are star clusters, most of them globular clusters, belonging to NGC 1600 and attempt to fit the globular cluster luminosity function (GCLF) at the different radii. A Gaussian GCLF was assumed to have the form:
where we assumed that and . This is an intermediate value between that quoted by Harris 1991 and that used by Larsen et al (2001) based on HST data. Typical GC colours of and were adopted when fitting the functions to the B and I counts shown in the figures. These are colours of old ( Grys) single stellar populations with sub-solar () metallicity, according to Bruzual & Charlot (2003). By fixing the turn-over GCLF luminosity and its width, the fits had only the normalization, , as a free parameter. The most accurate Gaussian fits are represented by the middle lines in Figs. 2 and 3. They were obtained by varying the normalization until the quantity
reached a minimum. In the expression above, was the number of points to be fitted in each region, was the Gaussian function given by eq. (1), is the observed source density. The associated density fluctuation, , was found by propagating the Poisson fluctuation in the source number counts, , in a given region and magnitude bin.
The upper and lower lines shown in Figs. 2 and 3 represent confidence levels in for the best-fitting Gaussian functions. The variation in was measured with 300 bootstrap realizations in which the source counts were varied according to a Poisson distribution and the fit was repeated. In generating these realizations, a Gaussian distribution of shifts in the assumed distance modulus and , with zero mean and standard deviation and were also applied, to simulate uncertainties in these quantities. We emphasize that the adopted typical variation of 0.1 mag in distance modulus is larger than the expected uncertainties in the Hubble constant and flow models, and that this variation alters our answers by less than the amplitude of the Poisson fluctuations.
These fits in conjunction with the assumed Gaussian model for the GCLF allow us to estimate the size of the star cluster system of NGC 1600.
The values and the expected total number of GCs are listed in Tables 1 and 2 for each annulus. The latter is given by
where is the axis ratio of the annulus, and are the inner and outer semi-major axes, and is the GCLF in units of sources kpc-2, as given in Eq. (1). The axis ratio is obtained from the isophote fitting of NGC 1600; it is with little variation with position. Given the range and the fitted normalization density, we can derive the value of with no additional free parameters. The uncertainties in shown in Tables 1 and 2 are the 1 spread in this quantity evaluated from the results of the 300 bootstrap realizations described earlier. The uncertainties in are propagated from those in .
-
Column 1: range in pixels between inner and outer semi-major axes of annulus used for source counts (1 kpc = 21 pixels); Column 2: total number of sources found in the annulus; Column 3: total weighted number of sources in annulus; Column 4: normalization density of Gaussian fit to GCLF at given annulus, as explained in text (in units of ); total expected number of clusters in annulus, obtained as explained in the text.

The points marked with an asterisk in Tables 1 and 2 are estimates based on inward extrapolations of the source densities from the other bins. They correspond to regions in which the high intensity of the galaxy caused saturation (or a non-linear response regime on the CCD) and prevented reliable detection and measurement of magnitudes for a sizable sample. The study of these inner regions is however necessary to allow an estimate of the total number of star clusters in NGC 1600. Also shown in the tables is the cumulative number of clusters. The system size derived from these counts is almost independent of the band used. The expected total number of clusters in NGC 1600 is . Assuming to be the absolute magnitude of this galaxy, we derive for its specific frequency of clusters. This is relatively low for a luminous elliptical such as NGC 1600. Dirsch et al 2003 measured for the cD in Fornax cluster, NGC 1399. Rhode & Zepf (2004) found that and for NGC 4406 and NGC 4472, respectively, in Virgo. These galaxies are of similar luminosity but located in higher density environments than NGC 1600. It is therefore possible that the difference in is an environmental effect. However, Forbes et al (1997) measured for the luminous cD group galaxy NGC 5846. Another possibility is that the star cluster system of NGC 1600 extends further beyond the edge of the SOAR image field-of-view, even though the field includes all diffuse light from the galaxy. We cannot presently exclude this possibility and this estimate should be regarded as a lower limit.

Figure 4 shows the estimated density of stellar clusters belonging to NGC 1600 as a function of galactocentric distance, expressed in terms of semi-major axis of the elliptical annulli. The densities are in units of star clusters kpc-2 and were obtained by integration of Eq. (1) over all magnitudes at each distance bin. The points shown as stars or crosses are the result of inward extrapolation of the measured densities, as discussed above. Figure 4 also shows, for comparison, the surface brightness profiles of NGC 1600 for both filters. These profiles were derived from the isophotal fitting of data for NGC 1600 described earlier. We note that the cluster system follows the light profile of the field stars out to the projected distances probed ( pix kpc). This is in contrast to that observed for several other luminous ellipticals (Harris 1986), although, as afore mentioned, we cannot exclude the existence of an envelope of star clusters outside the field studied.
4 Colour distributions
Colour distributions are a useful discriminator between the different star cluster sub-populations, and may reflect different star and cluster formation events within a galaxy. Figure 5 shows the colour distribution for the point sources that have colour information. The units are again in sources kpc-2 and the bin size used was . Panel a shows total colour counts of sources with for the same annuli as in Fig. 3. Panels b and c show the field subtracted source counts.
A spatial colour gradient is visible in the panels, in the sense that redder star clusters tend to be found closer to the centre of the host galaxy. The average star cluster colour varies from in the innermost region shown in Fig. 5 to in the pix ( kpc) annulus. This may reflect true changes in metallicity or age, although redenning caused by dust may also contribute. Similar trends were observed by Forbes et al (1997) in the central group elliptical NGC 5846, and are also common in luminous cluster ellipticals (Lee & Geisler 1993, Harris et al 1998, Larsen et al 2001). There is a hint of bimodality in the distributions associated with NGC 1600 both in the inner regions and beyond pix ( kpc). The large peak in the inner regions of NGC 1600, with (see panel b), is typical of an old () and fairly metal-rich () single stellar population according to the models by Bruzual & Charlot (2003) and assuming extinction to be negligible. Comparable colours were found by Grillmair et al (1999) for NGC 1399 and NGC 1404. The smaller peak at is also present in the region pix ( kpc), again shown in panel b of Fig. 5. This colour requires lower metallicity for an old population or significantly younger ages, Gyrs, at solar abundance.
A clearly larger spread in colours, with two likely peaks, is observed in the intermediate annulus pix ( kpc), shown in panel c of Fig. 5. The redder peak has approximately the same colour, , as an old star cluster with . The bluer peak, however, has . According to Fig. 4, this region coincides with the position of a bump in the light profile of the galaxy, which is more pronounced in the blue. Probably, this is a ring or shell. Its blue colour is also consistent with the smooth profile in the near infra-red bands shown by Rembold et al (2002). In fact, Forbes & Thomson (1992) identified an outer shell in NGC 1600 in an R band image. It is possible that the larger spread in colours about this distance may be associated with this feature and the bluer cluster peak may represent a younger population of star clusters formed at the onset of the perturbation in the host galaxy.

5 X-ray counterpars
The sample of star cluster candidates was cross-referenced with the list of 71 discrete X-ray sources from Sivakoff et al (2004). Positional matches were achieved on the basis of the equatorial coordinates. The astrometry of the SOI sources assumed a linear relation between CCD and on-sky positions, for the CCD plate scale of 0.154 arcsec/pixel. This assumption was tested with the known coordinates of the 3 galaxies imaged, NGC 1600, NGC 1603, and NGC 1601. The differences between their equatorial coordinates, as listed in the NASA Extragalactic Database (NED), was compared with the expected differences based on the adopted linear transformation from their CCD (x,y) positions. Discrepancies of arcsec were found in all cases, both in declination and right ascension.
In attempting to identify the cluster candidates with the X-ray sources we permitted residual offsets in our coordinates relative to those listed by Sivakoff et al (2004). The approach was to start with the null-hypothesis that several optical/X-ray coincidences should be found, and then search for the offsets in right ascension and declination, within 3 arcsec from our nominal positions, that maximized the number of matches between the two samples. Only optical sources, whose magnitudes and colours were consistent with those of star clusters in NGC 1600 (or in its group), were used in this positional matching process.
Of the 71 discrete X-ray sources identified by Sivakoff et al (2004), a total of 49 were located inside the SOI field limits. Sixteen optical/X-ray coincidences were found, and the offsets in equatorial coordinates that resulted in this number of matches were 1.75arcsec in right ascension and 0.25arcsec in declination. Figure 6 shows the on-sky distribution of the optical and X-ray sources. The two clumps of optical sources correspond to NGC 1600 and NGC 1603. Eleven of the coincidences are clearly associated with NGC 1600, being within 40 kpc (132 arcsec) of its centre. A total of 28 X-ray sources are in this same region, yielding a coincidence rate of 39%. This may be an underestimate, given the optical sample incompleteness, although there is a known trend towards optical/X-ray coincidences being related to bright sources in the optical (Chies-Santos et al 2006, Kundu et al 2007, Sivakoff et al 2007). For example, Kundu et al (2007) studied 5 early-type galaxies using HST data, and found that the vast majority of clusters harbouring low-mass X-ray binaries (LMXBs) have . Similarly, most GCs with a LMXB in the sample of 11 luminous elliptical and S0 galaxies in Virgo studied by Sivakoff et al (2007) have . Due to the detection limits of the SOAR photometry, we note that all 16 matched sources in this work have (or ) if they are at the distance of the NGC 1600 group.
Kundu et al (2007) and Sivakoff et al (2007) also found that GCs with LMXBs had a strong tendency to belong to the red peak of the colour distribution. In the case of NGC 1399, Kundu et al (2007) found that all clusters with LXMBs had . In our NGC 1600 sample, we found 4 optical/X-ray matches with bluer values. The remaining 7 objects have redder colours. Since the sample was small and we are unable to confirm that individual objects are star clusters in NGC 1600, it is currently impossible to assess if this apparent discrepancy is significant.
Table 3 lists the 16 sources found to coincide with X-ray discrete sources; both optical and X-ray properties, the latter taken from Sivakoff et al (2004), are listed. The top 11 entries are those of sources located around NGC 1600. Inspection of Table 3 does not reveal any strong systematics between X-ray luminosity and optical colour or magnitude, although the range in the latter quantity is small. Only one of the sources listed in the table was previously related to an optical counterpart by Sivakoff et al (2004): this was source 40, which is close to the centre of the companion galaxy NGC 1603. All sources matched but one, source 3, are consistent with being point sources, according to these authors. Source 3 is close to the centre of NGC 1600.
-
Column 1: source identification number given by Table 2 of Sivakoff et al (2004); Columns 2 and 3: equatorial coordinates (J2000) of X-ray sources, given by Sivakoff et al (2004); column 4: X-ray luminosity in units of ergs/s; columns 5 and 6: calibrated magnitude and colour from this work.
6 Conclusions
Deep B and I photometry of the galaxy group of NGC 1600 has been obtained using the SOAR telescope. Several thousand point sources were found in the field for both filters. There was a significant excess of point sources around the luminous elliptical NGC 1600, which we associated with its star cluster system. Magnitudes and colours were measured and sample incompleteness was also quantified. The star cluster luminosity functions at different elliptical annuli around NGC 1600 were all consistent with a Gaussian of typical average luminosity and dispersion. Assuming this functional form, the total surface density of star clusters, corrected for sampling incompleteness, was obtained as a function of galactocentric distance. The density distribution was similar to the underlying light distribution of the galaxy. A total of star clusters were estimated to exist within the central kpc of NGC 1600, yielding a specific frequency of in this region. Since the cluster system may extend beyond the diffuse galaxy light and the limits of the field studied, this estimate should be considered as a lower limit.
The colour distribution had a hint of bimodality, especially at the centre of NGC 1600 and at an intermediate region kpc away. The reddest and most significant peak at the centre is consistent with a Gyr old metal-rich () star cluster population. The bluer peak, which also dominates the cluster counts at kpc, is either an old population with 1/5 of the solar abundance or a Gyr old population of solar metallicity.
The colour distribution became particularly wide and bimodal at kpc from the centre of NGC 1600. This region coincided with a bump in the surface brightness profile of the host galaxy, which is clear in the filter image and completely absent in the near infra-red. This is probably a ring or shell, as previously suggested by Forbes & Thomson (1992). This perturbation may have been accompanied by star and cluster formation. The bluer colours found in the cluster sample in this region may be related to such a star formation event, which would indicate a relatively young star cluster population.
Finally, the optical cluster sample was cross-correlated with the discrete X-ray sources from Sivakoff et al (2004). The coincidence rate within 40 kpc of the galaxy centre, where an excess of point sources in the optical is clearly seen, is . The optical/X-ray coincidences vary widely in X-ray luminosity and optical colours, but due to the magnitude limit of the SOAR image they all correspond to optically luminous star clusters (). Since previous studies, based on Chandra and HST data, indicated that clusters with LMXBs are preferentially luminous, it is possible that the sample of optical/X-ray matches that we have found is a reasonably complete census of GCs harbouring X-ray sources in NGC 1600. Except for one source, all matched sources are consistent with being unresolved in the Chandra images.
Acknowledgements.
This work was supported by Conselho Nacional de Desenvolvimento Científico e Tecnológico (CNPq) in Brazil through a research grant to BXS. The author thanks the staff at SOAR for taking the data.References
- (1) Ashman, K., & Zepf, S., 1992, ApJ, 384, 50.
- (2) Barbon, R., Benacchio, L., Capaccioli, M., & Rampazzo, R., 1984, A&A, 137, 166.
- (3) Brodie, J., & Larsen, S., 2002, AJ, 124, 1410.
- (4) Brodie, J., & Strader, J., 2006, ARA&A, 44, 193.
- (5) Bruzual, G., & Charlot, S., 2003, MNRAS, 344, 1000.
- (6) Burstein, D., & Heiles, C., 1982, AJ, 87, 1165.
- (7) Chies-Santos, A., Pastoriza, M., Santiago, B., & Forbes, D., 2006, A&A, 455, 453
- (8) Chies-Santos, A., Pastoriza, M., & Santiago, B., 2007, A&A, 467, 1003
- (9) Cotê, P., Marzke, R., & West, M., 1998, 501, 554
- (10) Dirsch, B., Richtler, T., Geisler, D., Forte, J., Bassino, L., & Gieren, W., 2003, AJ, 125, 1908
- (11) Elson, R., & Santiago, B., 1996, MNRAS, 280, 971.
- (12) Forbes, D., & Thomson, R., 1992, MNRAS, 254, 723
- (13) Forbes, D., Brodie, J., & Huchra, J., 1997, AJ, 113, 887.
- (14) Grillmair, C.J., Forbes, D., Brodie, J.P., & Elson, R.A.W., 1999, 117, 167
- (15) Harris, W., 1986, AJ, 91, 822.
- (16) Harris, W., 1991, ARA&A, 29, 543.
- (17) Harris, W., Harris, G., & McLaughlin, D., 1998, AJ, 115, 1801
- (18) Harris, W., Whitmore, B., Karakla, D., Okoń, W., Baum, W., et al, 2006, ApJ, 636, 90.
- (19) Kissler-Patig, M., Kohle, S., Hilker, M., Richtler, T., Infante, L. & Quintana, H., 1997, A&A, 319, 470.
- (20) Kundu, A, Whitmore, B., Sparks, W., Macchetto, D., Zepf, S., Ashman, K., 1999, ApJ, 513, 733.
- (21) Kundu, A, & Whitmore, B., 2001, AJ, 121, 2950.
- (22) Kundu, A., Maccarone, T., & Zepf, S., 2007, ApJ, 662, 525.
- (23) Landolt, A., 1992, AJ, 104, 340.
- (24) Larsen, S, & Brodie, J., 2000, AJ, 120, 2938.
- (25) Larsen, S, Brodie, J., Huchra, J., Forbes, D., & Grilmair, C., 2001, AJ, 121, 2974.
- (26) Lee, M.G., & Geisler, D., 1993, AJ, 106, 493
- (27) Mahabal, A., Kembhavi, A., Singh, K., & Green, R., 1995, JApAS, 16, 206.
- (28) Peng, E., Jordán, A., Coté, P., et al, 2006, ApJ, 639, 95.
- (29) Peng, E., Coté, P., Jordán, A., et al, 2006, ApJ, 639, 838.
- (30) Rhode, K. & Zepf, S., 2004, AJ, 127, 302
- (31) Rembold, S., Pastoriza, M., Ducati, J., Rubio, M., Roth, M., 2002, A&A, 391, 531
- (32) Schlegel, D., Finkbeiner, D., & Davis, M., 1998, ApJ, 500, 525.
- (33) Sivakoff, G., Sarazin, C., & Carlin, J., 2004, ApJ, 617, 262.
- (34) Sivakoff, G., Jordán, A., Sarazin, C., Blakeslee, J., Côté, P., Ferrarese, L., Juett, A., Mei, S., & Peng, E., 2007, ApJ, 660, 1246.
- (35) Strader, J., Brodie, J., Spitler, L., & Beasley, M., 2006, AJ, 132, 2333.