Optical transition in self-assembled InAs/GaAs quantum lens under high hydrostatic pressure
Abstract
We present a simulation to characterize the dependence on hydrostatic pressure for the photoluminescence spectra in self-assembled quantum dots with lens shape geometry. We have tested the physical effects of the band offset and electron-hole effective masses on the optical emission in dot lens. The model could be implemented to get qualitative information of the parameters involved in the quantum dot or the measured optical properties as function of pressure.
pacs:
02.30.Nw,73.22.-f,73.22.Dj,81.40.VwI Introduction
The study of the physical properties of nanostructures is of great importance nowadays. Specifically, self-assembled quantum dots (QDs) grown by Stranski-Krastanov method Stranski-Krastanow have attracted great attention from the scientific community hawrylak-book ; Grundmann-book . A lot of works have been devoted to the study of the electronic and optical properties of QDs where their shape are modeled as quantum pyramids cusack96 ; cusack97 ; grundmann95 ; zunger99 ; pryor98 ; grundmann99 ; zunger01 ; mervyn . It has been also considered QDs having lens shape hawrylak96-1 ; eaglesham90 ; forchel96 ; hapke99 ; zhu98 ; liao98 ; moison94 ; arezky01 ; zou99 ; even . In this case, there is a rather extended opinion which states that the work done considering QDs with pyramids shapes can be straightforward applied to characterize the QDs with lens shape and therefore, the calculation made in pyramids QDs does not need to be re-calculated in quantum lenses. Nevertheless, different authors have shown the importance to consider the full lens geometry for a better description of the optical properties of the QDs ngo ; lew ; AHR2006pss1 ; even .
Photoluminescence (PL) measurement under high hydrostatic pressure has been proveed to be an effective tool for exploring the electronic structure and optical transitions in QDs tang ; goni1 ; goni2 ; wei ; Itskevich97 ; Itskevich98 ; Itskevich99 ; ma2004 . It is reported a significant decreasing in the hydrostatic pressure coefficient (PC) for InAs/GaAs QDs in comparison with bulk material. Different experimental works have proposed some explanations: non-uniform Indium distribution in the QDs mintairov , pressure dependence of the effective masses and confined potential ma2004 , and the necessity to include a nonlinear strain distribution goni1 and band-gap pressure dependence and finite barriers luo . From the theoretical point of view some works have been devoted to explain the obtained low value of hydrostatic PC. For example, elasticity theory in Ref. tang, , atomistic empirical pseudo-potential method in Ref. wei, and atomistic valence-force field method in Ref. goni2, were implemented. In all of the former works, the QDs have been modeled as quantum pyramids.
The motivation of the presente work is focused on the experimental observations of Ref. goni1, ; Itskevich97, ; Itskevich98, ; Itskevich99, . They have performed studies of low-temperature PL in InAs and InGaAs self-assembled quantum dots (SAQDs) embedded in GaAs matrix under hydrostatic pressure. From the pressure dependence of the main electron-hole transition energy, a pressure coefficient 20% smaller that the InAs case was reported. In Refs. tang, and Itskevich97, some arguments could explain this difference in the pressure coefficients: (i) the change of the band offset between InAs and GaAs, (ii) the strong tension in the InAs SAQD material and, (iii) the lowering of the electron and light-hole quantization energies due to the change of the effective masses with pressure.
In Ref. Itskevich99, was argued that the dots can be characterized by a lens symmetry with a base between and nm of radius and ratio height/radius between and . We need to appoint that, in general, the shape and dimensions of the InAs/GaAs SAQDs are not always well determined and a degree of freedom remains.
An attempt to describe the PL peak energies can be found in Ref. duque-jpcm, where the spatial confined geometry was modelled as a parabolic cylinder potential avoiding the specific geometry of the SAQDs. It is well known that different geometries yield different results, as shown in Ref. AHR2006pss1, when comparing the electronic properties between a cylindrical and a lens shape SAQD. In this paper, the QD will be modeled by a full lens symmetry with maximum height and circular cross section of radius with . It is implemented a model which allows the inclusion of the finite barrier effect in SAQD with lens shape. The model allows to validate the importance of the change of the band offset and electron-hole effective masses as a function of pressure on the PL spectra. In our simulation the strain effect within the QD has been taking into account through an effective linear pressure coefficient at zero temperature which consider the built-in strain of the dot by assuming a simple two-dimensional strained layers model (see Table 1 and Refs. ma2004, ; duque-jpcm, ; frogley, ). The QDs considered here are within the strong confinement regime and as first approximation the excitonic effects are ignored.
The remainder of the paper is organized as follows. Section II deals with the general trends of the simulation for including the hydrostatic pressure in QDs characterized by a lens geometry with a short discussion of the model used to obtain the electronic spectrum. Section III presents theoretical calculations for the system comparing the effect of the hydrostatic pressure over different quantum lenses. A comparison with available PL data of the main transition energy as a function of is presented in Sec. IV. Finally, section V is devoted to the conclusions.
II Basic relations
The fractional change in volume in the InAs domain is given by
| (1) |
where and are the compliance constants duque-jpcm . The energy gap at low temperature at the point is proportional to the pressure according to
| (2) |
where is the gap energy at and , is the pressure coefficient and and are the temperature coefficients duque-jpcm . For the case of InAs/GaAs SAQD, the parameters used for both materials are shown in Table 1. With the inclusion of the finite stress it can be seen that the coefficient is greater for the GaAs material than the InAs. Hence, the confined potential for the conduction and valence bands will increase with pressure. The variation of the effective masses was evaluated in terms of the fundamental gaps according to the Kane model and it was obtained trallero-unpublished
| (3) |
for electrons,
| (4) |
for light holes and
| (5) |
for the heavy holes. Here is the gap energy given by Eq. (2), and are the Luttinger parameters, is the spin-orbit splitting and is the free electron mass. The parameter is the interband momentum matrix element between the conduction and valence bands.
The PL lines in such QDs structures are proportional to the optical transition energies which are function of the pressure. The energy levels at a given band are characterized by the radial label with axial projection of the angular momentum with quantum number . Then, in the framework of the parabolic band model, the transition energy means the energy difference between the states () and () in the valence and conduction bands, respectively. The Oscillator Strength (OS) is given by PRB-DR :
| (6) |
In the case of a SAQD with axial symmetry, it is obtained for the former expression for and only the terms with remains. The integration is over the whole domain of the QD.
II.1 Electronic structure

Although previous theoretical studies in QDs with lens shape jpacm ; jap ; PRB-DR considered infinite potential wall, the finite value of the band offset is a fundamental parameter when considering the hydrostatic pressure, as can be seen from Eq. (2). Then, in our case, the problem for a finite barrier will be modelled including a lens-shape well potential with height in a hard-walls semi-spherical region, as shown in Fig. 1. The semi-spherical region is divided in two regions, and with confined potential zero and , respectively, and the mismatch boundary conditions are considered at the interface. Assuming parabolic band dispersion for electron and holes, the solution of the effective mass equation for a lens geometry, with finite barrier, in an infinite surrounding medium can be obtained by minimizing the effect of the external boundary over the wavefunction of the corresponding energy level under study. This can be achieved taken larger enough value of the distance . The equation for the whole region is:
| (7) | |||
where
and
The analytical solution of Eq. (7) is sought in the closed form
| (8) |
where the set of functions is a complete set of functions in the 3D domain determined by the semi-sphere and its explicit representation can be found in Ref. jpacm, . With the former expansion the functions satisfy the boundary condition of infinite barrier in the contour because the set of functions does. On the other hand, Eq. (7) and the corresponding solution given by Eq. (8) are written for the whole domain . It guarantees that the matching conditions at the contour are also satisfied, but only at those points where it is well-defined the derivative of the wavefunction. This does not occur at the corners of the contour where the differentiation with respect to the normal to the surface presents a discontinuity and, generally speaking, the problem is then not well-defined courant . The obtained eigenvalues constitute only an estimation of the solution for the real problem but we accept this solution as a better one than the values reported by the infinite barrier case. The present formalism has been applied in previous works goff , but not explicit analysis has been done about the method used and the fulfillment of the matching conditions between the internal and the external domain.

In order to visualize the results of the above described model, two different quantum lens geometries of InAs/GaAs have been considered. In Fig. 2 are shown the first five electronic levels as a function of the lens radius. Panel a) is for while panel b) is for . The levels calculated within the hard wall model jpacm are shown by dotted lines while the results obtained using the finite barrier model are described by solid lines. For the finite barrier case, it has been used a matrix and a value of to guarantees that the absolute and relative errors introduced by the contour and the cut-off of Eq. (8) in the values obtained for the energy levels are less than 10-3. According to the results of the Fig. 2, it can be seen that the infinite barrier is a good approximation for radius of the order of 20 nm or higher when . As decreases, the values of the energy levels increase and the effects of the finite barrier become important. Then, it is necessary to consider the finite barrier effects to get better accuracy for the energy levels distribution at the same range of radius.
III Results and discussion
| InAs | GaAs | |
|---|---|---|
| (eV) | ||
| (meV/kbar) | ||
| ( eV/K) | ||
| (K) | 83a | 204a |
| (meV) | ||
| (eV) |
| a Ref. nota1, , | b Ref. nota2, , | c Ref. duque-jpcm, , |
|---|---|---|
| d Ref. landolt, , | e Ref. vlr, , | f Ref. trallero1998, |
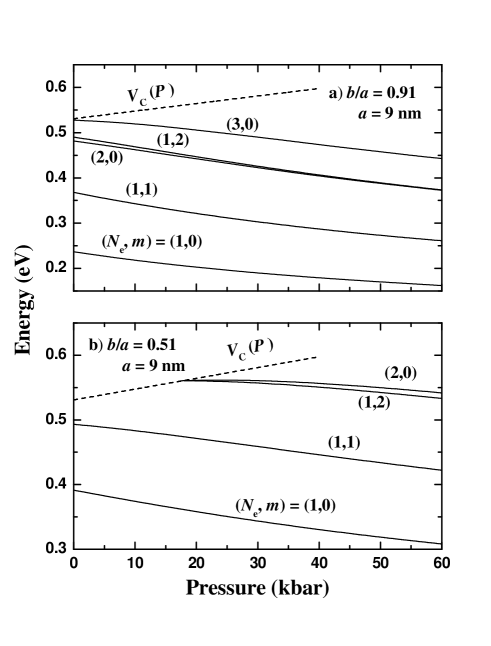
Figure 3 shows the variation with pressure of the first energy levels in the conduction band for two lens configurations [Fig. 3a)] and [Fig. 3b)] with nm. In both figures it is included the height of the potential barrier as a function of the pressure by dashed lines. The band offset of the strained InAs/GaAs quantum lens was taken, for the conduction (valence) band, as 54 (46) of the total band difference duque-jpcm .
It is interesting to note the decreasing of the values of the conduction energies levels with the increasing of , in spite of the increasing of the barrier height according to Eq. (2) and the decreasing of the dot radius following Eq. (1). This effect is very robust for both configurations shown in Fig. 3. This fact is a direct consequence of the strong influence of the variation of the electron mass with according to Eq. (3). The same will happen for the light hole (see Eq. (4)). In the case of Fig. 3 b), due to the strong lens deformation, only two electron states are present at [(1,0) and (1,1)] and two more appear at kbar.

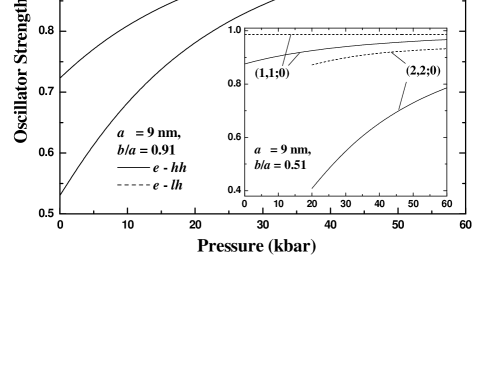
In Fig. 4 it is shown the OS as a function of the pressure, for the first electron-hole states with . Each line is labelled according to the corresponding transition , which means a transition between the valence band states to the conduction band states . Only those states with are shown, because they present the stronger values of the OS. The values of the OS corresponding to the transitions with are very small and decrease with the pressure. There are shown by solid lines the transitions from heavy hole valence band and by dashed lines from light hole valence band, for comparison. The configuration used was nm and while in the inset the same radius it is used, but a more confined region with . It can be seen that as the number increases, the OS value decreases for a given pressure. Nevertheless, the OS for the light hole states have larger value than those corresponding to the heavy hole contributions. From the figure follows that as the ratio decreases ( in the inset) and keeping constant the lens radius, the value of the OS is reduced. This result is a direct consequence of the spatial confinement. Since the energy levels rise with the confinement (see Fig. 3) the wave functions are less localized and the overlapping of the states with different effective masses decreases. Finally, it can be seen the increasing of the OS as increases. Hence, we can conclude that at high pressure the main contribution to the observed PL lines comes from these states with .

Taking in consideration the selection rules above obtained, in Fig. 5 is shown, in solid lines, the variation with the pressure of the first allowed optical transition energies for and two InAs/GaAs quantum lens configuration. In Fig. 5 a) it is considered while in Fig. 5 b) we have a stronger deformed lens with . In both cases we used nm, and a matrix in the diagonalization procedure. The dashed line is the variation of the energy gap of the GaAs surrounding medium as a function of the pressure. In general, all transitions correspond to the electron-heavy hole states, except , which corresponds to the electron-light hole state. As can be seen, the values of the transition energy for these states always increases with pressure. This behavior is due to the InAs energy gap dependence on according to Eq. (2) duque-jpcm ; ahr-pssb-aceptado . In the case of Fig. 5 b), the stronger confinement provokes an increases of the corresponding energy levels and at we are in presence of only two transitions, while transitions (1,2;2) and (2,2:0) appear for kbar.
On the other hand, each panel shows, in dotted line, the calculation using the infinite potential barrier model. Here, we introduced an effective radius as a fitting parameter at for the ground transition energy (). In Fig. 5 a) the fitting procedure is reasonable good for the electron-hole ground state (1,1;0) for all values of but it becomes worse for the excited ones. In the case of Fig. 5 b), the implementation an at does not work properly even for the (1,1;0) transition and it does not have sense for the (2,2;0) electron-hole state transition. This result can be understood taking in consideration that Fig. 5 b) corresponds to the strong confinement regime and the infinite barrier model break down. It the case of a quantum lens with higher values of and radius (soft confinement regime), the energy levels are deep enough in the well. Then, the finite value of the band offset, and its dependence with the pressure, will have no appreciable influence on the transitions energies and the model of infinite barrier will be suitable for characterize the system.
IV Comparison with experimental results.
In spite of the limitation of the present simulation we explored its viability comparing with available experimental data. Figure 6 shows, in solid circles, the experimental transition energy for the electron-hole ground sate as a function of the pressure for an InAs/GaAs SAQD reported in Refs. Itskevich97, and Itskevich98, . We have calculated the ground state transition energy () in terms of the applied hydrostatic pressure. To fit the data in our calculation we fixed the ratio independent of and used the value of nm at . The theoretical result is shown in solid line. Note that the value of , but not the radius , here employed match very well with the estimation given in Ref. Itskevich99, .
Notice from the Fig. 6 that the value of the linear pressure coefficient is meV/kbar. In connection with this, the variation of the band offset and the change of the effective masses with are the responsible of the obtained value. Also, it is important to remark that the input used value of the linear pressure coefficient in Table 1 for the InAs is linked to the good match between the simulation and the experimental data. If the typical bulk value of 100 meV/kbar for InAs is used the agreement goes down drastically. The consideration of the built-in strain of InAs/GaAs in the framework of two-dimensional layer model is one of key factor that allows the correct characterization of the fundamental optical emission as function of the hydrostatic pressure.
V Conclusions
It was developed a model which allows us to include the pressure dependence of the volume, the band offset and the effective masses in the calculation of the energy levels at the point of the Brillouin zone in SAQDs with lens shape geometry. It was outlined the importance of the involved parameters on the electronic states and on optical emission for SAQDs under hydrostatic pressure ranging between 0 and 40 kbar. Also, we have delimited the validity of the infinite potential barrier model for the evaluation of the energy levels as a function of the hydrostatic pressure in quantum lens.
The strong strain effect of InAs/GaAs on the gap energy and pressure coefficient can be considered under two-dimensional layer approximation guarantying a reliable description of the fundamental PL line as a function of the applied pressure.
The present model is a qualitative one which needs to be improved in order to include the more complex effects present in such structures such as the real strain field in dots with lens symmetry, the peculiarity of the valence bands in III-V semiconductors and excitonic effects.
Acknowledgement
C. A. Duque would like to thank the Colombian COLCIENCIAS Agency and CODI-Universidad de Antioquia, for partial financial support. This work has been partially supported by the Excellence Center for Novel Materials - ECNM, under Colciencias contract No. 043-2005. The author is also grateful to Dr. Anna Kurczyńska for useful discussion. A. H. Rodríguez would like to thank Dr. Rubén Barrera Pérez for fruitful comments and to the Department of Solid State, Institute of Physics, UNAM, where part of this work was carried out. The authors also thank Dr. Nelson Porras-Montenegro for important discussions.
References
- (1) I. N. Stranski and L. Krastanow, Sitzungsber. Akad. Wiss. Wien 146, 797 (1938).
- (2) L. Jacak, P. Hawrylak, and A. Wojs, Quantum dots (Springer-Verlag, Berlin, 1998).
- (3) D. Bimberg, M. Grundmann, and N. N. Ledentsov, The quantum dot heterostructures (Wiley, Chichester, 1999).
- (4) M. A. Cusack, P. R. Briddon, and M. Jaros, Phys. Rev. B 54, R2300 (1996).
- (5) M. A. Cusack, P. R. Briddon, and M. Jaros, Phys. Rev. B 56, 4047 (1997).
- (6) M. Grundmann, O. Stier, and D. Bimberg, Phys. Rev. B 52, 11969 (1995).
- (7) Lin-Wang and A. Zunger, Phys. Rev. B 59, 15806 (1999).
- (8) C. Pryor, Phys. Rev. B 57, 7190 (1998).
- (9) O. Stier, M. Grundmann, and D. Bimberg, Phys. Rev. B 59, 5688 (1999).
- (10) A. Zunger, Phys. Stat. Sol. (b) 224, 727 (2001).
- (11) M. Roy and P. A. Maksym, Phys. Rev. B 68, 235308 (2003).
- (12) A. Wojs, P. Hawrylak, S. Fafard, and L. Jacak, Phys. Rev. B 54, 5604 (1996).
- (13) D. J. Eaglesham and M. Cerullo, Phys. Rev. Lett. 64, 1942 (1990).
- (14) A. Forchel et al., Semicond. Sci. Technol. 11, 1529 (1996).
- (15) I. Hapke-Wurst et al., Semicond. Sci. Technol. 14, L41 (1999).
- (16) J. H. Zhu, K. Brunner, and G. Abstreiter, Appl. Phys. Lett. 72, 424 (1998).
- (17) X. Z. Liao et al., Phys. Rev. B 58, R4235 (1998).
- (18) J. M. Moison et al., Appl. Phys. Lett. 64, 196 (1994).
- (19) A. H. Rodríguez, C. Trallero-Giner, S. E. Ulloa, and J. Marín-Antuña, Phys. Rev. B 63, 125319 (2001).
- (20) J. Zou, X. Z. Liao, D. J. H. Cockayne, and R. Leon, Phys. Rev. B 59, 12279 (1999).
- (21) J. Even and S. Loualiche, J. Phys. A: Math. Gen 36, 11677 (2003).
- (22) C. Y. Ngo, S. F. Yoon, and W. J. Fan, Phys. Rev. B 74, 245331 (2006).
- (23) L. C. L. Y. Voon and M. Willatzen, J. Phys.: Condens. Matter 14, 13667 (2002).
- (24) A. H. Rodríguez and L. Meza-Montes, Phys. Stat. Sol.(b) 243, 1276 (2006).
- (25) N. Y. Tang, X. S. Chen, and W. Lu, Phys. Lett. A 336, 434 (2005).
- (26) F. J. Manjón et al., phys. stat. sol. (b) 235, 496 (2003).
- (27) C. Kristukat et al., phys. stat. sol. (b) 244, 53 (2007).
- (28) J.-W. Luo, S.-S. Li, and J.-B. Xia, Phys. Rev. B 71, 245315 (2005).
- (29) I. E. Itskevich et al., Appl. Phys. Lett. 70, 505 (1997).
- (30) I. E. Itskevich et al., Phys. Rev. B 58, R4250 (1998).
- (31) I. E. Itskevich et al., Phys. Rev. B 60, R2185 (1999).
- (32) B. S. Ma et al., J. Appl. Phys. 95, 933 (2004).
- (33) A. M. Mintairov et al., Phys. Rev. B 69, 155306 (2004).
- (34) J.-W. Luo, S.-S. Li, and J.-B. Xia, Phys. Rev. B 71, 245315 (2005).
- (35) C. A. Duque et al., J. Phys.: Condens. Matter 18, 1877 (2006).
- (36) M. D. Frogley, J. R. Downers, and D. J. Dunstan, Phys. Rev. B 62, 13612 (2000).
- (37) C. Trallero-Giner, K. Kunc, and K. Syassen, Phys. Rev. B 73, 205202 (2006).
- (38) A. H. Rodríguez, C. Trallero-Giner, M. Muñoz, and M. C. Tamargo, Phys. Rev. B 72, 045304 (2005).
- (39) A. H. Rodríguez, C. R. Handy, and C. Trallero-Giner, J. Phys.: Condens. Matter 15, 8465 (2003).
- (40) A. H. Rodríguez and C. Trallero-Giner, J. Appl. Phys. 95, 6192 (2004).
- (41) R. Courant and D. Hilbert, Methods of mathematical physics (Interscience Publishers, New York, 1953).
- (42) S. L. Goff and B. Stébé, Phys. Rev. B 47, 1383 (1993).
- (43) We have evaluated the influence of the built-in strain in InAs dots on the band gap following the treatments of strained layers reported in Ref. duque-jpcm .
- (44) The band-gap linear pressure coefficients was evaluated according the nonlinear elasticity theory following Refs. ma2004 and duque-jpcm . This treatment explain the lower value of the coefficient for strained InAs relative to the unstrained bulk value. The model assumes a simple strain two-dimensional layers.
- (45) Landolt Börnstein Tables, Vol. 37a of Landolt-Börnstein New Series, Group III, edited by O. Madelung ed. (Springer-Verlac, Berlin, 1982).
- (46) V. López-Richard, G. E. Marques, C. Trallero-Giner, and J. Drake, Phys. Rev. B 58, 16136 (1998).
- (47) C. Trallero-Giner, A. Alexandrou, and M. Cardona, Phys. Rev. B 38, 10744 (1998).
- (48) A. H. Rodríguez et al., Phys. Stat. Sol.(b) 244, 48 (2007).