Prospects and synergies between future atmospheric and long-baseline experiments
Abstract:
In this talk we will discuss the physics reach of the atmospheric neutrino data collected by a future megaton-class neutrino detector. First we will discuss the potentialities of atmospheric neutrinos on general basis, presenting our results in the form of neutrino oscillograms of the Earth: contour plots in the neutrino energy–nadir angle plane. In this context we will analyze in detail the various signatures related to , to the neutrino mass hierarchy, to the octant of and to the phase which appear for different values of the neutrino energy and baseline. Then we will consider concrete experimental setups, showing that synergic effects exist between atmospheric and long-baseline neutrino data: the combination of the two data sets is much more powerful than the simple sum of the sensitivity of each individual data sample.
1 Introduction
Despite their pioneering contribution to the discovery of neutrino oscillations, it is in general assumed that atmospheric neutrino data will no longer play an active role in neutrino physics in the coming years. This is mainly due to the large theoretical uncertainties arising from the poor knowledge of the atmospheric neutrino fluxes, which strongly contrast with the requirement of “precision” needed to further enhance our knowledge of the neutrino mass matrix. In this talk, we will show that despite these large uncertainties the atmospheric neutrino data collected by a megaton-class detector will still provide very useful information.
The main strength of atmospheric data is its very broad interval in neutrino energy () and baseline (determined by the nadir angle ). In order to provide a global view of this whole range, in this section we will make extensive use of neutrino oscillograms of the Earth, i.e. contours plots in the neutrino energy–nadir angle plane [1, 2]. Consider a bin centered at with extensions and . The numbers of expected () and observed () events in such bin are of course proportional to its size. Hence its contribution to the total function is:
| (1) | |||
| (2) | |||
| (3) |
As we will see, different regions of the (, ) plane will exhibit characteristic structures whose position and size is determined by various neutrino parameters. The function provides an easy way to highlight which of these regions mostly contribute to the . Hence in the following we will present isocontours of .
2 Sensitivity to oscillation parameters
It is well known that for non-zero value of matter effects induce a resonance in the conversion probability at GeV. The precise position of this peak in the plane depends on the value of , so that in principle atmospheric neutrinos could be used to measure this angle as long as it is larger than about . However, in practice the sensitivity is limited since the signal is unavoidably diluted by the background, and also since the atmospheric neutrino flux at GeV is considerably suppressed. Therefore, although some sensitivity is to be expected in a megaton detector, it is likely that atmospheric neutrinos will not be competitive with dedicated long-baseline and reactor experiments in the determination of .
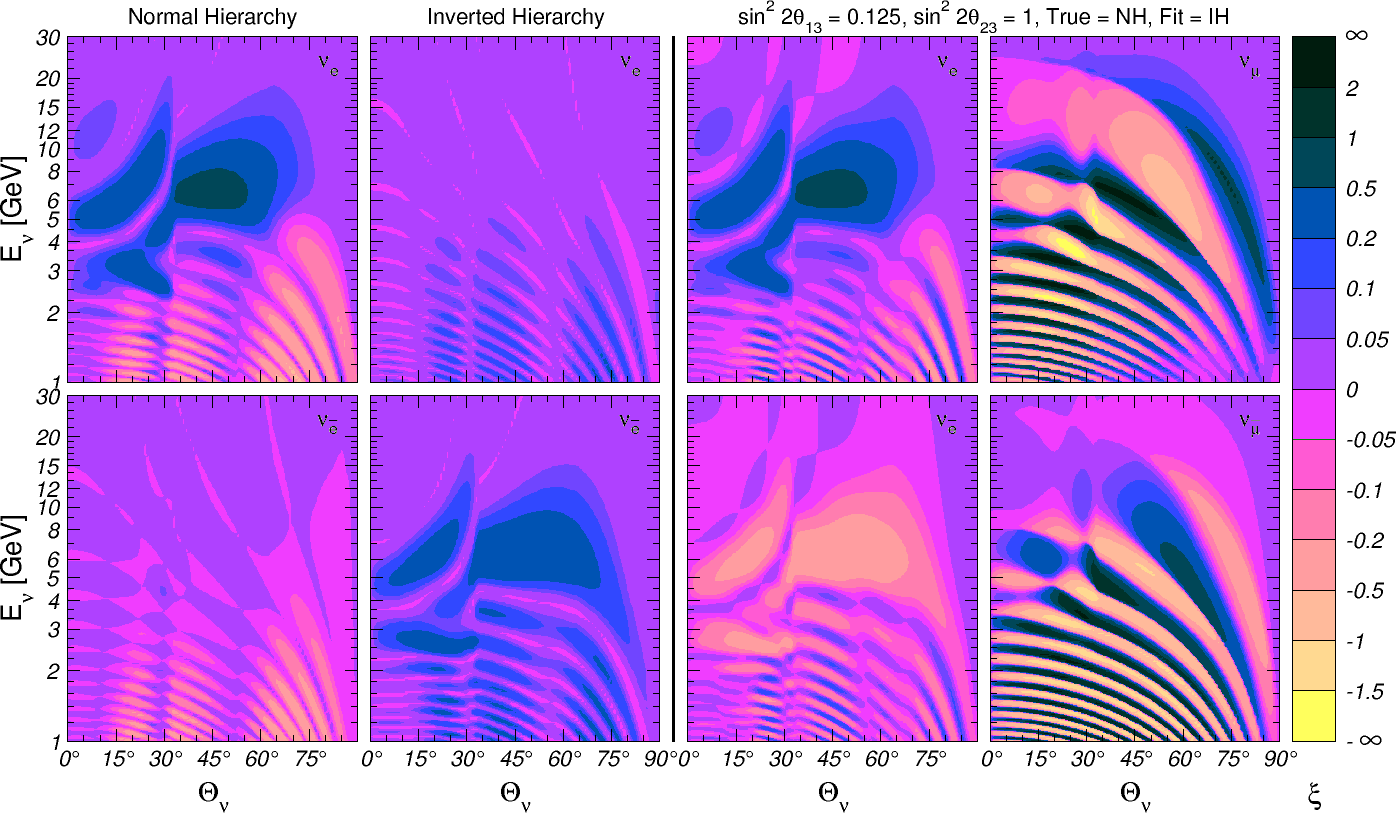
The sensitivity to the hierarchy is illustrated in Fig. 1. We can distinguish two effects:
-
–
in the channel there is a peak arising from the high-energy resonance just discussed for . This signature is only visible if is large enough. Note that in order to determine the hierarchy it is not sufficient to see the resonance: it is also necessary to tell whether it occurred for neutrinos (normal hierarchy) or antineutrinos (inverted hierarchy). It is therefore crucial to have a detector capable of charge discrimination. In the case of a non-magnetic detector such as a Water Cerenkov, a statistical separation of and events can still be obtained by measuring both single-ring and multi-ring events, since the relative contribution of neutrinos and antineutrinos to these two data sets is different.
-
–
in the channel we observe a characteristic structure of peaks and deeps, which in principle can be used to obtain information on the mass hierarchy. However, due to the fast alternation of positive and negative regions a very good resolution on both neutrino energy and direction is needed, otherwise the signal averages to zero and all information is lost. Furthermore, the position of the structures is affected also by other oscillation parameters, so that a poor knowledge of these parameters will result in a considerable loss of sensitivity. Note that this signature is also present for , however it is strongly suppressed and hardly detectable.
In brief, atmospheric neutrino data can provide useful information on the neutrino mass hierarchy, but only if is sufficiently large and a detector with good resolution and charge discrimination capability is available.
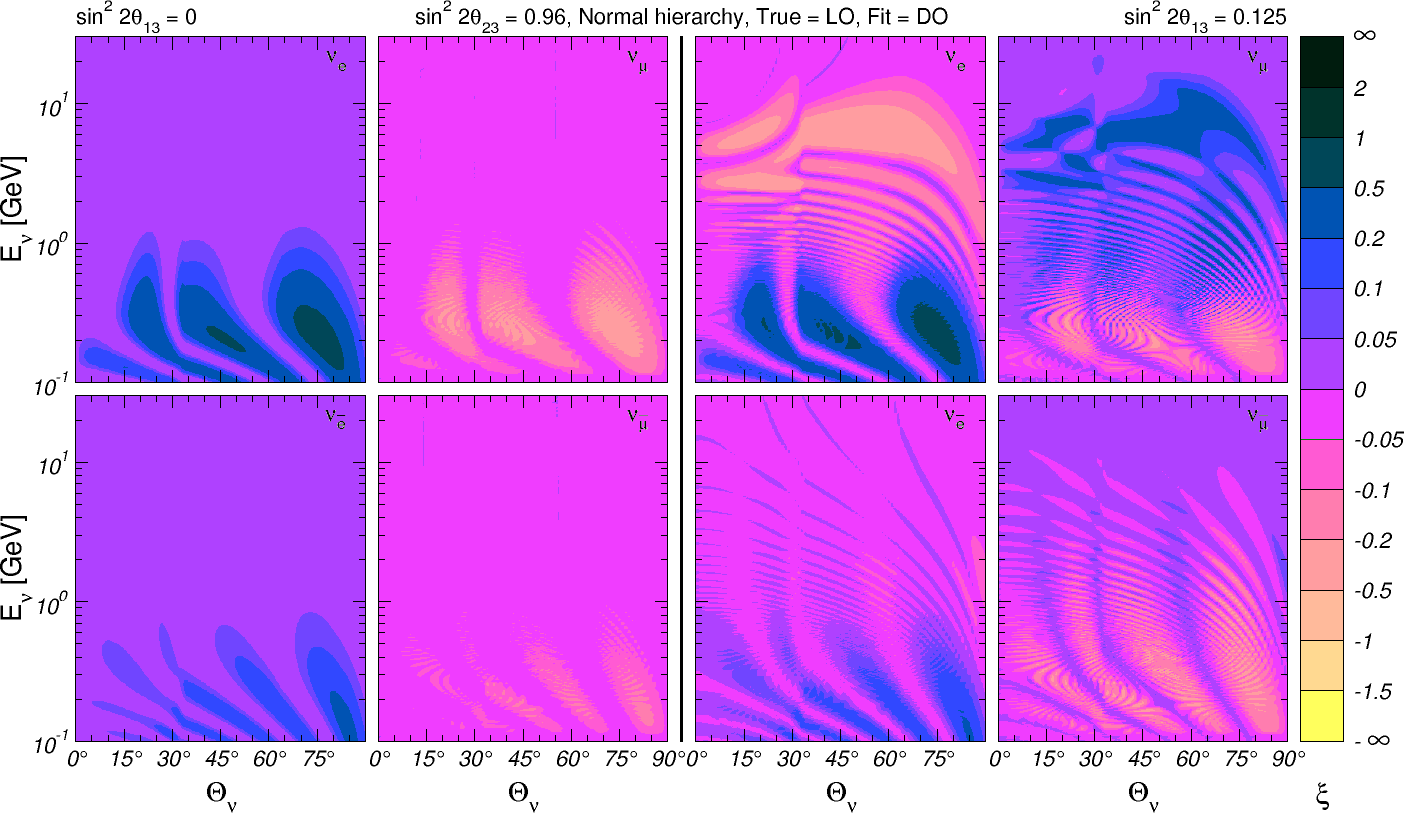
The sensitivity to the octant is one of the topics where atmospheric neutrino are mostly useful. As can be seen in Fig. 2, we have two characteristic signatures:
-
–
at low energy ( GeV) we observe an excess of -like events and a deficit of -like events for with respect to . The signal is about four times larger than the one [3]. This effect is due to subleading oscillations induced by , and is present also for . For the neutrino flux arriving at the detector is modulated with the very fast oscillations, but the effect persists on average. Since this signature appears with the same sign for neutrinos and antineutrinos, no charge discrimination is required for its identification.
-
–
at high energy ( GeV) we observe a deficit of -like events and an excess of -like events for with respect to . This effect is again related to the matter resonance discussed for and the hierarchy, and indeed it appears only for and only for ’s or ’s. Therefore, in a detector without charge discrimination this signal will be suppressed.
Note that the presence of a low-energy effect independent of guarantees a minimum sensitivity to the octant from atmospheric neutrinos, provided that the deviation of from maximal mixing is large enough. This is a unique feature which will prove very synergic with long-baseline data, as we will show in the next section.
3 Synergies with long-baseline experiments
So far we have discussed the potentialities of atmospheric neutrinos in general terms. Let us now consider three concrete experimental setups [4]:
-
–
a Beta Beam (B) from CERN to Fréjus (130 Km). We assume 5 years of from 18Ne and 5 years of from 6He at , with an average energy MeV. For the detector we assume the MEMPHYS Water-Cerenkov proposal, corresponding to 3 tanks of 145 Kton each;
-
–
a Super Beam (SPL) from CERN to Fréjus (130 Km). We assume 2 years of and 8 years of running, with an average energy MeV. Again we use MEMPHYS as detector;
-
–
the T2K phase II (T2HK) experiment, corresponding to a 4MW super beam from Tokai to Kamioka (295 Km), with 2 years of and 8 years of . The detector is the proposed Hyper-Kamiokande, rescaled to 440 Kton for a fair comparison with the B and the SPL.
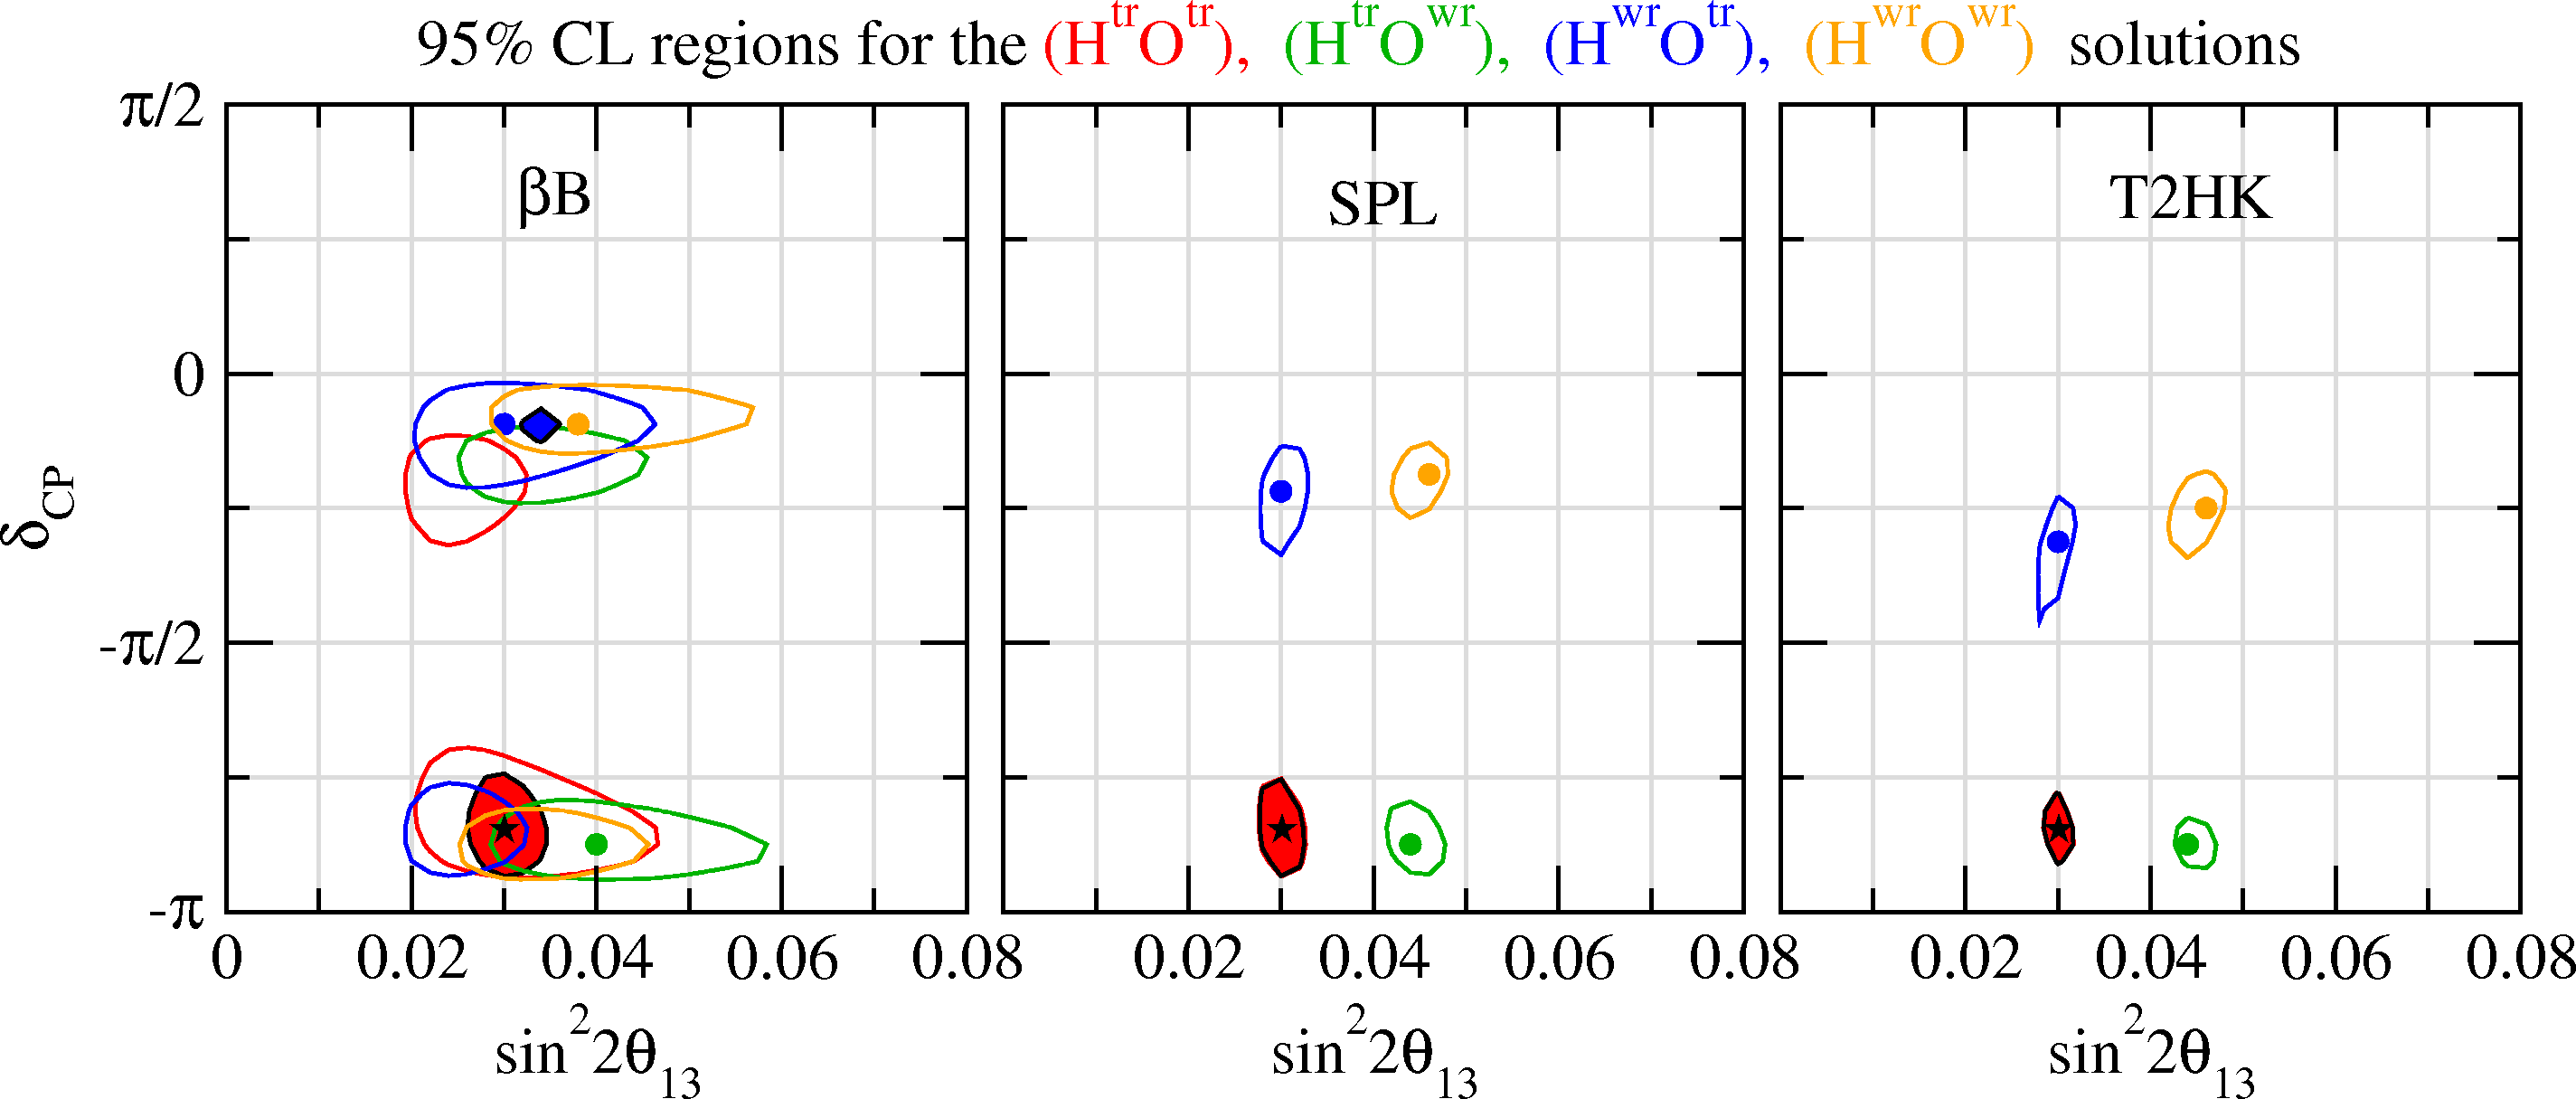
As widely discussed at this conference, a characteristic feature in the analysis of future LBL experiments is the presence of parameter degeneracies, which pose a serious limitation to the determination of , and the sign of . This problem is illustrated in Fig. 3, where we show the allowed regions in the plane of and for B, SPL and T2HK. As visible in this figure, for the B the intrinsic degeneracy cannot be resolved, while for the super beam experiments SPL and T2HK there is only a four-fold degeneracy related to the sign of and the octant of . Once atmospheric data are included in the fit all the degeneracies are nearly completely resolved, and the true solution is identified at 95% CL. This clearly show the presence of a synergy between atmospheric and long-baseline data: at least for this specific example, the combination of the two sets is much more powerful than the simple sum of each individual data sample.
4 Conclusions
In this talk we have discussed the potentialities of atmospheric neutrino data in the context of future neutrino experiments. We have shown that despite the large uncertainties in the neutrino fluxes atmospheric data will still provide useful information on the neutrino parameters, due to their very broad range in neutrino energy and nadir angle. In particular, we have proved that the sensitivity obtained by a combination of atmospheric and long-baseline data is much stronger than the one achievable by each data set separately.
Work supported by MICINN through the Ramón y Cajal program and through the national project FPA2006-01105, and by the Comunidad Autónoma de Madrid through the HEPHACOS project P-ESP-00346.
References
- [1] E. Kh. Akhmedov, M. Maltoni and A. Yu. Smirnov, 1-3 leptonic mixing and the neutrino oscillograms of the Earth, JHEP 05 (2007) 077 [hep-ph/0612285].
- [2] E. Kh. Akhmedov, M. Maltoni and A. Yu. Smirnov, Neutrino oscillograms of the Earth: effects of 1-2 mixing and CP-violation, JHEP 06 (2008) 072 [arXiv:0804.1466].
- [3] M. C. Gonzalez-Garcia, M. Maltoni and A. Yu. Smirnov, Measuring the deviation of the 2-3 lepton mixing from maximal with atmospheric neutrinos, Phys. Rev. D 70 (2004) 093005 [hep-ph/0408170].
- [4] J. E. Campagne, M. Maltoni, M. Mezzetto and T. Schwetz, Physics potential of the CERN-MEMPHYS neutrino oscillation project, JHEP 04 (2007) 003 [hep-ph/0603172].