Multi-particle correlation function to study short-lived nuclei
Abstract
Unstable 10C nuclei are produced as quasi-projectiles in 12C+24Mg collisions at E/A = 53 and 95 MeV. The decay of their short-lived states is studied with the INDRA multidetector array via multi-particle correlation functions. The obtained results show that heavy-ion collisions can be used as a tool to access spectroscopic information of unbound states in exotic nuclei, such as their energies and the relative importance of different sequential decay widths.
keywords:
Multi-particle correlation functions , Sequential decays , Unbound nucleiPACS:
25.70.Pq , 21.10.-k , 25.70.-zEnergetic heavy-ion collisions have been extensively studied to extract information about the properties of nuclear matter under extreme conditions [1]. These studies have also shown that a large variety of isotopes is produced during the dynamical evolution of the reaction. Some of these isotopes, being far from the valley of stability, live temporarily and decay by particle emission. Their unbound states can then be isolated and studied by means of correlation techniques [2, 3, 4, 5, 6]. As an example, proton-7Be correlation functions have been recently measured in central Xe+Au collisions at E/A=50 MeV [6] to determine the spin of internal unbound states of the astrophysically important 8B nucleus. In this respect, a collision between two heavy ions can be viewed not only as a tool to study nuclear dynamics but also as a laboratory to produce several nuclear species in one single experiment and study their spectroscopic properties. This aspect of heavy-ion collision experiments represents an important perspective to access information about the properties of very exotic nuclei. Among all exotic nuclear species that can be produced in nuclear reactions, 10C can be considered as an especially interesting one [7, 8]. An extended Fermionic molecular dynamics (FMD) approach [9] allows one to describe light nuclei with cluster and halo structures [10]. Within the context of similar approaches, Antisymmetrized molecular dynamics (AMD) calculations predict a molecular structures for the ground state of 10C [11]. Exotic features, such as molecular states and clustering [12, 13, 14, 15, 16, 17, 18, 19, 20], have indeed attracted the interest of a large community and particle correlation analyses have been used to access such features experimentally [14, 15, 16, 17, 18, 19, 20]. However, previous studies of 10C nuclei have hardly reconstructed those states lying above the particle emission threshold of 3.73 MeV [21]. These states decay into a single final configuration constituted by two alpha particles and two protons (2+2). All intermediate states that can be formed starting from the decay of 10C nuclei by charged particle emission (i.e. 2He, 5Li, 6Be, 8Be, 9B) are unstable. Reconstructing the decay paths of these 10C states therefore requires the detection of all intermediate and final particles with high energy and angular resolution. Furthermore, a large solid angle detector coverage is required to completely detect all decay products, due to the excitation energy of these high lying states.
In this article we study 10C nuclei produced as excited quasi-projectiles (QP) in 12C+24Mg peripheral collisions at E/A=53 and 95 MeV. The experimental data are collected with the INDRA multidetector array [22, 23]. By means of three- and four-particle correlation functions we provide experimental evidence of sequential decay modes for excited 10C states through the production of intermediate unstable 9B, 6Be and 8Be nuclei. Exploring the relative contributions of these sequential decay processes to the total decay widths of 10C states provides important spectroscopic information which is relevant to access branching ratios and spins.
In the first section, the experimental setup and the event selection criteria are presented. The multi-particle correlation analysis techniques used to explore sequential decay modes are illustrated in section 2 by selecting the special case of 12C states. The last section of this work is finally devoted to the study of 10C and its unbound states decaying into 2+2 .
1 Experimental setup and event selection
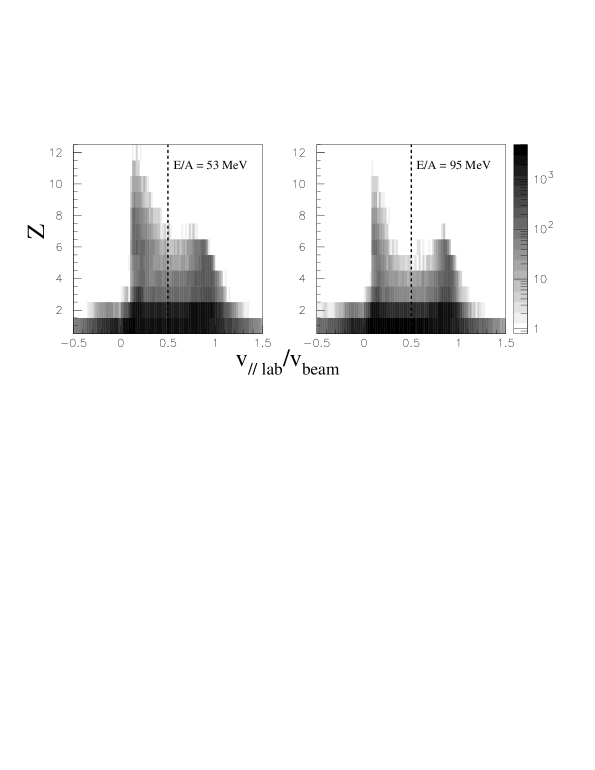
A 2 mg/cm2-thick 24Mg target was bombarded by beams of 12C at E/A=53 and 95 MeV, with an intensity of a few 107 pps, produced by the GANIL cyclotrons. The data presented in this work were collected with the INDRA multidetector array [22, 23]. The data acquisition trigger required an event multiplicity greater than 2. This trigger condition strongly favors peripheral events. Fig. 1 shows the velocity distribution along the beam direction, V//lab/Vbeam (normalized to the velocity of the beam, Vbeam) vs the charge of the detected particles at E/A=53 (left panel) and 95 MeV (right panel). These distributions show that there are two sources of emission of charges Z1 having parallel velocities centered around values of V0.2 Vbeam and V0.9 Vbeam, respectively. In order to select excited Carbon (Z=6) QP breakup events, we take particles with VV2 and we also require that the sum of their charges is equal to six units. Among all the selected channels of Carbon QP breakup, we focus on those corresponding to the 3-alpha decay of 12C∗ (i.e. 12C3) and to the 2-2p decay of 10C∗ (i.e. 10C2+2p). V//lab/Vbeam distributions for Z = 1-2 particles in the selected 12C∗ and 10C∗ breakup events are shown on Fig. 2. The discontinuity at V//lab=V2 is due to the selection criteria. More details about isolating the QP decay products can be found on Refs. [24, 25].
Fig. 3 shows distribution of Ek, defined as the total kinetic energy in the center of mass of the 2-2p (left panels) and 3 (right panels) exit channels. These distributions display several peaks, more pronounced in the case of the 3 exit channel at lower incident energies. The position of these peaks does not depend on the incident energy.
2 Multi-particle correlations
In order to illustrate our analysis techniques, we first study the most peripheral events where excited 12C QP are produced and are reconstructed by detecting three alpha particles with . We define the three-alpha particle correlation function, 1+R(Ek), as
| (1) |
where the correlated yield spectrum, , is constructed with 3 particles detected in the same event. This spectrum is sorted with respect to the quantity Ek, already defined in Fig. 3. If a 12C QP is produced at an excitation energy , it follows that , where is the mass difference in the 12C channel. The uncorrelated yield spectrum, , can be constructed with different techniques. In previous works [5] a dedicated Monte-carlo simulation was used to determine the uncorrelated background of multi-particle configurations. Here we rather use an event-mixing technique [26, 27], where the three uncorrelated alpha particles are taken from three different events. The full dots on Fig. 4 show the resulting 3 correlation function in 12C+24Mg collisions at E/A=53 MeV. The Q-value for the 3 decay of 12C is -7.27 MeV (see the decay scheme of 12C in Refs. [28, 21]). The first peak observed on Fig. 4 at 0.5 MeV corresponds to the 7.65 MeV state in 12C. The second peak, centered at 2.2 MeV, can be associated to the 9.65 MeV state, while the third bump at 6 MeV results from the overlap of highly lying closely packed states.
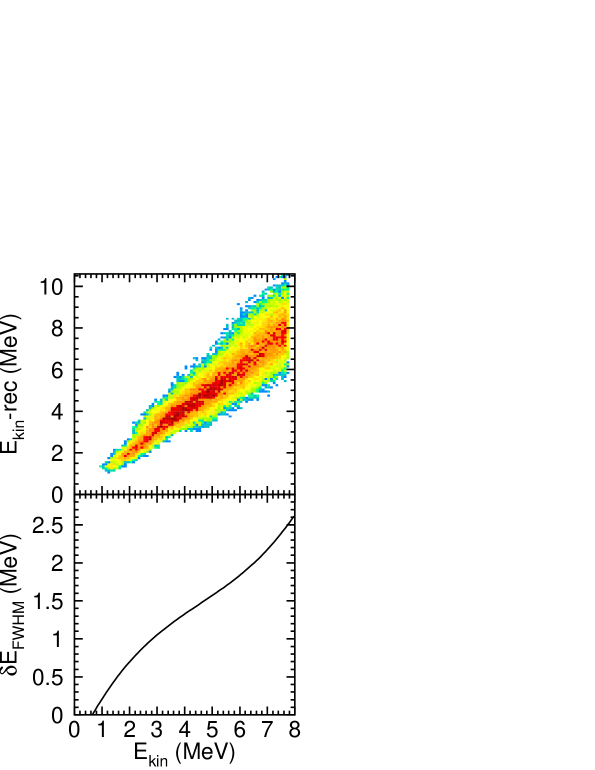
The widths of the observed resonances are much larger than the intrinsic widths of the correspondent 12C states. For example, the FWHM (Full-Width-Half-Maximum) of the state at 9.65 MeV (2.2 MeV) is observed to be about 1.0-1.1 MeV, to be compared to an intrinsic width of 34 keV for this state. This discrepancy is mainly due to the finite angular resolution of the apparatus. We have performed a Monte Carlo simulation in order to estimate the effect of the INDRA detector on the resolution of the reconstructed excited states of 12C decaying into three alpha particles. The excitation energy of 12C was sampled continuously between 0 and 15 MeV. The simulated events were filtered through the geometry and detector response of INDRA. Fig. 5 shows the distribution of the three-body kinetic energy, , as it is recorded by INDRA in the simulation, vs the input kinetic energy, . The average recorded kinetic energy, , is slightly shifted towards higher values as compared to . Also, the width in the distribution increases with increasing . This is best shown on the bottom panel of Fig. 5 displaying the FWHM width of the distribution as a function of . At =2.2 MeV, which corresponds to the 9.65 MeV state, the FWHM is about 1.0 MeV, close enough to the measured one. From this study, it is clear that the position of the resonances is accurate but their widths are not.
Stimulated by the analysis technique described in Ref. [5], we modified the definition of the uncorrelated three particle yields used in the denominator of Eq. 1 by using a partial event mixing (PEM) technique. In particular, the open symbols on Fig. 4 correspond to the correlation function obtained when the denominator is constructed with two particles taken from the same event and the third one from a different event. The resonant peaks are still observed in the correlation function, but with a reduced magnitude. This reduction can be partly attributed to the presence of 2-body correlations associated to sequential decays of 12C. Indeed, the decay of these 12C states can proceed via the emission of 8Be+ pairs, with the very loosely bound 8Be nucleus subsequently decaying into two particles. These second step 8Be decays are included in the numerator of Eq. 1 but not in the denominator, if the latter is evaluated with the standard event mixing technique. In contrast, when the PEM technique is used, two particles in the denominator are still taken from the same event. In this case, some correlations due to secondary 8Be decays are kept in the denominator of Eq. 1. Then, the sequential 8Be decay contributions contained in the numerator of Eq. 1 are partially cancelled out by calculating the ratio, , and the magnitude of the correlation function peaks is reduced. Therefore, the observed attenuation of the peaks magnitude represents, by itself, an indication of the existence of 12C sequential decay, 12CBe+.
In order to test the validity of the method, we construct the correlation function for a case where no resonances are expected. For example, we select the four-body p-d-3He- exit channel events. The 10C quasi-projectile could decay by first emitting 4He and 6Be. The 6Be nuclei is unbound but its states are not expected to decay into p-d-3He[29, 30]. Therefore no peaks are expected in the correlation function. Fig. 6 shows the correlation function for the three particles constructed with the standard event mixing technique (full dots) and the PEM technique (open symbols). All combinations are free of correlations, the correlation functions are flat and average to unity as expected. The enhancement of the correlation function observed at low Ek values is not significant, mostly due to the very low statistics data collected in this low energy region. The observed slight tendency for 1+R(Ek) to be less than unity at E2 MeV is also due to the suppression of the yields of detected events at low Ek values, as it suggested by our Monte Carlo simulations. Difficulties in measuring R(Ek) at low Ek are strongly due to the low angular resolution of INDRA.
3 Multi-particle correlations and 10C excited states
We now turn to the study of 10C states. Fig. 7 shows the four-particle 2-2 correlation function, , constructed by using both the standard (closed symbols) and partial event mixing techniques (open symbols) already described in the case of 3 correlation functions. The top (bottom) panel refers to an incident energy of E/A=53 MeV (E/A=95 MeV). The 2-2 correlation function constructed with the PEM technique (full dots) shows two broad peaks. The Q-value of the 2+2 decay of 10C is -3.7 MeV (see the level scheme of 10C in ref [21, 30]). The first peak at 1.5 MeV can be associated to an overlap of 10C states at E5.2-5.4 and 6.6 MeV. The second peak at 5-5.5 MeV corresponds to unknown states around E9 MeV [31]. The location of these peaks is independent of the beam energy. The PEM explores the following decays sequences: A) 10CB+p with the 9B nucleus further undergoing a decay 9B+p (open crosses); B) 10CBe+ with the 6Be nucleus further decaying into +p+p (open squares); C) 10CBe+p+p with the 8Be nucleus further decaying into + (open circles).
All PEM correlation functions display an attenuation of the peak magnitude. In the case of the states of 10C observed at E5-5.5 MeV, the attenuation obtained with the PEM techniques is less pronounced as compared to the case of the lower lying state at E1.5 MeV. This observation suggests that direct four body decays (2+2) without passing through any intermediate unbound state are more likely for the states around E9 MeV than for the state at E5.2-5.4 MeV. Among the studied sequential decay modes, sequence A induces a peak magnitude attenuation of the order of 30 with respect to its original value (see open crosses). Decay sequences B and C seem to provide comparable contributions to the decay of the studied 10C state, within statistical uncertainties, reducing the peak magnitude to about 35-40 of its original value. A slight systematic preference for the B sequence as compared to the C sequence is observed. In general, for both the first and second group of peaks we observe a preference of 10C to decay through the production of 9B, as compared to a decay proceeding through the 6Be system.
In order to confirm these conclusions about 10C sequential decay modes, we study three-particle coincidence spectra for events with 1 MeV E 3.5 MeV, corresponding to the first peak on Fig. 7. On Fig. 8 (top panels) we show and total kinetic energy spectra, , where the total kinetic energy, , is calculated in the three-body reference frame. In particular, we choose the slowest () or the fastest () proton in the 10C reference frame. Similar spectra are constructed using the and coincidences (bottom panels on Fig. 8), where and particles are chosen using the same criteria as and . These spectra of Fig. 8 are expected to contain information about possible intermediate states in 9B and 6Be nuclei produced during 10C decay sequences A and B described above. If 10C∗ did not decay through a definite sequence, the distributions would show no signatures of nuclear resonant decays. In contrast, we observe a peak at 0.2 MeV in the spectrum, corresponding to the decay of 9Bg.s. (decay sequence A), and a peak at 1.4 MeV in the spectrum, corresponding to the decay of 6Beg.s. (decay sequence B). In the spectra and (right panels on Fig. 8) we observe broad peaks possibly associated to the decay of higher 9B and 6Be excited states. These observations seem to confirm our conclusions deduced from the PEM analysis shown on Fig. 7. The results obtained with our analysis techniques provide an experimental evidence of sequential decay modes of unbound states of 10C exotic nuclei. Furthermore, our estimates of contributions from these different sequential modes have been recently confirmed by a dedicated experiment performed with a high resolution detector array and by using a different analysis techniques [7].
In conclusion, the existence of sequential decay modes of 10C states proceeding through the production of intermediate loosely bound 6Be, 8Be and 9B nuclei has been explored. The analysis method, based on pure and modified event mixing techniques, has the advantage of not containing possible model-dependencies induced by the use of user-constructed simulations to build the uncorrelated background. Furthermore, the modified event mixing techniques allow us to semi-quantitatively estimate the relative contributions from different decay channels. A preference for a decay path producing unstable 9B nuclei is found for the states at 5.2-5.4 MeV in 10C. The obtained results are also in good agreement with those extracted with high resolution experiments [7]. Our results confirm that heavy-ion collisions at intermediate energies can be used as a spectroscopic tool to access simultaneously important spectroscopic properties of several unstable nuclei all produced in one single collision. This perspective encourages an extension of similar studies to collisions induced by radioactive beams where more exotic nuclear species are expected to be produced.
4 Acknowledgments
We thank the staff of the GANIL Accelerator facility for their support during the experiment. This work was supported by four France institutions : Le Commissariat à l’Energie Atomique, Le Centre National de la Recherche Scientifique, Le Ministère de l’Education Nationale, and le Conseil Régional de Basse Normandie. This work was also supported by the Natural Sciences and Engineering Research Council of Canada, the Fonds pour la Formation de Chercheurs et l’Aide à la Recherche du Québec.
References
- [1] WCI, Eur. Phys. J. A 30 (2006) 1.
- [2] R. Hanbury et al., Nature 170 (1952) 1061.
- [3] R. Hanbury and R.Q. Twiss, Nature 178 (1956) 1046.
- [4] S. Koonin, Phys. Lett. B 70 (1977) 43.
- [5] R. Charity et al., Phys. Rev. C 52 (1995) 3126.
- [6] W. Tan et al., Phys. Rev. C 69 (2004) 061304.
- [7] R. Charity et al., Phys. Rev. C 75 (2007) 051304(R).
- [8] N. Curtis et al., Phys. Rev. C 77 (2008) 021301(R).
- [9] H. Feldmeier, Nucl. Phys. A 515 (1990) 147.
- [10] H. F. T. Nif, Nucl. Phys. A 738 (2004) 357.
- [11] Y. Kanada-En’yo and H. Horiuchi, Phys. Rev. C 55 (1997) 2860.
- [12] R. J. Charity et al., Nucl. Phys. A 476 (1988) 516.
- [13] R. J. Charity et al., Nucl. Phys. A 483 (1988) 371.
- [14] A. H. Wuosmaa et al., Phys. Rev. Lett. 68 (1992) 1295.
- [15] A. Di Pietro et al., Phys. Rev. C 59 (1999) 1185.
- [16] T. Yamagata et al., Phys. Rev. C 71 (2005) 064316.
- [17] M. Freer et al., Phys. Rev. Lett. 82 (1999) 1383.
- [18] M. Freer et al., Phys. Rev. C 63 (2001) 034301.
- [19] M. Freer et al., Phys. Rev. Lett. 96 (2006) 042501.
- [20] W. von Oertzen, M. Freer and Y. Kanada-En’yo., Phys. Rep. 432 (2006) 43.
- [21] D. Tilley et al., Nucl. Phys. A 745 (2004) 155.
- [22] J. Pouthas et al., Nucl. Instr. and Meth. A 357 (1995) 418.
- [23] J. Pouthas et al., Nucl. Instr. and Meth. A 369 (1996) 222.
- [24] F.Grenier, PhD Thesis, http://bromley.phy.ulaval.ca/personnel/fgrenier/these_final.pdf.
- [25] A. Chbihi et al., International Workshop on Multifragmentation and related topics, IWM2005, edited by R. Bougault, A. Pagano, S. Pirrone, M.F. Rivet and F. Rizzo (2005) 91.
- [26] W. Zajc et al., Phys. Rev. C 29 (1984) 2173.
- [27] D. Drijard et al., Nucl. Instr. and Meth. A 225 (1984) 367.
- [28] F. Ajzenberg-Selove, Nucl. Phys. A 506 (1990) 1.
- [29] D. Tilley et al., Nucl. Phys. A 541 (1992) 1.
- [30] D. Tilley et al., Nucl. Phys. A 708 (2002) 3.
- [31] L. Wang et al., Phys. Rev. C 47 (1993) 2123.