Physical Properties of Main-Belt Comet P/2005 U1 (Read) 111 Some of the data presented herein were obtained at the W. M. Keck Observatory, which is operated as a scientific partnership among the California Institute of Technology, the University of California, and the National Aeronautics and Space Administration. The Observatory was made possible by the generous financial support of the W. M. Keck Foundation. Additionally, some data were obtained at the Gemini Observatory, which is operated by the Association of Universities for Research in Astronomy, Inc., under a cooperative agreement with the NSF on behalf of the Gemini partnership.
Abstract
The main-belt comets occupy dynamically asteroidal orbits in the main asteroid belt. Here we present physical observations of the second-known member of this population, P/2005 U1 (Read), which showed vigorous cometary activity from 2005 October 24 to 2005 December 27. Monte Carlo numerical simulations of P/Read’s dust emission indicate that the coma and tail are optically dominated by dust particles larger than 10 m in size with terminal ejection velocities of 0.2 to 3 m s-1. We estimate P/Read’s mass loss rate during this period to be approximately 0.2 kg s-1, roughly an order of magnitude larger than that calculated for 133P/Elst-Pizarro. We also find that emission likely began at least two months prior to P/Read’s discovery, though we note this is a lower limit and that earlier start times are possible. Optical colors measured for P/Read while it was active are approximately solar (, , ) but are likely to be dominated by coma particles. Observations of P/Read in 2007 when it appears largely inactive show an extremely small nucleus with an absolute magnitude of , corresponding to an effective radius of km. P/Read’s activity is consistent with sublimation-driven dust emission and inconsistent with dust emission due to an impact, though the unusual strength of the 2005 outburst suggests the possibility that it could have been due to the sublimation of a freshly-exposed reservoir of volatile material.
1 INTRODUCTION
Discovered on UT 2005 October 24 (Read et al., 2005), P/2005 U1 (Read) (hereafter P/Read) occupies an orbit in the main asteroid belt ( AU, , ). It has a Tisserand parameter (with respect to Jupiter) of , while classical comets have (Vaghi, 1973; Kresák, 1980). The orbit of this comet is decoupled from Jupiter and is indistinguishable from the orbits of ordinary main-belt asteroids, making it the second-known member of the recently-identified population of main-belt comets (MBCs; Hsieh & Jewitt, 2006b).
Three MBCs are currently known — P/Read, 133P/Elst-Pizarro (also 7968 = 1999 N2; hereafter 133P), and 176P/LINEAR (also 118401 = 1999 RE70; hereafter 176P). Discovered from limited observational data, these three objects imply a true population of perhaps 150 currently active MBCs and likely many more dormant MBCs (Hsieh & Jewitt, 2006b). Like P/Read, 133P and 176P also have , indicating that they are likewise dynamically decoupled from Jupiter.
While does not assure long-term dynamical stability, it nonetheless strongly suggests that the three MBCs are at least dynamically stable on their current orbits on timescales much longer than those of other comets, and are not likely to be recent arrivals from the outer solar system (i.e., from the Kuiper Belt or Oort Cloud). This implication is further supported by numerical simulations (e.g. Ipatov & Hahn, 1997; Fernández et al., 2002; Levison et al., 2006) which show that the dynamical transition of comets from the outer solar system onto main belt orbits should occur extremely infrequently, if at all, given the current orbital configuration of the major planets. The difficulty of executing such a transition coupled with the likely abundance of MBCs instead suggests that these objects are native members of the main asteroid belt, not interlopers recently captured from elsewhere. Finally, recent thermal models show that subsurface ice on main-belt asteroids at the heliocentric distance of the three MBCs can in fact survive over billion-year timescales if protected from direct sunlight by a dusty surface layer only a few meters in thickness (Schörghofer, 2008). Such evidence suggests that ice could be widespread in the main belt, though so far, actual cometary activity has only been observed in the three currently-known MBCs. Here, in an effort to shed further light on the nature of these puzzling objects, we present new physical observations of P/Read.
2 OBSERVATIONS
Observations of P/Read were made in near-photometric conditions on multiple nights in 2005 and 2007 (Table 1) using the University of Hawaii (UH) 2.2 m telescope, the 8 m Gemini North telescope, and the 10 m Keck I telescope, all on Mauna Kea. Observations with the UH 2.2 m telescope were made using a Tektronix 20482048 pixel CCD (image scale of pixel-1) behind standard Kron-Cousins BVRI broadband filters. Gemini observations were made using the Gemini Multi-Object Spectrograph (GMOS; Hook et al., 2004) (image scale of pixel-1 while using 2x2 binning) behind filters (Fukugita et al., 1996). Observations with Keck were made using the red side of the Low Resolution Imaging Spectrometer (LRIS; Oke et al., 1995) in imaging mode. The red side of LRIS employs a Tektronix CCD with an image scale of pixel-1 and standard Kron-Cousins BVRI filters.
Standard image preparation (bias subtraction and flat-field reduction) was performed. For data from the UH 2.2 m and Gemini telescopes, flat fields were constructed from dithered images of the twilight sky, while images of the illuminated interior of the Keck I dome were used to construct flat field images for Keck data. Photometry of Landolt (1992) standard stars and field stars was obtained by measuring net fluxes within circular apertures, with background sampled from surrounding circular annuli. Comet photometry was performed using circular apertures of different radii (ranging from to ) but, to avoid the contaminating effects of the coma, background sky statistics were measured manually in regions of blank sky near, but not adjacent, to the object. Several (5 to 10) field stars in the comet images were also measured and used to correct for extinction variation during each night.
3 RESULTS
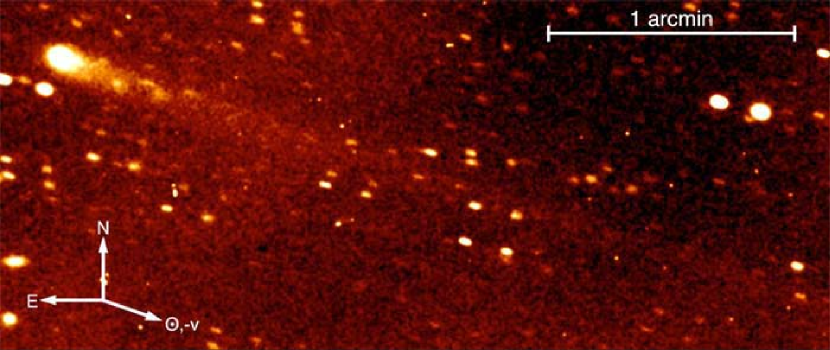
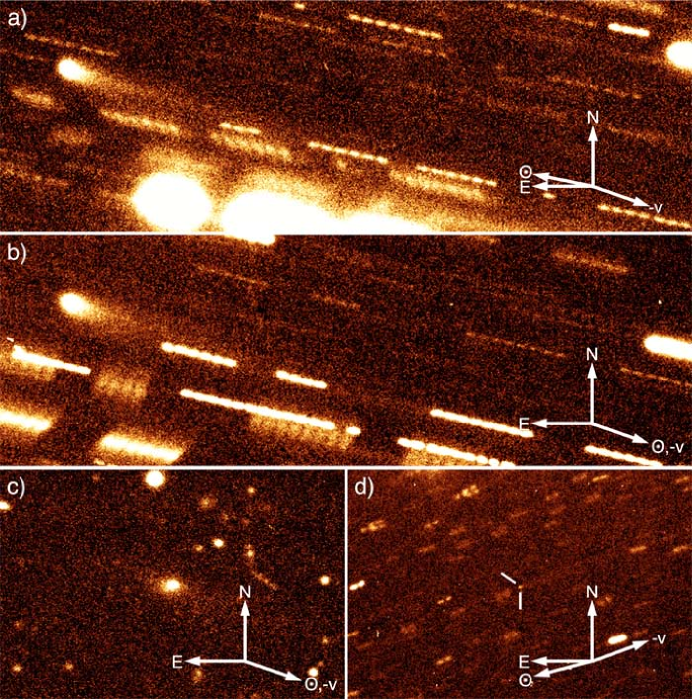
P/Read was unambiguously active each time it was observed in 2005 (Figures 1, 2a, 2b, and 2c). No unambiguous activity was apparent when it was observed again in 2007 (Figure 2d), though its faintness at the time makes a rigorous assessment of its activity level difficult. Composite images constructed from individual -band images (aligned on P/Read’s photocenter using linear interpolation) obtained on UT 2005 November 26 using the Gemini North telescope (Figure 1) and individual -band images obtained on UT 2005 November 10, 2005 November 19, and 2005 December 24 using the UH 2.2 m telescope (Figures 2a, 2b, and 2c, respectively) all show P/Read possessing a strong coma and dust tail closely aligned with the plane of its orbit as projected on the sky. This dust tail is seen in our data from November 26 to extend at least 3 arcmin before reaching the edge of our detector’s field of view, and points primarily to the southwest throughout the month of November 2005. This corresponds to the antisolar direction on November 10, but for November 19-22 and November 26, corresponds to the projected direction towards the Sun (see Table 1). By December 24 and 25, portions of P/Read’s tail are seen to be projected in both the solar and antisolar directions. These changes in the appearance of P/Read’s dust tail during these observations provide useful constraints on dust ejection models (Section 4).
The coma that enveloped the nucleus of P/Read during the majority of our observations makes it difficult to ascertain various physical properties of interest. For example, we searched for evidence of rotational brightness modulation from time-series -band photometry over several nights using a phase dispersion minimization algorithm (Stellingwerf, 1978). We find candidate periods of 14.20 hr and 17.82 hr, and secondary candidate periods of 7.32 hr, 8.06 hr, and 10.29 hr. None of these solutions, however, produces a coherent lightcurve when used to phase the photometry. We attribute this to the dilution of the light from the nucleus by light scattered from near-nucleus dust, to the sensitivity of measured coma magnitudes to the seeing, and to the variation of that seeing from night to night and often even between consecutive exposures. We therefore regard our attempt to discern P/Read’s rotational period as unsuccessful. Detailed follow-up observations and analysis at a future time when P/Read is observed to be inactive would be useful.
From multi-filter photometry on several nights, we find mean colors of , , and . These are comparable to solar colors as well as to the colors of other active comets, inactive comet nuclei, and the nearly bare nucleus of the first known MBC, 133P (Table 2). P/Read’s colors are also consistent with those of C-type asteroids which dominate the Themis family (Florczak et al., 1999) in which the other two MBCs (133P and 176P) are found. Color measurements remain largely constant with increasing aperture radii (and therefore increasing coma contribution) up to , however, indicating that measurements at all radii are likely dominated by coma particles.
To examine the non-stellar nature of P/Read, we construct normalized radial surface brightness profiles for P/Read (Figure 3) from the composite images shown in Figures 1 and 2 (excluding the image shown in Figure 2d in which the object is too faint for this level of analysis) and compare them to similarly-constructed profiles of field stars from sidereally-tracked images taken on the same night at similar airmasses. The comparison of non-simultaneous data is not ideal but unavoidable as all observations of P/Read were conducted using non-sidereal tracking on each telescope to follow the comet, causing field stars to appear trailed and therefore unsuitable for radial profile analysis. As can be seen in Figure 3, while nightly seeing differences cause fluctuations in the profiles of our comparison stars, the overall shape of P/Read’s coma profile remains essentially constant in November, exhibiting minimal sensitivity to nightly seeing variations and changes in viewing geometry (e.g., solar phase angle), while flattening slightly in December as the activity apparently weakens.
In order to estimate the size of P/Read’s nucleus, we scale the peak brightnesses of several sidereally-tracked field stars to that of a stacked image of P/Read from UT 2005 Nov 10, measure the flux contained within apertures centered on the photocenters of the field stars and P/Read, and assume that the excess present in the broader profile of P/Read is due to coma. Using this procedure, we estimate that the comet’s nucleus contributes approximately 40% of the total brightness measured within an aperture in radius. This gives an approximate nucleus magnitude of , or an absolute magnitude of , where the solar phase angle, , is close to zero at the time of the observations, obviating the need to assume a phase-darkening function. Then, using
| (1) |
(Russell, 1916), where is the geometric -band albedo and mag (Hardorp, 1980; Hartmann et al., 1982, 1990) is the apparent solar -band magnitude, we estimate an effective nucleus radius of km. Using an identical analysis for the dust component, we obtain a cumulative absolute magnitude of for the dust contained within a aperture (4200 km in the plane of the sky at the distance of P/Read), corresponding to a total geometric scattering cross-section of km2, assuming an optically thin coma. Ignoring opposition surge effects (on which we currently possess no useful constraints), we derive an approximate total mass of visible dust within our aperture of kg, assuming a bulk grain density of kg m-3 and an average grain size of m.
This crude method of estimating the contribution of the nucleus to the total measured flux of a comet possessing a strong coma has its deficiencies, of course. The computed contribution of P/Read’s nucleus to the comet’s total measured brightness derived using this method is affected by several complicating factors such as variations in seeing conditions between the times when comet images are obtained to the times when template stars are observed, and the unknown (but certainly non-zero) contribution of the coma to the central pixel of the comet (meaning that by scaling field stars to this central brightness, we are already overestimating the true nucleus contribution). Nonetheless, this analysis produces relatively consistent results when applied to data obtained on other nights in 2005, giving absolute magnitudes for P/Read’s nucleus of on UT 2005 Nov 19, on UT 2005 Dec 24, and on UT 2005 Dec 25 (assuming a linear phase function with a phase-darkening coefficient of 0.035), corresponding to an effective nucleus size of km (assuming an albedo of ). As with P/Read’s rotational period, however, a definitive nucleus size can only really be expected from observations of P/Read while it is inactive.
We obtained just such observations with the 10 m Keck I telescope in 2007 Jan 27 when P/Read was almost 1 AU farther from the Sun, and presumably far less active. No evidence of a coma is seen in these observations, though the faintness of the nucleus makes the existence of a coma difficult to definitively rule out. We measure an apparent -band magnitude for the nucleus of (Table 1). Assuming a phase-darkening coefficient of 0.035, this corresponds to an absolute magnitude of and an effective nucleus radius of 0.3 km, significantly smaller than our previous nucleus size estimate. Working backwards, we find that a nucleus of this size would have constituted only 4% of the total flux measured for an active P/Read on 2005 Nov 10 instead of 40% as determined from our analysis of the coma’s surface brightness profile at the time. The size of the disparity between these nucleus size estimates hints that it may be due to more than just measurement uncertainties. We discuss possible explanations for this discrepancy in Section 5.
4 DUST CLOUD MODELING
In order to obtain a more quantitative picture of P/Read’s activity, we numerically model its dust emission. We acknowledge from the outset that our model is unavoidably underconstrained and that any results will be far from exact analytical descriptions of the comet’s dust emission. However, our objective is to simply place constraints on certain key properties such as grain size distribution, ejection velocities, and the temporal nature of the emission. As such, our modeling strategy is formulated to focus on these key properties, while omitting unconstrained second-order parameters (e.g., the number, location, and directionality of jets, or the rate and orientation of nucleus rotation) and incorporating other assumptions in the interest of simplifying both computation and interpretation of results.
The trajectory of a dust particle of radius, , largely depends on the ratio, , of the particle’s acceleration due to solar radiation pressure to its acceleration due to gravity, and on ejection velocity, (Finson & Probstein, 1968). Syndyne curves are lines representing constant values of when the ejection velocity is assumed to be zero, whereas synchrone curves are lines representing particles ejected at the same time and having a range of values. Together, syndyne and synchrone curves are often used to determine the range of values, which is related to the range of particle sizes, of ejected dust from comets. Since P/Read’s low inclination means that it is always found close to the ecliptic plane, where syndynes tend to overlap, it is difficult to discern particle sizes from syndyne-synchrone analyses. In addition, even in high-inclination cases, syndyne-synchrone analyses can result in misleading values (Fulle, 2004). Analysis allowing for non-zero ejection velocities is essential for estimating the particle sizes of the dust emitted by P/Read (cf. Ishiguro et al., 2007).
We assume that dust particles are ejected in cone-shaped jets that are radially symmetric with respect to the Sun-comet axis with a half-opening angle, . The terminal velocity, , of the ejected dust particles can be estimated from
| (2) |
where is the ratio of solar radiation pressure to the gravitational force on a particle, is the heliocentric distance, is the reference ejection velocity in m s-1 of particles with at AU, and and are the power indices of the reference ejection velocity dependence on and . We use an exponential size distribution with an index of , and assume that the dependence of dust production rate on heliocentric distance can expressed by a simple exponential function with an index of .
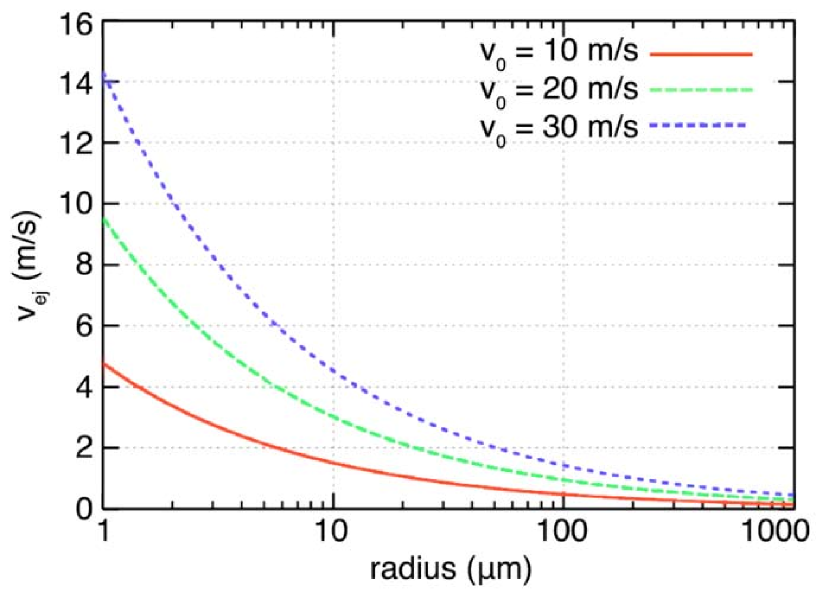
Dust ejection is assumed to begin two aphelion passages prior to the current perihelion passage (i.e., 1.5 orbits ago). This is an assumption made to simplify our initial analysis and is not intended to represent physical reality. In practice, the comet’s coma and tail is dominated by recently-ejected dust, and so emission much earlier in the past has little effect on our final results. Images of model comets are generated by Monte Carlo simulations parameterized by , , , and , and using fixed, typical values for , , , and (, , , and ; cf. Lisse et al., 1998; Reach et al., 2000; Ishiguro et al., 2007; Sarugaku et al., 2007). Using these parameters, and Equation 2, we can compute terminal ejection velocities as functions of particle size at AU where P/Read is located at the time of our observations (Figure 4), and then calculate apparent dust particle positions for a given observing geometry. Pixel intensities, , at given CCD coordinates (,) are then given by
| (3) |
where is the start time of the model simulation, is the time of observation, and are the minimum and maximum particle sizes, respectively, is the -band ( m) solar flux density ( W m) at 1 AU, is the heliocentric distance, is the number of dust particles with size to , and the differential scattering cross-section, , is given by
| (4) |
where is the geometric cross-sectional area of the particle, and is the modified geometric albedo at the phase angle, (Hanner et al., 1981).
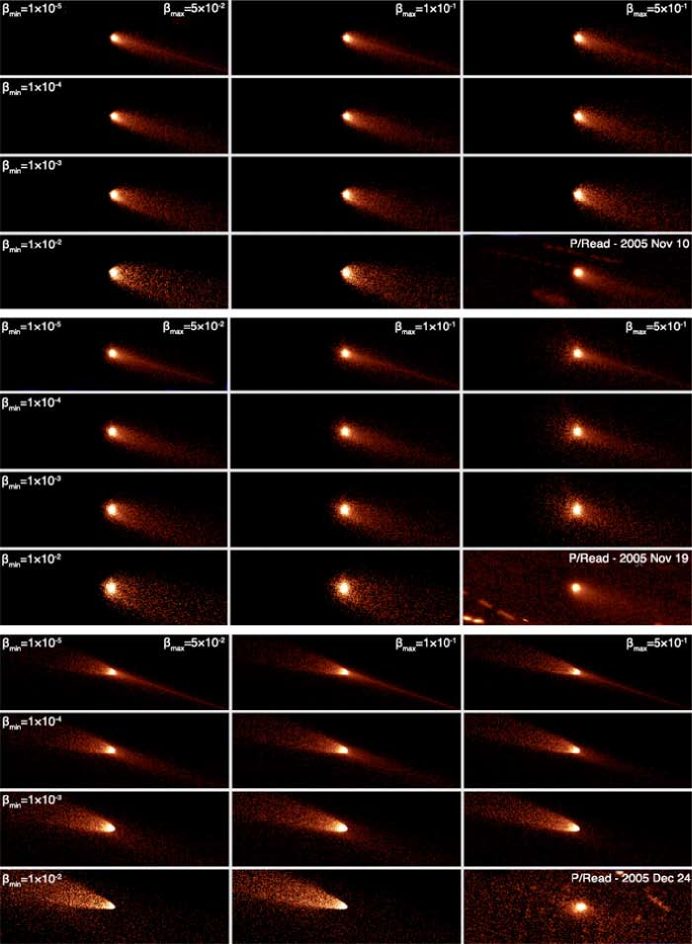
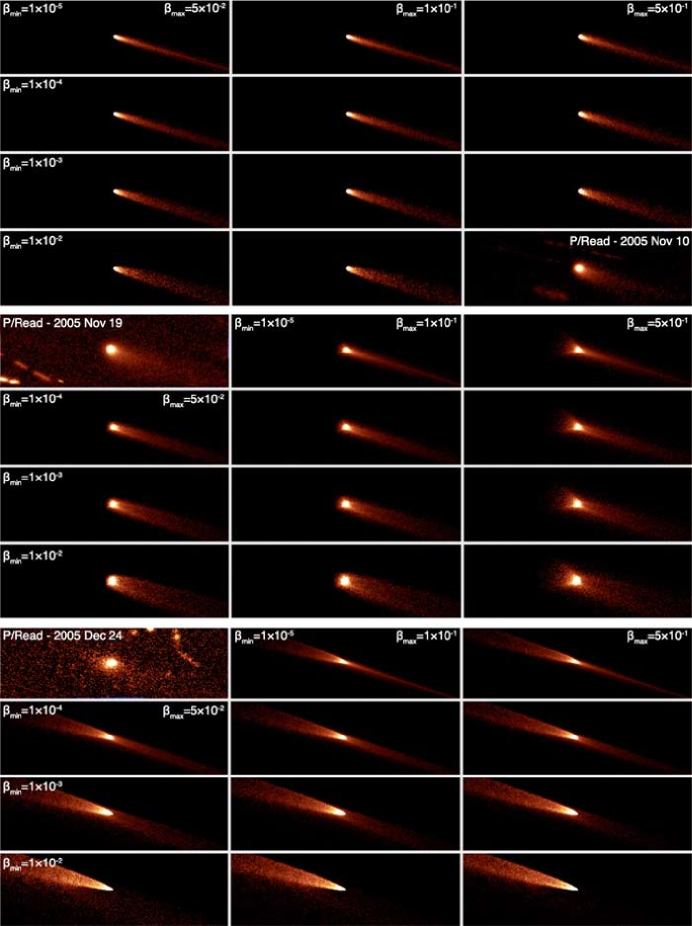
Multiple simulations are carried out using various parameter sets, and the resulting model images are then visually compared to the data to find plausible model parameters. Chi-squared fitting of contour maps of the best visual matches to contour maps of observed data is then used to find the most plausible set of parameters from among our choices of reasonable visual matches. A full list of parameters tested is shown in Table 3. We identify two sets of plausible model parameters. In the first (Figure 5), we find that for m s-1, large particles (, ) give rise to model images that closely match observations. In this case, the given values correspond to terminal ejection velocities of m s-1. In the second set of models (Figure 6), we find that calculations using smaller particles (, ) ejected with a somewhat slower ( m s-1, corresponding to m s-1) also produce reasonable fits to the data. Due to the low inclination of P/Read, we are unable to distinguish between these two cases, but we nonetheless conclude that particle sizes are certainly larger than 10 m and probably larger than 100 m, and terminal ejection velocities are approximately 0.2–3 m s-1. For this range of particle sizes and ejection velocities, we compute an approximate mass loss rate of kg s-1. This mass loss rate is roughly an order of magnitude larger than that calculated for 133P ( kg s-1; Hsieh et al., 2004), consistent with P/Read’s much more active appearance.
The modeling described above assumes continuous dust emission (i.e., in a manner consistent with dust emission driven by the cometary sublimation of volatile material), an assumption based on P/Read’s classical cometary appearance. The fact that this modeling is able to successfully reproduce the observed morphology of P/Read strongly suggests that the observed activity is accurately characterized by continuous dust emission. We can, however, address this presumption directly by examining the longevity of P/Read’s dust emission.
We compute phase-angle-corrected values (A’Hearn et al., 1984, Table 4) for each of our observations from 2005 using
| (5) |
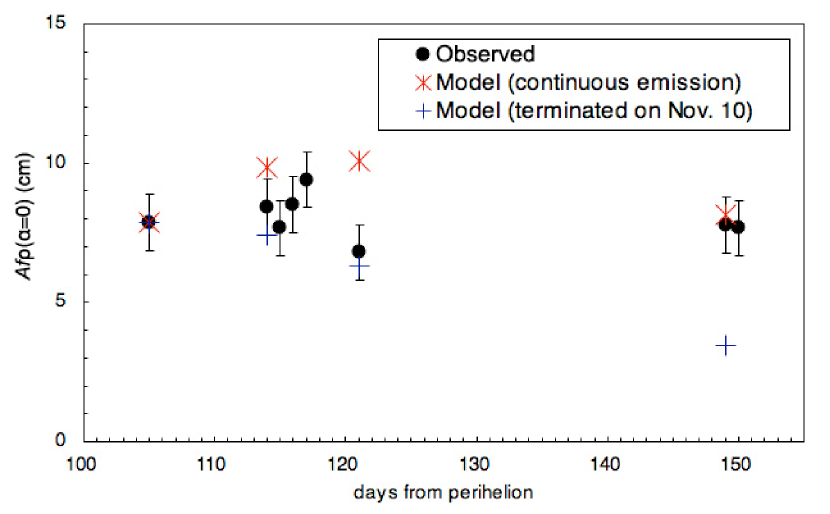
where is in AU, is in cm, is the physical radius in cm of the photometry aperture at the distance of the comet, is the solar -band magnitude, and is the phase-angle-corrected -band magnitude of the comet inside a -radius aperture. We find some fluctuation in measured values but note that the level of activity remains reasonably steady for the entire 1.5 months between 2005 November 10 and 2005 December 25, with an average of 8.0 cm.
To investigate what this roughly constant level of activity implies for P/Read’s emission behavior, we perform a test on our best-fit model where we terminate the dust emission as of 2005 November 10 (the date of our first observation of P/Read). We then repeat the analysis performed for our observed data by computing phase-angle-corrected values for both this truncated emission model and our original continuous emission model on selected dates, normalizing both models to have the same values as the observed data on 2005 November 10. Results of this analysis are tabulated in Table 4 and plotted in Figure 7. As can be seen from the tabulated and plotted data, the activity level of the truncated emission model falls well below the observed data by 2005 December 24. The inconsistency of a truncated emission model with observations indicates that P/Read was likely actively emitting dust throughout our 2005 observations. Such sustained dust emission behavior over a long time period strongly suggests that P/Read’s activity was driven by the sublimation of volatile ices, i.e., that it was cometary in nature.
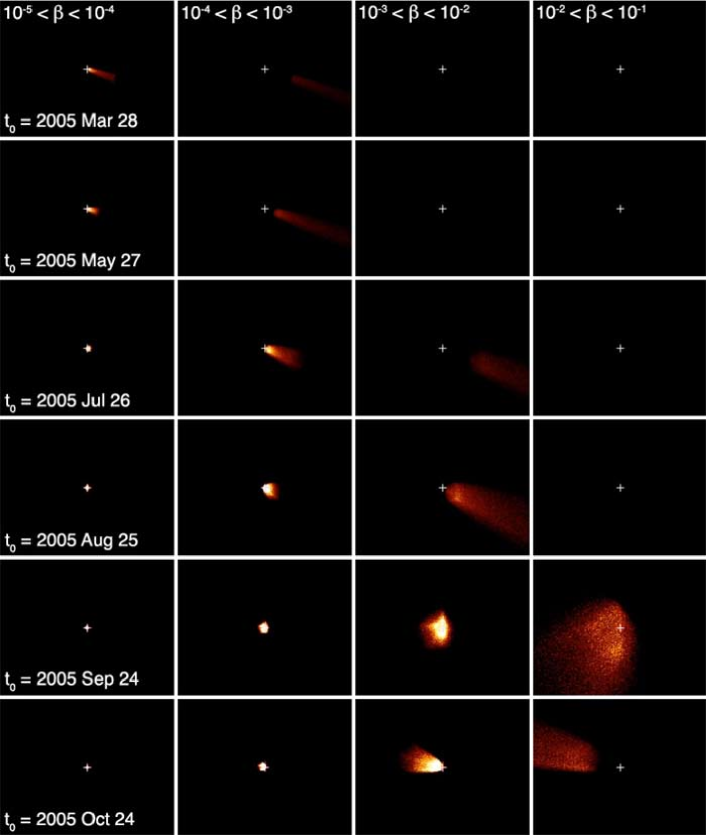
To further validate this conclusion, we investigate whether impulsive dust emission events (such as the formation of an ejecta cloud resulting from the impact of another asteroid on P/Read’s surface) could explain P/Read’s activity. We do so by modeling the release of dust at a single time, , and then simulating the comet’s expected appearance on 2005 December 25 (Figure 8). For this series of models, we hold all parameters fixed except for , , and , varying from 2005 March 28 (272 days prior to the date of observations) to 2005 October 24 (the date of the discovery of P/Read’s activity, and 62 days prior to our December observations), and varying value ranges from to . We find that, regardless of particle size, dust emitted in a single impulsive event tends to appear on only one side of the nucleus when observed on 2005 December 25, with dust emitted on 2005 August 25 or earlier forming a fan-shaped tail directed to the southwest and dust emitted on 2005 October 24 forming a tail directed to the northeast. An exception is emission on 2005 September 24 which results in a dust tail aligned very closely to the line of sight on 2005 December 25, thus appearing as a nearly-circular cloud superimposed on the nucleus and slightly offset to the southeast.
Our observations on 2005 December 25 show dust features extending both to the northeast and southwest of the nucleus (Figure 2c). Based on the results of our impulsive emission tests, we therefore conclude that the northeast extension of P/Read’s dust cloud must be due to particles ejected after September 2005, while the southwest dust feature must be due to particles ejected prior to September 2005. Interestingly, since our models show that particles with emitted at this time will have dispersed well beyond the nucleus by 2005 December 25, the observed southwest extension must actually be composed only of larger particles (). Our main finding, however, is that no single impulsive emission event can simultaneously produce dust features extending in both directions. At least one emission episode from both time periods is necessary to account for P/Read’s observed December morphology. Given the implausibility of two separate impact-triggered emission events in such short succession, continuous emission over several weeks between August and October 2005 is the most likely explanation for the bi-directional nature of P/Read’s cometary activity as observed in December 2005. As the most plausible explanation for continuous emission is sublimation-driven dust ejection, we therefore conclude that P/Read’s activity is in fact cometary in nature.
Finally, our modeling of P/Read’s appearance on 2005 December 25 has the added benefit of providing us with our best constraint on the start time of the dust emission. In November 2005, dust emitted from P/Read extends exclusively to the southwest, leaving the observed tail length as our only constraint. Our best detection of the dust tail was obtained on 2005 November 26 when we observed the tail extending as far as 3 arcmin from the nucleus before it reached the edge of our detector’s field of view. For the fastest, smallest particles emitted by P/Read (), a tail of that length can be produced in approximately 50 days, constraining the emission start time to 2005 October 7 (or earlier), or slightly more than two weeks prior to its discovery on 2005 October 24. Our December 2005 data gives us a much stronger constraint, however, given that our modeling demonstrates that dust particles of any size extending to the southwest must have been emitted at least 120 days prior to observations, or around 2005 August 26 (cf. Figure 8). Unfortunately, it is not possible to identify an upper limit to the total elapsed emission time for P/Read, as small particles with very early emission times simply become too diffuse to detect by the time of our observations, while large particles with early emission times cannot be distinguished from small particles with later emission times.
5 DISCUSSION
Even though P/Read does not have orbital elements that place it directly within the Themis asteroid family as do 133P’s and 176P’s orbital elements (P/Read’s eccentricity is slightly higher than the general eccentricity range of the Themis family; cf. Table 5), P/Read’s orbital similarity to the other known MBCs is striking. Despite the fact that P/Read was discovered serendipitously, of roughly asteroids tabulated as of 18 August 2008 by the IAU Minor Planet Center, only about 70 (0.02%) have values of , , and as close to 133P as does P/Read. The orbital similarity among all three MBCs suggests that they may be related in origin, either as fragments of the recent break-up of a single icy parent body (which may or may not have been a member of the Themis family), or as fragments of the initial break-up of the Themis parent body ( yrs ago; Marzari et al., 1995). Intriguingly, 133P has in fact been associated with a recent break-up in the asteroid belt that formed the Beagle family which is thought to be 10 Myr old (Nesvorný et al., 2008). This newly-identified family does not include P/Read or 176P (cf. Table 5), however, and in any case, as discussed above, subsurface ice on the MBCs protected by no more than a few meters of dust should be stable over the age of the solar system (Schörghofer, 2008). As such, the existence of MBC ice alone does not require the MBCs to be recently-produced fragments of larger bodies, or even fragments of larger bodies at all. The MBCs could simply be icy but otherwise ordinary outer main-belt asteroids that have been individually collisionally “activated” (cf. 133P; Hsieh et al., 2004).
Dynamical considerations aside, P/Read’s unusually strong activity unequivocally makes it unique among the MBCs. As we argued for 133P, the months-long duration of P/Read’s dust emission is most consistent with the sublimation of volatile ices, suggesting that it is a bona fide comet (Hsieh et al., 2004). Unlike 133P and 176P, however, which never exhibit any significant coma (Hsieh & Jewitt, 2006b), P/Read displays a substantial coma, which is optically dominated by significantly larger particles (m) than those ejected from 133P (m). The estimated terminal ejection velocities ( m s-1) of the dust particles in P/Read’s coma are comparable to those determined for 133P ( m s-1), although the much smaller size of P/Read ( km) means that its escape velocity ( m s-1, assuming a bulk density of kg m-3) is about an order of magnitude smaller than 133P’s escape velocity ( m s-1). This lower escape velocity would permit more particles to escape, perhaps partly explaining P/Read’s much stronger dust emission and large coma particles.
The unusual strength of P/Read’s activity could potentially also be explained if P/Read experiences significantly different temperature conditions from those experienced by 133P and 176P. A much higher perihelion temperature could cause more vigorous sublimation, while a much lower equilibrium temperature over its entire orbit could allow P/Read to preserve significantly more ice than the other MBCs. While P/Read’s slightly higher eccentricity does bring it closer to the Sun at perihelion ( AU) than the other MBCs ( AU; AU), its surface temperature (assuming a thermally-equilibrated graybody) at perihelion is essentially equal to those of the other MBCs ( K, K, and K), meaning that peak surface temperature is unlikely to be a significant factor in explaining P/Read’s unusually vigorous activity. Likewise, P/Read’s only slightly lower equilibrium aphelion surface temperature ( K, K, K) and virtually identical average equilibrium temperature over its entire orbit ( K, K, K) as compared to the other MBCs means that it is unlikely to be significantly more icy than 133P or 176P, particularly considering its much smaller size.
Perhaps the most likely additional explanation for the strength of P/Read’s dust emission could be that the comet was activated much more recently than the other MBCs. In our current model, currently-active MBCs are thought to have been recently activated by impacts that excavated sub-surface reservoirs of volatile ice, exposing them to direct solar heating (Hsieh & Jewitt, 2006b). These impacts only trigger the activity, however, not sustain it. Instead, the dust emission of the MBCs is thought to be driven by the sublimation of these newly-exposed patches of volatile material and primarily modulated by seasonal fluctuations in the solar illumination of the active sites (instead of increases in overall temperature during perihelion passages as with other comets) (Hsieh et al., 2004; Hsieh & Jewitt, 2006a). In this way, a single impact on a body can be responsible for multiple episodes of dust emission lasting several months each time, long after the ejecta from that impact has dissipated. This hypothesis is supported by the behavior of 133P, which has now been observed to show activity on three separate occasions in 1996, 2002, and 2007 (Elst et al., 1996; Hsieh et al., 2004; Jewitt et al., 2007), occupying roughly the same portion of its orbit (the quadrant following perihelion) each time. We note that under this hypothesis, the apparent trend of all three MBCs displaying activity near perihelion is most likely attributable to observational bias, faint activity being much more difficult to detect at larger heliocentric and geocentric distances.
As discussed in Sections 3 and 4, however, P/Read’s estimated mass loss rate is approximately an order of magnitude larger than that estimated for 133P, with P/Read’s dust coma also constituting a far larger percentage of the comet’s total brightness than 133P’s dust trail. The relative weakness of 133P’s activity may reflect the near-depletion of its reserve of volatile material after multiple outbursts, the small size of that reserve in the first place, or a combination of both. Conversely, the more intense activity of P/Read in 2005 could indicate not only the exposure of a larger reservoir of volatile material, but also the more recent excavation of that reservoir, suggesting that we might even be witnessing the immediate aftermath of an activating impact on P/Read. A particularly disruptive impact and exceptionally prodigious mass loss that could be associated with the new exposure of a large volatile reservoir might also explain the surprisingly small nucleus observed in 2007, over a year after P/Read was observed to be active. We caution that no evidence of fragmentation was observed in either 2005 or 2007, but nonetheless, this possibility is an important one to consider, given that unlike 133P’s activity, P/Read’s activity has not yet been shown to be recurrent. We emphasize that numerical models show that an impact is unlikely to be the sole cause of P/Read’s dust emission, suggesting that it is driven by the sublimation of volatile ice. The combination of a triggering impact and the subsequent vigorous sublimation that might be expected from a large, newly-exposed reservoir of volatile material, however, could produce a particularly strong initial burst of activity, but perhaps dramatically weaker future outbursts, if any occur at all.
The key to an improved understanding of P/Read is to determine whether it displays activity similar to its 2005 outburst following its next perihelion passage, or if any recurring activity is significantly diminished in intensity (perhaps to a 133P- or 176P-like level). Future observations to search for renewed dust emission near P/Read’s next perihelion passage on 2011 March 10, and also to assess its levels of activity or inactivity in the months and years prior to this date, will be needed to clarify these issues.
6 SUMMARY
Observations of the main-belt comet P/2005 U1 (Read) were obtained on multiple occasions in 2005 and 2007. Key results are as follows:
-
1.
Using data from 2007 (when P/Read appears to be largely inactive), we find an approximate absolute magnitude of , corresponding to an effective radius of km (for an assumed albedo of ).
-
2.
Monte Carlo numerical simulations of P/Read’s dust emission indicate that the coma and tail are optically dominated by dust particles greater than 10 m, and possibly greater than 100 m in radius, with terminal ejection velocities of m s-1. While these terminal ejection velocities are comparable to those found for 133P, the optically-dominant particle sizes are significantly larger for P/Read than for 133P. P/Read’s mass loss rate during its outburst is estimated to be kg s-1, roughly an order of magnitude larger than that estimated for 133P.
-
3.
Optical colors of P/Read’s dust coma are approximately solar and consistent with colors measured previously for 133P, other active and inactive comets, and C-type asteroids.
-
4.
Impulsive ejection of dust (e.g., by impact) is unable to account for the observed longevity of the coma and tail in 2005. A sustained, continuous mechanism for dust ejection, likely the sublimation of exposed ice, is required. Emission is determined to have begun at least two months prior to the discovery of activity, though we note that this is only a lower limit and that earlier start times are also possible.
-
5.
We note that the activity of P/Read is much stronger than that of the other two MBCs. We suggest that this may indicate that the impact assumed to have triggered P/Read’s activity occurred very recently, and encourage observations near its next perihelion passage (2011 Mar 10) to search for significantly weaker emission that may confirm this hypothesis.
References
- A’Hearn et al. (1984) Ahearn, M. F., Schleicher, D. G., Millis, R. L., Feldman, P. D., & Thompson, D. T. 1984, AJ, 89, 579
- Elst et al. (1996) Elst, E. W., Pizarro, O., Pollas, C., Ticha, J., Tichy, M., Moravec, Z., Offutt, W., & Marsden, B. G. 1996, IAUC 6496
- Epifani et al. (1999) Epifani, E., Rotundi, A., Foster, M. J., Green, S. F., Colangeli, L., Fulle, M., Mennella, V., & Palumbo, P. 1999, Planet. Space Sci., 47, 765
- Fernández et al. (2002) Fernández, J. A., Gallardo, T., & Brunini, A. 2002, Icarus, 159, 358
- Finson & Probstein (1968) Finson, M., & Probstein, R. 1968, ApJ, 154, 327
- Florczak et al. (1999) Florczak, M., Lazzaro, D., Mothé-Diniz, T., Angeli, C. A., & Betzler, A. S. 1999, A&AS, 134, 463
- Fukugita et al. (1996) Fukugita, M., Ichikawa, T., Gunn, J. E., Doi, M., Shimasaku, K., & Schneider, D. P. 1996, AJ, 111, 1748
- Fulle (2004) Fulle, M. 2004, Comets II, 565
- Hanner et al. (1981) Hanner, M. S., Giese, R. H., Weiss, K., & Zerull, R. 1981, A&A, 104, 42
- Hardorp (1980) Hardorp, J. 1980, A&A, 88, 334
- Hartmann et al. (1982) Hartmann, W., Cruikshank, D., & Degewij, J. 1982, Icarus, 52, 377
- Hartmann et al. (1990) Hartmann, W., Tholen, D., Meech, K., & Cruikshank, D. 1990, Icarus, 83, 1
- Hook et al. (2004) Hook, I. M., Jørgensen, I., Allington-Smith, J. R., Davies, R. L., Metcalfe, N., Murowinski, R. G., & Crampton, D. 2004, PASP, 116, 425
- Hsieh & Jewitt (2006a) Hsieh, H. H., & Jewitt, D. 2006a, IAU Symposium, 229, 425
- Hsieh & Jewitt (2006b) Hsieh, H. H., & Jewitt, D. 2006b, Science, 312, 561
- Hsieh et al. (2004) Hsieh, H. H., Jewitt, D. C., & Fernández, Y. R. 2004, AJ, 127, 2997
- Ipatov & Hahn (1997) Ipatov, S. I., & Hahn, G. J. 1997, in Lunar and Planetary Science XXVIII (Houston: Lunar Planet. Inst.), 619
- Ishiguro et al. (2007) Ishiguro, M., Sarugaku, Y., Ueno, M., Miura, N., Usui, F., Chun, M.-Y., & Kwon, S. M. 2007, Icarus, 189, 169
- Jewitt (2002) Jewitt, D. C. 2002, AJ, 123, 1039
- Jewitt et al. (2007) Jewitt, D., Lacerda, P., & Peixinho, N. 2007, IAU Circ., 8847, 1
- Kresák (1980) Kresák, L. 1980, Moon and Planets, 22, 83
- Landolt (1992) Landolt, A. U. 1992, AJ, 104, 340
- Levison et al. (2006) Levison, H. F., Terrell, D., Wiegert, P. A., Dones, L., & Duncan, M. J. 2006, Icarus, 182, 161
- Lisse et al. (1998) Lisse, C. M., A’Hearn, M. F., Hauser, M. G., Kelsall, T., Lien, D. J., Moseley, S. H., Reach, W. T., & Silverberg, R. F. 1998, ApJ, 496, 971
- Lowry et al. (2003) Lowry, S. C., Fitzsimmons, A., & Collander-Brown, S. 2003, A&A, 397, 329
- Marzari et al. (1995) Marzari, F., Davis, D., & Vanzani V. 1995, Icarus, 113, 168
- Nesvorný et al. (2008) Nesvorný, D., Bottke, W. F., Vokrouhlický, D., Sykes, M., Lien, D. J., & Stansberry, J. 2008, ApJ, 679, L143
- Oke et al. (1995) Oke, J. B., Cohen, J. G., Carr, M., Cromer, J., Dingizian, A., Harris, F. H., Labrecque, S., Lucinio, R., Schaal, W., Epps, H., & Miller, J. 1995, PASP, 107, 375
- Reach et al. (2000) Reach, W. T., Sykes, M. V., Lien, D., & Davies, J. K. 2000, Icarus, 148, 80
- Read et al. (2005) Read, M. T., Bressi, T.H., Gehrels, T., Scotti, J. V., & Christensen, E. J. 2005, IAU Circ., 8624, 1
- Russell (1916) Russell, H. N. 1916, ApJ, 43, 173
- Sarugaku et al. (2007) Sarugaku, Y., Ishiguro, M., Pyo, J., Miura, N., Nakada, Y., Usui, F., Ueno, M. 2007, Publ. Astron. Soc. Japan 59, L25
- Schörghofer (2008) Schörghofer, N. 2008, ApJ, 682, 697
- Stellingwerf (1978) Stellingwerf, R. F. 1978, ApJ, 224, 953
- Vaghi (1973) Vaghi, S. 1973, A&A, 24, 107
- Zappalà et al. (1990) Zappalà, V., Celliono, A., Farinella, P., & Kneević, Z. 1990, AJ, 100, 2030
| UT Date | Tel.aaTelescope used (UH2.2: University of Hawaii 2.2 m telescope; Gem.: 8 m Gemini North telescope; Keck: 10 m Keck I Observatory) | bbNumber of images | ccTotal effective exposure time | Filters | ddMean -band magnitude of nucleus and coma inside (radius) aperture | eeFWHM seeing in arcsec | ffTrue anomaly in degrees | ggMedian heliocentric distance in AU | hhMedian geocentric distance in AU | iiSolar phase angle in degrees | jjOrbit plane angle (between the observer and object orbit plane as seen from the object) in degrees | kkPosition angle of the antisolar vector, as projected in the plane of the sky, in degrees east of north | llPosition angle of the negative velocity vector, as projected in the plane of the sky, in degrees east of north |
|---|---|---|---|---|---|---|---|---|---|---|---|---|---|
| 2005 Jul 28 | Perihelion ……………………………………………………… | 0.0 | 2.37 | 2.28 | 25.2 | 0.5 | 252.3 | 250.9 | |||||
| 2005 Nov 10 | UH2.2 | 32 | 9600 | 19.280.05 | 1.0 | 31.4 | 2.44 | 1.45 | 0.6 | 0.1 | 258.6 | 253.0 | |
| 2005 Nov 19 | UH2.2 | 62 | 18600 | 19.340.05 | 0.9 | 34.0 | 2.45 | 1.47 | 3.8 | –0.1 | 73.6 | 252.4 | |
| 2005 Nov 20 | UH2.2 | 22 | 6600 | 19.460.05 | 0.9 | 34.2 | 2.45 | 1.47 | 4.3 | –0.1 | 73.6 | 252.4 | |
| 2005 Nov 21 | UH2.2 | 42 | 12600 | 19.370.05 | 0.7 | 34.5 | 2.45 | 1.48 | 4.8 | –0.1 | 73.6 | 252.3 | |
| 2005 Nov 22 | UH2.2 | 16 | 4800 | 19.280.05 | 0.8 | 34.8 | 2.45 | 1.48 | 5.3 | –0.1 | 73.6 | 252.3 | |
| 2005 Nov 26 | Gem. | 10 | 1110 | 19.720.10 | 0.5 | 35.9 | 2.46 | 1.50 | 7.1 | –0.2 | 73.5 | 252.0 | |
| 2005 Dec 24 | UH2.2 | 6 | 1800 | 20.120.03 | 1.1 | 43.7 | 2.50 | 1.74 | 17.1 | –0.5 | 72.9 | 251.3 | |
| 2005 Dec 25 | UH2.2 | 6 | 1800 | 20.160.03 | 1.1 | 43.9 | 2.51 | 1.75 | 17.4 | –0.5 | 72.9 | 251.3 | |
| 2007 Jan 27 | Keck | 4 | 720 | 24.90.4 | 0.6 | 123.0 | 3.43 | 2.49 | 5.2 | –0.5 | 284.6 | 290.1 | |
| 2008 May 19 | Aphelion ……………………………………………………….. | 180.0 | 3.96 | 3.28 | 11.8 | 0.0 | 114.0 | 294.2 | |||||
| 2011 Mar 10 | Perihelion ……………………………………………………… | 0.0 | 2.36 | 3.28 | 7.9 | –0.3 | 68.3 | 245.9 | |||||
| References | ||||
|---|---|---|---|---|
| P/2005 U1 (Read) | This work | |||
| Solar | Hartmann et al. (1982, 1990) | |||
| 133P/Elst-Pizarro (MBC) | Hsieh et al. (2004) | |||
| 46P/Wirtanen (active) | — | Epifani et al. (1999) | ||
| 47P/Ashbrook-Jackson (active) | — | Lowry et al. (2003) | ||
| 103P/Hartley 2 (active) | — | — | Lowry et al. (2003) | |
| Inactive comet nucleiaaAverage of 12 inactive comet nuclei ranging from to | — | — | Jewitt (2002) |
| Parameter | Value(s)aaParameter values tested | Best-FitbbParameter values from among those tested that produced simulated model images that provide the best match to observed data |
|---|---|---|
| ccPower index of dependence of ejection velocity, , on | 0.50 | 0.50 |
| ddPower index of dependence of ejection velocity, , on heliocentric distance, | 0.50 | 0.50 |
| eePower index of exponential size distribution of dust grains | 3.5 | 3.5 |
| ffPower index of dependence of dust production rate on heliocentric distance, | 3.0 | 3.0 |
| ggMaximum value in range tested | , , | |
| hhMinimum value in range tested | , , , | |
| iiEjection velocity in m s-1 of particles with at a heliocentric distance of AU | 10, 25, 50, 100, 150, 200 | 25 |
| jjHalf-opening angle in degrees with respect to the Sun-comet axis of assumed cone-shaped jet of dust emission | 45∘, 90∘, 180∘ | 45∘ |
| Days Since | |||||||
|---|---|---|---|---|---|---|---|
| UT Date | PerihelionaaDays elapsed since the most recent perihelion passage on 2005 Jul 28 | bbSolar phase angle in degrees | ccAverage magnitude measured inside an aperture with a radius | ddPhase-angle-corrected average measured magnitude, using | (obs.)ee in cm, calculated using | (contin.)ff in cm, calculated for modeled comet image using model for which emission is continuous throughout the observation period, normalized to observed on 2005 Nov 10 | (termin.)gg in cm, calculated for modeled comet image using model for which emission is terminated as of 2005 Nov 10, normalized to observed on 2005 Nov 10 |
| 2005 Nov 10 | 105 | 0.6 | 19.28 | 19.26 | 7.86 | 7.86 | |
| 2005 Nov 19 | 114 | 3.8 | 19.34 | 19.21 | 9.85 | 7.41 | |
| 2005 Nov 20 | 115 | 4.3 | 19.46 | 19.31 | — | — | |
| 2005 Nov 21 | 116 | 4.8 | 19.37 | 19.20 | — | — | |
| 2005 Nov 22 | 117 | 5.3 | 19.28 | 19.09 | — | — | |
| 2005 Nov 26 | 121 | 7.1 | 19.72 | 19.47 | 10.07 | 6.29 | |
| 2005 Dec 24 | 149 | 17.1 | 20.12 | 19.52 | 8.16 | 3.46 | |
| 2005 Dec 25 | 150 | 17.4 | 20.16 | 19.55 | — | — |
| bbSemimajor axis in AU | ccEccentricity | ddInclination in degrees | eeTisserand invariant | ffOrbital period in years | |
|---|---|---|---|---|---|
| 133P/Elst-Pizarro | 3.164 | 0.153 | 1.38 | 3.185 | 5.62 |
| P/2005 U1 (Read) | 3.165 | 0.253 | 1.27 | 3.153 | 5.63 |
| 176P/LINEAR | 3.218 | 0.144 | 1.40 | 3.173 | 5.71 |
| Themis familyggApproximate orbital element bounds of the Themis family (Zappalà et al., 1990) | 3.05–3.22 | 0.12–0.19 | 0.69–2.23 | ||
| Beagle familyhhApproximate orbital element bounds of the Beagle family (Nesvorný et al., 2008) | 3.15–3.17 | 0.15–0.16 | 1.30–1.41 |