Present address: ]Department of Physics, The American University in Cairo, P.O. Box 74 New Cairo 11835, Egypt
The pair potential of colloidal stars
Abstract
We report on the construction of colloidal stars: 1 m polystyrene beads grafted with a dense brush of 1 m long and 10 nm wide semi-flexible filamentous viruses. The pair interaction potentials of colloidal stars are measured using an experimental implementation of umbrella sampling, a technique originally developed in computer simulations in order to probe rare events. The influence of ionic strength and grafting density on the interaction is measured. Good agreements are found between the measured interactions and theoretical predictions based upon the osmotic pressure of counterions.
Polyelectrolyte brushes of flexible polymers have been the subject of many theoretical Pincus (1991); Russel et al. (1989); Ballauff and Borisov (2006) and experimental Ballauff and Borisov (2006) studies. Recently focus has shifted to semiflexible brushes Kegler et al. (2007) for which the persistence length is large compared to the monomer separation, but small compared to their contour length , or . In contrast, here we investigate brushes with . The grafted brushes consist of bacteriophage M13 viruses, which are rodlike, semiflexible charged polymers of length nm, diameter nm, and persistence length m Khalil et al. (2007); *Song91. The bare, linear charge density of M13 is high; .
In this letter, we describe “colloidal stars”, which are analogous to star polymers Pincus (1991); Jusufi et al. (2002); *Dominguez-Espinosa08; Jusufi et al. (2004); Ballauff and Borisov (2006), constructed by grafting genetically engineered M13 viruses Mao et al. (2004) to polystyrene spheres. These stiff brushes represent a new class of stars. The M13 are rigid enough to form liquid crystals Dogic and Fraden (2006), but when grafted to a sphere remain flexible enough to be distorted by the director field, as shown in Fig. 1. These colloidal structures are characterized by fluorescent microscopy, transmission electron microscopy (TEM) and fluorometry. The interaction potential is probed using laser tweezers. To extract the steeply varying pair-potential we develop a new experimental protocol based on the computer simulation method known as umbrella sampling Torrie and Valleau (1977), but modified to increase the protocol’s efficiency under experimental constraints. This new method allows the measurement of potentials much greater in magnitude than done perviously with line traps Crocker et al. (1999); Lin et al. (2001). We find that the measured potential of the colloidal stars can be modeled as arising from the osmotic pressure of the counter-ions, which is in several fold excess of the repulsion due to rod excluded volume.
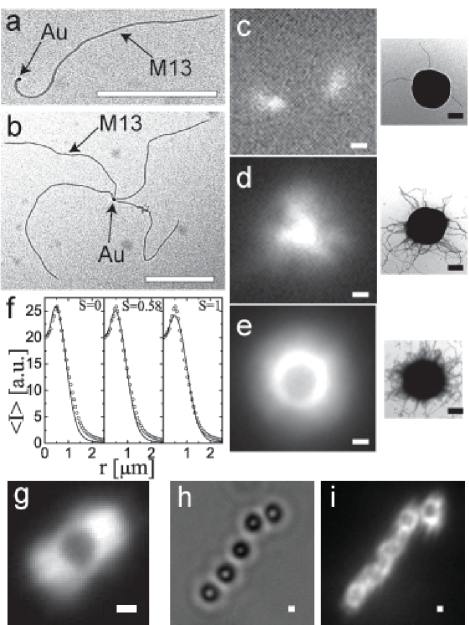
M13 bacteriophage was grown and purified as described elsewhere Maniatis et al. (1989). The M13 capsid protein pIII, present only on one end of the virus, was modified in order to display cysteine residues. We achieved this through making use of the Ph.D.-C7C Phage Display Peptide Library (M13-C7C, New England Biolabs, Beverly, MA) Mao et al. (2004). We were able to create colloidal stars with core sizes varying from 10 nm to 1 m. Fig. 1a and b show M13-C7C viruses conjugated with 10-nm colloidal Au particles (Ted Pella, Redding, CA). In this article, we focus on the colloidal star constructed by attaching the engineered phages to a 1 micron diameter polystyrene sphere. This was done using the following procedure: First, 230 l of 8.8 mg/ml M13-C7C was reduced with 2 l of 0.18 mg/ml TCEP (Tris(2-carboxyethyl)phosphine) for 15 min. This M13-C7C solution was mixed with 2 l of 19 mM maleimide-PEO2-biotin (Pierce, Rockford, IL) for 1 h in 20 mM phosphate buffer at H = 7.0. The phage solution was dialyzed extensively against phosphate buffer to remove excess biotin and the H was readjusted to 8.0. Subsequently, the phages were mixed for 1 h with 1 mg/ml Alexa Fluor® 488 carboxylic acid succinimidyl ester (Molecular Probes, Eugene, OR), and centrifuged four times at for 1 h to remove free dye molecules. 0.5 mg/ml of the fluorescently-labelled viruses were then incubated with (w/v) straptavidin-coated polystyrene beads of diameter m (Bangs Laboratories, Fishers, IN) for 24 hours at room temperature. To the suspension 0.05 mg/ml -casein (Sigma, St. Louis, MO) was added and the whole mixture was centrifuged twice at for 10 min. Finally, the pellet was resuspended in 100 l of phosphate buffer (5 mM, H 8.0) and stored at C. The number of the sphere-bound viruses was determined using a fluorescence spectrophotometer (F-2000, Hitachi, Tokyo, Japan). By varying the stoichiometric ratio of biotinylated viruses to straptavidin-coated beads we created star polymers of different grafting densities as revealed by both fluorescence and TEM images (Fig. 1(c-e)). Fluorescent images were taken on a fluorescence microscope (TE2000-U, Nikon) equipped with a oil-immersion objective and a cooled CCD camera (CoolSnap HQ, Roper Scientific). The TEM samples, stained with uranyl acetate, were imaged with a 268 microscope (Morgagni, FEI Company, Hillsboro, OR), operating at 80 kV.
At the grafting density of 135 phages/bead (Fig. 1e), the anchored dye-labelled rods form a spherically symmetric corona around the bead with a radially-averaged intensity (RAI) profile shown in Fig. 1(f). We model the phage-grafted bead as hard rods anchored to the sphere with a Gaussian angle distribution, which is centered around the surface normal. The diffraction-limited fluorescent image of the colloidal star was computed by convolving the distribution of the rod’s segments with the theoretical 3D point spread function (PSF) of the microscope Born and Wolf (1997). As can be seen from Fig. 1(f) the calculated RAI profiles are insensitive to the orientational order parameter of the anchored rods , where is the angle between the rod and the surface normal. However, the best fits were for intermediate order parameters.
The free energy as a function of separation between two colloidal particles (the potential of mean force) can be determined up to an additive offset by the Boltzmann relation, . Experimentally this is accomplished by measuring the probability of finding the particles at a separation . However, for states of even moderate repulsive interaction energies becomes very small. As a result, infrequent visitation of improbable states leads to poor statistics and errors in the determination of which limited the magnitude of measured potentials in previous implementations of line traps, or single bias potentials to about 6 Crocker et al. (1999); Lin et al. (2001). In this paper the maximum measured potential is 40 , but we estimate that potentials several times this value are feasible with the laser power and optical resolution of our instrument.
We achieve these measurements by employing the method of umbrella sampling, in which a biasing force is used to enhance sampling of rare configurations; results are then re-weighted to obtain the physical probability distribution Torrie and Valleau (1977). Specifically, we place two colloidal stars (Fig. 2b) in separate laser traps and measure the histogram of separation distances between the colloids. The measurement is performed in a series of windows, each of which uses a different separation distance between the minima of the two laser traps. In each window the stars fluctuate about the minimum of a total potential resulting from a combination of the dual traps and interparticle star potential. Only 6 of each of the total potentials is sampled and each minimum has a different energy, but here we show how the total potentials from overlapping windows can be combined to produce a single interparticle pair-potential of large range and magnitude. For the protocol typically used in simulations, results from different windows would be simultaneously re-weighted and stitched together to obtain a continuous function for the probability using the weighted histogram analysis method (WHAM) Ferrenberg and Swendsen (1989); *Kumar92; *Roux95. However, the biasing potential is a function of two coordinates because the position of each bead is controlled by a separate trap. The number of independent measurements required for a particular level of statistical accuracy using WHAM rises exponentially with the number of dimensions of the biasing potential (even if the probability is projected onto a single coordinate). We overcome this limitation as follows.
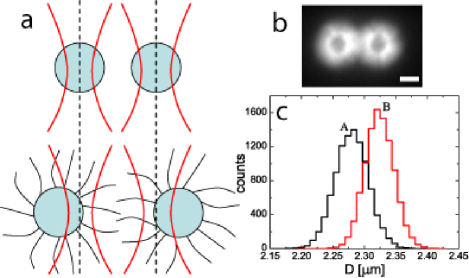
Our goal is to measure the interaction potential, with , between a pair of functionalized particles sitting at positions in a bias potential (laser trap) of strength . We achieve this goal by performing two experiments (Fig. 2a). In one experiment we place two colloidal stars in two separate laser traps and in the other experiment we place two bare colloids in the same two traps. For both experiments we measure the separation histogram of the colloids as a function of the trap separation. The potential of mean force, , is then obtained by subtracting the results from each experiment.
| (1) |
with and the fraction of measured displacements that fall within the histogram bin associated with the displacement value for functionalized and non-functionalized beads, respectively. While this subtraction method has been used in previous experiments Crocker et al. (1999); Lin et al. (2001), we rigorously prove its validity here and show how to implement it over multiple windows.
The fractions of measured displacements are governed by the Boltzmann distribution and given by
| (2) |
and
| (3) | |||||
with the Dirac delta function and the normalization factors are given by
| (4) |
We change the integration variables to and and integrate over to obtain
| (5) |
Inserting this result into Eq. 1 gives the calculated potential of mean force:
| (6) |
We see that plus a constant. As discussed above, the strength of the laser traps, , is such that the colloids sample only a small range and therefore only a small piece of the interaction potential is obtained. To determine a wider range of the laser trap separation is varied and is obtained anew. Although the constant term is different for each separation of the traps, the entire potential can be stitched together to within a single additive constant by assuming that is continuous.
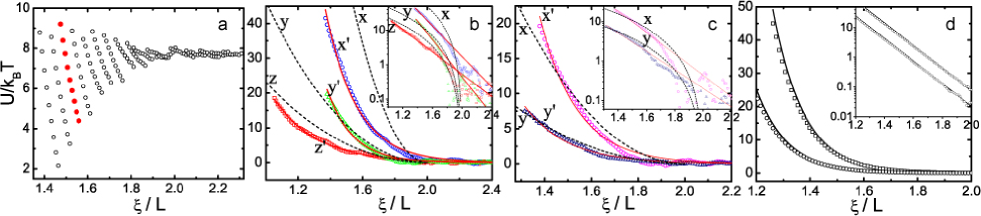
As a check of this implementation of the umbrella sampling algorithm, we used computer simulations to model the experiment. The results validating this method are shown in Fig. 3d.
The experimental system is shown schematically in Fig. 2a. The fluorescence image of trapped beads is shown in Fig. 2b. Optical tweezer setup is built around the inverted fluorescence microscope. A single laser beam is time-shared between two points via a pair of orthogonally oriented paratellurite (TeO2) acousto-optic deflectors (AOD, Intra-Action, Bellwood, IL). About 30 mW of a 1064-nm laser (Laser Quantum, Cheshire, UK) is projected onto the back focal plane of an oil-immersion objective (, N.A.=1.3, Nikon) and subsequently focused into the sample chamber. Spheres are trapped 5 m away from the surface to minimize possible wall effects. We choose a set of umbrella window potentials by systematically varying the locations of the traps’ centers and . For each window potential, six minutes of video are recorded for a pair of phage-grafted beads, and the separation probability distribution, is obtained. It is a simple Gaussian if the separation is large and the beads are not interacting. The distances between trap positions are selected so that there are sufficient overlaps between adjacent positions. We collected data for different trap positions with 50 nm increments in separation to cover a wide range of the interparticle potential. Under identical conditions (microscope illumination, laser power, sample buffer, etc.), the experiment was repeated immediately for a pair of streptavidin-coated PS beads without attached virus to measure . For all experiments, statistically independent configurations of beads were sampled at 30 frames/sec. We analyzed the video images using a custom program written in the language IDL Crocker and Grier (1996). By constructing a histogram of center-center separations on images in each window, we found clear differences between the separation probability distributions of virus-grafted beads and bare beads (Fig. 2c).
Fig. 3b shows the interaction potentials measured between two M13-grafted microspheres with varying solution ionic strengths. The interactions are all purely repulsive. The potential decays to zero as the distance between sphere surfaces increases beyond twice the virus length. There is a strong dependence of the pair potential on the ionic strength of the surrounding medium. A decrease in the solution ionic strength leads to increased interaction between spheres grafted with charged rods. We compare the interaction potential between microspheres at grafting densities of 80 and 135 viruses per sphere (Fig. 3c). The increase in density by increases the pair-potential by a factor of 2.6, but does not change its functional form.
We calculated the interaction potential arising from the osmotic pressure of counterions trapped within the grafted layers based on the mean field calculation theory of Jusufi Jusufi et al. (2002); *Dominguez-Espinosa08; Jusufi et al. (2004), except modified for the case where the density of fixed charges on the grafted rods is small compared to the salt concentration. In particular, the densities of positive and negative ions within the grafted layer are given by , with the salt concentration and the fixed concentration of negative charges on the grafted rods, with the number of rods per colloid and an adjustable parameter for the linear charge density renormalized by condensation. The counterion excess free energy is calculated by integrating over the volume of the grafted layer with m the core radius, the angle with the center to center vector for the pair of colloids, and the center to center distance. Following the interaction geometry depicted in Fig. 5 of Ref. Jusufi et al. (2004), the height of the grafted layer is for and for with . We have assumed and that the height of the unperturbed grafted layer is equal to the length of a virus, nm (i.e. we neglect rod orientational fluctuations). Theory and experiment are compared in Figs. 3b & c; the agreement is rather good considering five measured potentials are fit with one value of the effective charge.
We also calculated the interaction due to the excluded volume of grafted rods based on the Onsager second virial expansion of the free energy Onsager (1949). For two rods, each with a specified orientation, we find the pairwise excluded area, or the space of relative grafting locations for which the rods overlap. The calculated interaction potential due to rod excluded volume was significantly smaller compared to the interaction due to counterion osmotic pressure; the latter interaction agrees well with the measured interaction potentials.
In conclusion, the umbrella sampling method is applied to extract the pair potential of the colloidal stars which are trapped with optical tweezers. The method allows for measurement of potentials of the order of 100 , an energy much greater than previously measured with line traps. The large measured repulsive energy between colloidal stars is consistent with the osmotic pressure of counter-ions between the charged brush, while a second virial theory based on the Onsager approximation significantly underestimates the pair potential. The construction of colloidal star polymers from genetically engineered viruses opens the possibility of a systematic study of hybrid colloidal materials exhibiting complex phase behaviors.
Acknowledgement. We thank Dr. Kirstin Purdy for the initial development of the star colloid, and Dr. Chen Xu for TEM support. Financial support of this work came from NSF (DMR-0444172), NSF (DMR-0705855) and NSF-MRSEC (DMR-0820492).
References
- Pincus (1991) P. Pincus, Macromolecules 24, 2912 (1991)
- Russel et al. (1989) W. B. Russel, D. A. Saville, and W. R. Schowalter, Colloidal Dispersions (Cambridge University Press, Cambridge, 1989)
- Ballauff and Borisov (2006) M. Ballauff and O. Borisov, Curr. Opin. Colloid Interface Sci. 11, 316 (2006)
- Kegler et al. (2007) K. Kegler, M. Salomo, and F. Kremer, Phys. Rev. Lett. 98, 058304 (2007)
- Khalil et al. (2007) A. S. Khalil et al., Proc. Natl. Acad. Sci. 104, 4892 (2007)
- Song et al. (1991) L. Song et al., Biopolymers 31, 547 (1991)
- Jusufi et al. (2002) A. Jusufi, C. N. Likos, and H. Löwen, J. Chem. Phys. 116, 11011 (2002)
- Dominguez-Espinosa et al. (2008) G. Dominguez-Espinosa et al., Polymer 49, 4802 (2008)
- Jusufi et al. (2004) A. Jusufi, C. N. Likos, and M. Ballauff, Colloid Polym. Sci. 282, 910 (2004)
- Mao et al. (2004) C. B. Mao et al., Science 303, 213 (2004)
- Dogic and Fraden (2006) Z. Dogic and S. Fraden, Curr. Opin. Colloid Interface Sci. 11, 47 (2006)
- Torrie and Valleau (1977) G. M. Torrie and J. P. Valleau, J. Comput. Phys. 23, 187 (1977)
- Crocker et al. (1999) J. C. Crocker et al., Phys. Rev. Lett. 82, 4352 (1999)
- Lin et al. (2001) K. H. Lin et al., Phys. Rev. Lett. 87, 088301 (2001)
- Maniatis et al. (1989) T. Maniatis, J. Sambrook, and E. F. Fritsch, Molecular Cloning: A Laboratory Manual (Cold Spring Harbor Laboratory Press, Plainview, NY, 1989), 2nd ed.
- Born and Wolf (1997) M. Born and E. Wolf, Principles of Optics: Electromagnetic Theory of Propagation, Interference and Diffraction of Light (Cambridge University Press, Cambridge, 1997), 6th ed.
- Ferrenberg and Swendsen (1989) A. M. Ferrenberg and R. H. Swendsen, Phys. Rev. Lett. 63, 1195 (1989)
- Kumar et al. (1992) S. Kumar et al., J. Comput. Chem. 13, 1011 (1992)
- Roux (1995) B. Roux, Comput. Phys. Commun. 91, 275 (1995)
- Crocker and Grier (1996) J. C. Crocker and D. G. Grier, J. Colloid Interface Sci. 179, 298 (1996)
- Onsager (1949) L. Onsager, Ann. N.Y. Acad. Sci 51, 627 (1949)