NOIRCAT – The Northern HIPASS Optical/IR Catalogue
Abstract
We present the Northern HIPASS Optical/InfraRed CATalogue (NOIRCAT), an optical/near-infrared counterpart to the Northern HIPASS catalogue (NHICAT). Of the 1002 sources in NHICAT, 655 () have optical counterparts with matching optical velocities. A further 85 (8%) sources have optical counterparts with matching velocities from previous radio emission-line surveys. We find a correlation between the gas and stellar content of the NOIRCAT sources. Our Hi-selected sample of isolated galaxies also present a wider range in near-infrared (NIR) colours than previous optically-selected studies of regular, isolated galaxies. All Hi detections in optically unobscured fields could be matched with either a NED optical counterpart, or a galaxy visible in POSSII or DSS images. However, as over 200 of these matched galaxies have no velocity information, further follow-up observations are needed to confirm the matches, and hence confirm or deny the existence of dark galaxies in this dataset.
keywords:
methods: observational - surveys - catalogues - radio lines: galaxies1 Introduction
Primordial gas clouds are postulated to exist in the Local Universe due to the slow collapse of material about small density perturbations present in the matter density field (after the epoch of recombination) which have not reached the threshold density needed to form stars (Giovanelli & Haynes, 1989). -body simulations of galaxy formation using the Cold Dark Matter cosmological model (Moore et al., 1999; Klypin et al., 1999) predicted a significant number of small dark matter halos. Since dark matter halos exist around most galaxies, small dark matter haloes are assumed to exist around dwarf galaxies. However, current observations find the number of dwarf galaxies to be significantly less than the predicted number of small dark matter halos. Without modifying the large-scale properties of these models, it may be possible for small dark matter halos to exist and galaxies not to have been observed if star formation had been suppressed in these dark halos. Two possibilities exist: (i) the halos may contain gas but star formation is suppressed; (ii) the halos do not contain gas. Current reionisation models of the Universe predict the latter as they find that the gas from 95% of the low-mass systems ( or km s-1) appears to have been photoevaporated during the epoch of reionisation (Susa & Umemura, 2004).
Schneider (1996) suggested that Hi surveys can be used to probe the regions of the Local Universe where stars have not formed since most surveys conducted with optical telescopes are biased against objects such as low surface brightness (LSB) galaxies and the proposed dark galaxies. There are also numerous objects such as NGC 2915, a small blue compact dwarf galaxy in optical wavelengths, with an enormous envelope of Hi extending beyond 5 Holmberg radii (Meurer et al., 1996). Hence, blind all-sky Hi surveys (i.e. HIPASS) may reveal a large undiscovered population of gas-rich LSB galaxies (Disney, 1976) as well as other gas-rich dwarf galaxies.
The Hi Parkes All-Sky Survey (HIPASS) is the largest blind Hi survey, covering of the total sky using the Parkes Radio Telescope111The Parkes telescope is part of the Australia Telescope which is funded by the Commonwealth of Australia for operation as a National Facility managed by CSIRO.. Northern HIPASS surveys the entire sky within the declination range , whereas Southern HIPASS covers the entire Southern sky south of a declination of . The Northern HIPASS catalogue (NHICAT; Wong et al., 2006) and the Southern HIPASS catalogue (HICAT; Meyer et al., 2004) detected 1002 and 4315 galaxies respectively, based solely on the Hi content. Here, we present the Northern HIPASS optical and near-IR catalogue (NOIRCAT)—a catalogue of optical and near-infrared counterparts to the Hi galaxies in NHICAT. NOIRCAT is analogous to the HIPASS Optical Catalogue (HOPCAT; Doyle et al., 2005) which is a catalogue of optical counterparts for HICAT.
There are many theoretical arguments for (Davies et al., 2006; Verde et al., 2002) and against (Taylor & Webster, 2005) the existence of dark galaxies which will be further discussed in Section 3. To avoid confusion, we define a dark galaxy to be an optically dark, isolated Hi source, with no neighbouring galaxies and no stars. Previous discoveries of “dark” galaxies were either high velocity clouds (Kilborn et al., 2000) or gas clouds associated with optical galaxies (Schneider et al., 1983; Ryder et al., 2001). One of the best dark galaxy candidate is the isolated Hi cloud, HI1225+02 (Giovanelli & Haynes, 1989). Higher spatial resolution mapping of HI1225+01 showed two dynamically-distinct components (Chengalur et al., 1995); one of which is associated with a LSB dwarf, while the other (south-western cloud) is starless down to at least 27.2 magnitudes in the -band (Turner & MacFadyen, 1997).
The most recent unconfirmed dark galaxy candidate is GEMS_N3783_2, an isolated region of Hi gas with no visible optical counterpart located within the NGC 3783 galaxy group (Kilborn et al., 2006). Kilborn et al. (2006) concluded that GEMS_N3783_2 was formed during the interaction of NGC 3706 and ESO 378-G003. However, the projected separation of GEMS_N3783_2 and ESO 378-G003 is 450 kpc with no obvious Hi bridge or tail structures. Hence deeper follow-up observations are needed to confirm and uncover any further Hi or optically-faint counterparts remaining in this system.
Previous blind HI surveys, including HIPASS, have not found any evidence for the existence of dark galaxies. Even though the main purpose of NOIRCAT is to provide complementary optical/near-infrared data to NHICAT, NOIRCAT will also be able to provide an independent search for dark galaxies.
Section 2 describes the construction of NOIRCAT and the properties of the catalogued galaxies. Discussion of the scientific implications can be found in Section 3 and Section 4 provides a summary of our results.
2 NOIRCAT
This section describes the method used to produce NOIRCAT and the properties of NOIRCAT. To probe the existence of dark galaxies, sources with no optical velocity matches within of the HIPASS centre will be further analysed in Section 2.3.
| Flag | Definition | Total |
| 1 | Single optical velocity match with 2MASS counterpart | 414 |
| 2 | Single optical velocity match without 2MASS counterpart | 126 |
| 3 | Multiple optical velocity matches where all matches also have 2MASS counterparts | 63 |
| 4 | Multiple optical velocity matches where one or more matches are without 2MASS counterparts | 52 |
| 5a | No optical velocity match but with higher angular resolution Hi velocity match | 85 |
| 5b | No velocity match but positional matches available to NED galaxies | 221 |
| 5c | No velocity or positional matches to any galaxies listed in NED | 41 |
2.1 The construction of NOIRCAT
There have been several methods with which catalogues of optical counterparts of HIPASS samples have been produced. Both Kilborn et al. (2002) and Ryan-Weber et al. (2002) used NED222The NASA/IPAC Extragalactic Database (NED) is operated by the Jet Propulsion Laboratory, California Institute of Technology, under contract with the National Aeronautics and Space Administration. to search for known optical counterparts to each of the Hi sources in the South Celestial Cap (SCC) sample and the HIPASS Bright Galaxy Catalogue (BGC; Koribalski et al., 2004), respectively. On the other hand, HOPCAT was produced using an automated visual interactive program which displays SExtractor (Bertin & Arnouts, 1996) ellipses representing areas within the SUPERCOSMOS fields which are above the sky intensity as well as velocities derived from both 6dF and NED. The automated visual display program was then used by three people to interactively compile HOPCAT. In HOPCAT, an optical match is proposed when the HIPASS velocity is within 400 km s-1 of the velocity derived from NED/6dF and the positional match is within the SUPERCOSMOS field.
The large Southern sky surveys used to generate HOPCAT, such as 6dF and SUPERCOSMOS, are not available for the construction of NOIRCAT. Northern analogues of 6dF and SUPERCOSMOS do not exist. Most large, recent optical surveys such as SDSS do not cover the entire Northern sky. Hence, NED is used as our source catalogue for optically matching the Northern HIPASS detections. It should be noted that we used the October 2006 version of NED. To improve optical detection limits, we also used the 2MASS near-infrared catalogue. For NOIRCAT, the primary method for determining the optical/near-infrared matches was by “interactive” cataloguing, after an automated search of the NED and 2MASS catalogues. The automated search identified all the NED and 2MASS sources within 7.5′ and 400 km s-1 of each NHICAT source. These preliminary search criteria were intended to be simple, in order to include galaxies that may have extended Hi, or an Hi distribution that is offset from the optical counterpart. These parameters are also consistent with HOPCAT’s matching criteria.
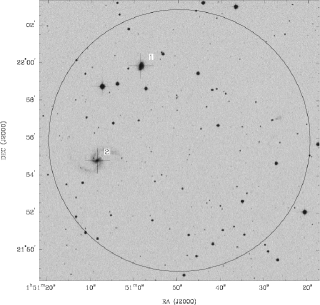
The preliminary matches were then plotted with a ‘+’ and a number onto an optical field centred on the corresponding HIPASS source centre. Figure 1 shows an example of the graphics window shown for HIPASSJ0150+21 (a Flag 3 source) during this interactive process. Each HIPASS field is displayed (with a list of properties found from the automated search), inspected and graded using the interactive process. The list of properties displayed include the HIPASS velocity, velocity width, name, optical velocities (and errors) as well as the availability of 2MASS magnitudes for each of the NED sources found. We obtained optical fields for all the NHICAT sources from the Second Palomar Sky Survey (POSSII; Reid et al., 1991) in the red band. Table 1 shows the five main categories into which each source was sorted.
During the interactive process, the appropriate optical matches and match category are determined for each HIPASS source. The three rules used for determining a match are:
-
1.
Optical sources must be within 7.5′ of the HIPASS centre. Where there are multiple source names referring to the same source (e.g. SDSS and APM nomenclatures), the non-SDSS/APM reference is preferred.
-
2.
Optical velocity matches are made when the published optical velocity (including velocity uncertainties) is consistent to within 100 km s-1 of the HIPASS velocity profile.
-
3.
For optical velocities without published errors in NED, a match is recorded when the published optical velocity is within 150 km s-1 of the HIPASS velocity profile.
To be consistent with previous HIPASS optical counterpart catalogues (Ryan-Weber et al., 2002; Doyle et al., 2005), we chose 7.5′ to be the maximum angular separation between a HIPASS source centre and potential optical match. Although the predicted position accuracy is 3′, the position accuracy also depends on the Hi peak flux density, the source extent and any asymmetries or confusion intrinsic to the source (Barnes et al., 2001). Previous catalogues have also found match separations greater than 5′. Within HOPCAT, ( sources) of the HIPASS-optical velocity matches correspond to angular separations greater than 7.5′ even though the average HIPASS beam FWHM is 14.3′ (Barnes et al., 2001). Other reasons for positional matches beyond 3′ will be further discussed in Section 3.
The interactive cataloguing was undertaken by two independent researchers (Wong and Waugh). It should be noted that, unlike HOPCAT, all multiple optical matches (Flag 3 or 4) will be listed in NOIRCAT and no attempt has been made to choose between possible matches. In these cases, discrimination can only be made with higher angular and velocity resolution Hi observations.
2.2 Properties of NOIRCAT
We found that 655 of 1002 NHICAT sources could be matched with
previously-catalogued galaxies for which an optical velocity was
available (Flags 1 to 4). Of these 655 sources, are matches to
single galaxies and of these matches, have 2MASS observations
in the , and wavebands. Table 1 summarises the distribution of
NHICAT sources over the seven match categories. A full description of
NOIRCAT’s parameters and an example of the first 10 sources in NOIRCAT
can be found in Table 2. The total NIR , and
magnitudes from 2MASS are also listed in NOIRCAT. Corrections333More
details on the 2MASS processing can be found at: http://www.ipac.caltech.edu/2mass/releases/allsky/doc
/sec4_5e.htmllarge were made to account for
the 10%–20% flux loss due to the very high background levels in the 2MASS
observations.
To examine the properties of these matched galaxies, we use the 2MASS , and magnitudes instead of the optical magnitudes because the 2MASS catalogue is the best available optical/NIR catalogue and has the best Northern sky coverage corresponding to the sky coverage of Northern HIPASS. The NIR wavelengths are also less sensitive to the dust obscuration in the Galactic plane. The NIR apparent magnitudes can be used as stellar mass indicators. The NIR observations are better tracers of mass distribution because NIR emission is derived primarily from cooler giant and dwarf stars (instead of hot young stars) which account for a major fraction of the bolometric luminosity of a galaxy. Using the NIR observations, we explore the relationships between the Hi content of HIPASS galaxies and their inferred stellar content.
Figure 2 shows the Hi absolute magnitude444The Hi absolute magnitude has been calculated using the AB magnitude system via: where is the measured Hi flux in units of ergs s-1 cm-2 Hz-1 (M21cm) of Flag 1 sources as a function of the , and absolute magnitudes. The flux observation limit of Northern HIPASS is 0.07 Jy for a detection that is 5 times the RMS.
| (1) HIPASS_name | (2) RA_HIPASS | (3) Dec_HIPASS | (4) Vel_HIPASS | (5) W_HIPASS | (6) Flag | (7) Optical_source | (8) RA_optical |
|---|---|---|---|---|---|---|---|
| (9) Dec_optical | (10) Separation | (11) NED_type | (12) NED_morph | (13) Vel_optical | (14) Vel_err_optical | (15) Vel_source | |
| (16) J | (17) J_err | (18) H | (19) H_err | (20) K | (21) K_err | ||
| HIPASSJ0001+05 | 00:01:39.0 | 05:18:47 | 3956.9 | 48.2 | 5 | UGC12910 | 00:01:28.4 |
| +05:23:22 | 5.3 | Galaxy | SB(r)m | 3949 | 5 | 1990ApJS…72..245S | |
| – | – | – | – | – | – | ||
| HIPASSJ0002+16a | 00:02:08.4 | 16:35:13 | 1047.3 | 108.5 | 5 | IC 5377 | 00:02:05.4 |
| +16:35:25 | 0.7 | Galaxy | Im | 1050 | 4 | 1990ApJS…72..245S | |
| – | – | – | – | – | – | ||
| HIPASSJ0002+16b | 00:02:54.9 | 16:08:51 | 1047.1 | 456.8 | 1 | NGC 7814 | 00:03:14.9 |
| +16:08:44 | 4.8 | Galaxy | SA(S)ab | 1050 | 4 | 1999ApJS..121..287H | |
| 8.089 | 0.020 | 7.361 | 0.023 | 7.084 | 0.024 | ||
| HIPASSJ0003+07 | 00:03:46.1 | 07:29:02 | 5240.5 | 181.9 | 1 | NGC 7816 | 00:03:48.8 |
| +07:28:43 | 0.8 | Galaxy | Sbc | 5241 | 5 | 1999ApJS..121..287H | |
| 10.561 | 0.024 | 9.863 | 0.030 | 9.525 | 0.034 | ||
| HIPASSJ0003+15 | 00:03:58.4 | 15:11:59 | 873.8 | 100.6 | 5 | UGC00017 | 00:03:43.3 |
| +15:13:06 | 3.8 | Galaxy | Sm | 878 | 6 | 1991RC3.9.C…0000d | |
| – | – | – | – | – | – | ||
| HIPASSJ0004+07 | 00:04:17.6 | 07:21:47 | 6193.1 | 198.7 | 1 | NGC 7818 | 00:04:08.8 |
| +07:22:46 | 2.4 | Galaxy | Scd | 6201 | 1 | 1999ApJS..121..287H | |
| 12.117 | 0.046 | 11.499 | 0.066 | 11.079 | 0.069 | ||
| HIPASSJ0004+20 | 00:04:18.1 | 20:49:39 | 2162.1 | 107.1 | 1 | NGC 7817 | 00:03:58.9 |
| +20:45:08 | 6.4 | Galaxy | SAbc | 2310 | 1 | 1999ApJS..121..287H | |
| 9.489 | 0.006 | 8.734 | 0.007 | 8.421 | 0.008 | ||
| HIPASSJ0004+05 | 00:04:34.4 | 05:50:00 | 3112.2 | 221.0 | 1 | UGC00027 | 00:04:28.8 |
| +05:50:50 | 1.6 | Galaxy | Scd | 3118 | 1 | 1999ApJS..121..287H | |
| 13.275 | 0.076 | 12.749 | 0.120 | 12.265 | 0.131 | ||
| HIPASSJ0006+17 | 00:06:30.3 | 17:20:22 | 875.4 | 78.4 | 5 | UGC00047 | 00:06:38.3 |
| +17:17:03 | 3.8 | Galaxy | Sdm | 873 | 4 | 1990ApJS…72..245S | |
| – | – | – | – | – | – | ||
| HIPASSJ0006+08 | 00:06:45.7 | 08:37:26 | 5255.2 | 210.5 | 1 | UGC00052 | 00:06:49.5 |
| +08:37:43 | 1.0 | Galaxy | SAc | 5257 | 2 | 1999ApJS..121..287H | |
| 11.361 | 0.037 | 10.772 | 0.053 | 10.405 | 0.060 |
NOTE.— Parameter definitions. (1): HIPASS identification. (2): HIPASS right ascension (J2000). (3): HIPASS declination (J2000). (4): HIPASS heliocentric velocity at FWHM (km s-1). (5): HIPASS velocity width (km s-1). (6): Optical match category flag. (7): Source name of optical match. (8): Right ascension (J2000) of optical source. (9): Declination (J2000) of optical source. (10): Spatial separation between the HIPASS source centre and the matched source (). (11): NED’s classification of source type (e.g. Galaxy, Galaxy Pair). (12): Published NED morphology. (13): Velocity of optical source (km s-1). (14): Velocity error of optical source (km s-1). (15): Reference for optical velocity. (16): -band magnitude from total 2MASS flux. (17): -band magnitude error from 2MASS. (18): -band magnitude from total 2MASS flux. (19): -band magnitude error from 2MASS. (20): -band magnitude from total 2MASS flux. (21): -band magnitude error from 2MASS.


Likewise, the 2MASS observation limits are at log W cm-2 m-1, log W cm-2 m-1 and log for a detection in the , and bands, respectively. A Pearson correlation test resulted in an -value of 0.72 for the relationship between all three NIR magnitudes with respect to M21cm. This correlation at a 99.9% confidence level suggests that galaxies with more luminous in the NIR also have more Hi. However, it should be noted that this correlation may be highly biased by the detection limits of the samples used and that at any given Hi mass, there exists a broad range in NIR luminosity (as shown in Figure 2.
Bell & de
Jong (2001) found a correlation between the stellar mass-to-light
ratios and the colours of galaxies from the 2MASS/SDSS passbands.
Using the NIR colours, we can distinguish between the galaxies
which consist mainly of young stars, from the galaxies with larger fractions
of older giants. The derived total NIR fluxes in 2MASS are too sensitive to
stellar contamination and irregularities in the surface brightness
profiles555http://www.ipac.caltech.edu/2mass/releases/allsky/doc
/sec2_3b.html for the determination of NIR colours. Therefore,
to study the NIR colour properties of our sample, we use the NIR magnitudes
from the 2MASS isophotal photometry. More accurate NIR colours are
obtained, even though these flux values do not reflect the total flux of a source
since the isophotal measurements are set at the 20th magnitude per arcsecond squared
at the band (which roughly correspond to 1 of the background RMS).
Figure 3 shows the colours (of 264 Flag 1 sources with
reliable 2MASS isophotal photometry in all three , and bands) as
a function of the Hi mass (). Following Roberts (1962), the
Hi mass was calculated from:
| (1) |
where Hubble Flow distances (D) assuming km s-1 Mpc-1 and Hi integrated fluxes () are used. We found the best linear fit to be . Most of the observed scatter can be attributed to the uncertainties from the 2MASS automated processing pipeline (Jarrett, 2007). A good correlation was found between the Hi mass and the NIR colours (Pearson -value = 0.37), which suggests that galaxies with greater Hi masses appear to have redder colours at a 99.9% confidence level. This agrees with previous work (e.g. Hanish et al., 2006) which found that galaxies with greater Hi mass correspond to galaxies with greater optical -band luminosity densities. Our results are also complementary to the findings of Bell et al. (2003) that galaxies with redder optical colours have greater mass-to-light ratios.
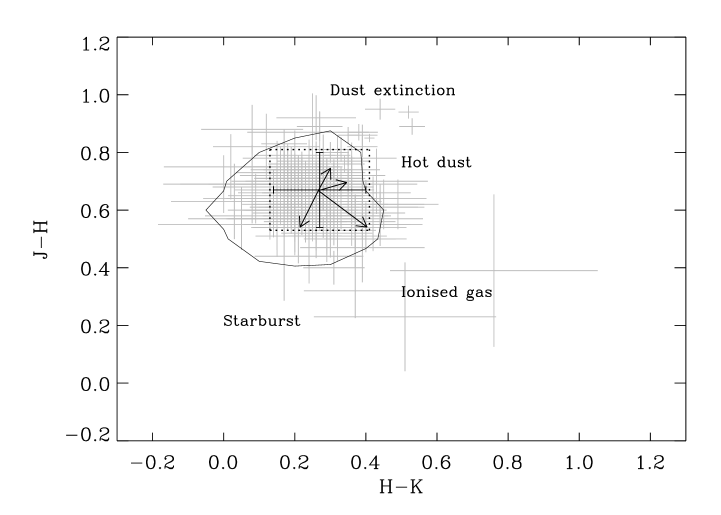
Near-infrared studies of normal non-interacting galaxies with nuclei dominated by older stars found that such galaxies span a very narrow window in the versus colour-colour diagram (Geller et al., 2006; Giuricin et al., 1993). Currently, the largest sample of NIR colours of galaxy pairs is catalogued by Geller et al. (2006). The NIR properties of these interacting galaxies were compared to the NIR properties of normal galaxy population from the Nearby Field Galaxy Sample, NFGS (Jansen et al. 2000a,b). A broader distribution of and colours were found for these interacting galaxies than for average field galaxies. Geller et al. (2006) interpreted this result as evidence for bursts of star formation (which shifts the NIR colours blueward) and for a dust-reddened/extincted and/or radiation from hot dust (which in turn results in redder colours). Radiation from hot dust is thought to be responsible for the reddest colours.
Our Hi-selected sample of galaxies provides an interesting comparison to these previous NIR studies based on optically-selected samples. Figure 4 shows a NIR colour-colour plot of the same sources as in Figure 3. The points from our dataset are plotted in grey where 95% of our sources lie within the colour distribution marked by the black solid contour. Also plotted on Figure 4 is a black cross indicating the range of NIR colours for normal galaxies (Geller et al., 2006; Giuricin et al., 1993). The region enclosed by the dotted-lines mark the range of NIR colours found from the NFGS used by Geller et al. (2006) as the benchmark of a normal field galaxy sample.
A simple model was proposed by Geller et al. (2006) to explain qualitatively the distribution of colours observed between the sample of galaxy pairs and the NFGS sample. Their model explained that: (i) dust extinction will redden the intrinsic colour of the galaxies, (ii) emission from bursts of star formation will shift the NIR colours blueward, (iii) re-radiation from hot dust will in general redden the NIR colours, particularly the colours, and (iv) the emission from regions with ionised gas shifts the colours blueward and the colours redward. These effects are summed up in Figure 4 as vector arrows extending away from the median NIR colour of the normal field galaxies.
As can be seen from Figure 4, our dataset is not entirely concentrated within the NIR colour region for the normal galaxies found by Geller et al. (2006) and Giuricin et al. (1993). In total, 41 galaxies (15.5%) of our sample have NIR colours outside the region bounded by the dotted lines in Figure 4. Of the outlying galaxies, 18 galaxies (6.8%) have which suggests the existence of galaxies within our Hi-selected sample that exhibit the effects of star formation and gaseous ionising regions which appear proportionally under-sampled by the optically-based NFGS sample. Although bursts of star formation may be responsible for shifting the colours bluewards, it is not clear why 6 galaxies (2.3%) of our sample are found to have and . No physical mechanism appear to be able to shift the colours blueward and the colours redward simultaneously.
We attribute these unusual NIR colours to the large uncertainties inherent in the measured isophotal magnitudes due to the high background levels of the 2MASS observations. Five of the six galaxies have very low surface brightnesses (with -band magnitudes between 13.0 and 14.9), while the remaining source appears to have a very variable background level. The 2MASS photometry pipeline is susceptible to deriving unphysical NIR colours in galaxies due to contamination by foreground stars and variable background gradients5.
| HIPASS_name | RA_HIPASS (J2000) | Dec_HIPASS (J2000) | Vel_HIPASS (km s-1 ) | W_HIPASS (km s-1 ) | Galactic Latitude (∘) |
|---|---|---|---|---|---|
| HIPASSJ0050+08 | 00:50:06.4 | 08:37:51 | 9972.0 | 124.1 | -54.24 |
| HIPASSJ0358+10 | 03:58:36.1 | 10:03:19 | 1978.0 | 141.2 | -31.36 |
| HIPASSJ0413+21 | 04:13:53.3 | 21:00:08 | 3630.8 | 150.3 | -21.33 |
| HIPASSJ0426+18 | 04:26:41.1 | 18:29:16 | 3974.9 | 64.7 | -20.72 |
| HIPASSJ0443+14 | 04:43:54.9 | 14:19:57 | 2726.3 | 35.9 | -20.03 |
| HIPASSJ0703+03 | 07:03:06.6 | 03:10:47 | 3548.8 | 103.4 | 4.04 |
| HIPASSJ0727+04 | 07:27:39.6 | 04:40:51 | 2087.0 | 120.9 | 10.18 |
| HIPASSJ0758+10 | 07:58:12.7 | 10:59:36 | 2346.0 | 94.5 | 19.75 |
| HIPASSJ0821+03b | 08:21:45.9 | 03:21:04 | 4132.7 | 252.8 | 21.58 |
| HIPASSJ0835+14 | 08:35:15.8 | 14:15:07 | 5899.2 | 176.7 | 29.33 |
| HIPASSJ0836+05 | 08:36:37.5 | 05:14:54 | 1865.6 | 60.4 | 25.74 |
| HIPASSJ1025+20 | 10:25:29.9 | 20:14:24 | 1209.4 | 59.6 | 56.01 |
| HIPASSJ1048+12a | 10:48:00.8 | 12:13:37 | 955.2 | 136.8 | 57.49 |
| HIPASSJ1154+12 | 11:54:16.0 | 12:26:29 | 1004.6 | 47.9 | 70.12 |
| HIPASSJ1327+19 | 13:27:14.3 | 19:51:31 | 7152.4 | 115.0 | 79.04 |
| HIPASSJ1515+05 | 15:15:18.5 | 05:50:20 | 677.7 | 93.1 | 49.73 |
| HIPASSJ1551+08 | 15:51:41.2 | 08:01:23 | 5121.2 | 52.1 | 43.32 |
| HIPASSJ1917+11 | 19:17:24.0 | 11:53:13 | 4542.4 | 38.3 | -0.26 |
| HIPASSJ1919+14 | 19:19:44.4 | 14:05:44 | 2811.9 | 169.0 | 0.27 |
| HIPASSJ1922+18 | 19:22:50.1 | 18:42:50 | 3934.7 | 336.1 | 1.79 |
| HIPASSJ1937+09 | 19:37:31.1 | 09:21:00 | 3148.2 | 81.0 | 61.23 |
| HIPASSJ1949+24 | 19:49:58.4 | 24:10:50 | 3111.1 | 253.6 | -1.05 |
| HIPASSJ2306+14 | 23:06:07.3 | 14:43:10 | 1556.4 | 109.0 | -40.97 |
| HIPASSJ2316+15 | 23:16:54.1 | 15:47:44 | 4491.4 | 78.5 | -41.33 |
| HIPASSJ2347+06 | 23:47:25.0 | 06:47:59 | 3273.2 | 87.6 | -52.70 |
The masking of nearby foreground stars can be
incomplete or not performed in some galaxies and therefore the resultant
photometry for the galaxy will be corrupted. Airglow gradients (from
atmospheric OH airglow emission) in the background levels affect the accuracy
of the measured photometry. This airglow noise is known to vary strongly
with time, spatial position and the size and total brightness of the extended
source. In the -band, the additional uncertainty introduced
by airglow is approximately equivalent to the measurement error666http://www.ipac.caltech.edu/2mass/releases/allsky
/doc/sec1_6c.htmlout.
Therefore, the NIR colours of our Hi-selected sample of galaxies appear largely consistent with the NIR colours of the NFGS sample. We attribute most of the observed scatter in NIR colours within our sample to the uncertainties in the 2MASS photometry. Our sample may also include a greater fraction of star-forming galaxies exhibiting the effects of star formation and ionised gas than the NFGS sample.
2.3 The search for dark galaxies
For the 35% of NOIRCAT sources without optical velocity matches (Flag 5), we attempt to match these sources to sources from previous Hi surveys observed with a smaller spatial beamwidth than 7 arcminutes. For example, observations from the Very Large Array (VLA) with typical beamsizes below an arcminute will provide a suitable sample with which to compare. The combination of a more accurate pointing and the velocity of the Hi emission allow us to pinpoint the exact galaxy from which the emission is observed. Using the same interactive software algorithm detailed in Section 2.1, we classify 87 optically-visible galaxies found with matching Hi velocities as Flag 5a sources (see Table 1).
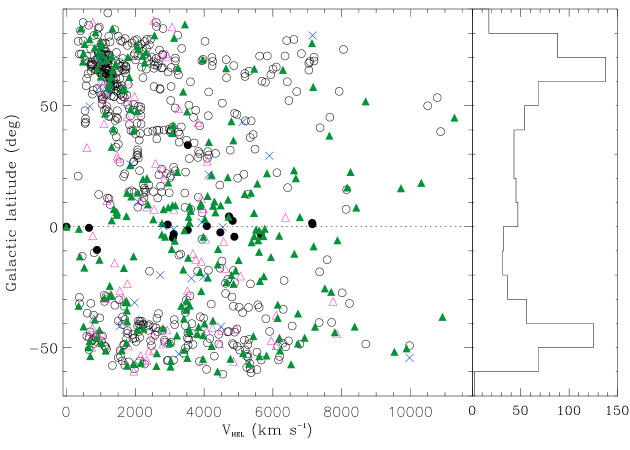
Of the remaining 260 Flag 5 sources, 219 have one or more positional matches with galaxies listed in NED (see Appendix A). We identified these sources to be Flag 5b sources, and the rest of the sources (with no matches within 7.5′ to galaxies in NED) were catalogued as Flag 5c sources. We found 25 Flag 5c sources with possible positional matches to galaxies observed in the POSSII/DSS fields but not listed in NED (see Table 3). The remaining 16 Flag 5c sources for which there were no optically-visible galaxies in the POSSII fields are listed in Table 4. One of the sources (HIPASSJ0843+21) has a bright foreground star saturating the field, while the other 15 are located in crowded stellar fields in the direction of the Galactic plane. The mean Galactic latitude of these 15 sources is .
A consistent result was found by Ryan-Weber et al. (2002), who found optical counterparts for their entire sample except for one HIPASS BGC source, which was located behind the Large Magellanic Cloud (LMC) where the field was too obscured for any identification. Figure 5 shows the Galactic latitude of the NHICAT sources as a function of their measured heliocentric velocity for different types of NOIRCAT matches. Evidently, the distribution of the NOIRCAT galaxies is dominated by the substructure of the Local Universe.
In summary, no dark galaxy candidate has been identified in NOIRCAT. Since there exists 244 galaxies for which a possible optical counterpart can be observed in the POSSII fields, follow-up higher spatial resolution observations with velocity information will pinpoint the exact location of the Hi source. Although we currently cannot rule out the existence of dark galaxy within our sample, the likelihood of their existence is small.
3 Discussion
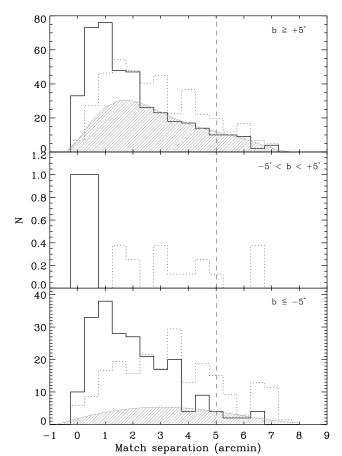
In this section, we examine the effectiveness of our identification process and the reliability of NOIRCAT. Can we statistically estimate how many of our optical matches are due to random matches? We first determine the probability of identifying an optical source due to chance projection of positions on the sky by querying the NED database for 1,000 semi-random source positions chosen one degree away in angular separation (in a random direction) from any NHICAT source position in order to account for the structure and clustering of the Local Universe. Figure 6 presents the sample-normalised distributions of the NOIRCAT match separations (solid line) and those of the semi-random matches (dotted line) divided into three Galactic latitude ranges. The match separation distribution for the semi-random matches have a larger average match separation than the distribution observed for the NOIRCAT matches. It should be noted that only the Flag 1, 2 and 5a NOIRCAT sources are represented in the solid line distributions shown in Figure 6. The observed peaks in the middle panel of Figure 6 are due to the small sample size and are not real.
Assuming that the real match separation distribution does not have a tail and that all match separations greater than five arcminutes are random matches, we fit the tail-end (where match separations is greater than 5 arcminutes) of the NOIRCAT match separation distributions with a scaled-down distribution of the semi-random sample. From this, we can estimate a conservative upper limit on the possible number of random matches within NOIRCAT if the NOIRCAT matching algorithm was entirely based on the two-dimensional positions of the objects on the sky. Figure 7 shows this scaled model distribution of random matches as a grey line-filled distribution which has been scaled-down from the initial distribution of semi-random matches (shown in dotted lines). We find that 248 of the 408 matches in the Northern () NOIRCAT distribution may be due to random matches. Similarly, 58 of 215 matches in the Southern () NOIRCAT distribution may be due to random matches. Each NOIRCAT match along the Galactic equator () is real since the semi-random distribution is completely different to the observed distribution. Table 5 provides a summary these results. Therefore, the upper limit on the number of NOIRCAT matches resulting from a chance projected alignment on the sky (if our matching algorithm was based solely on the positions of the sources) is 48%.

| HIPASS name | RA (J2000) | Dec (J2000) | VelHEL (km s-1 ) | W (km s-1 ) | Gal_Lat (deg) |
|---|---|---|---|---|---|
| HIPASSJ0542+11 | 05:42:43.6 | 11:27:29 | 887.3 | 109.4 | -9.61 |
| HIPASSJ0608+13 | 06:08:35.7 | 13:06:50 | 5650.8 | 66.2 | -3.30 |
| HIPASSJ0636+04 | 06:36:48.2 | 04:02:12 | 3526.1 | 191.0 | -1.41 |
| HIPASSJ0843+21† | 08:43:14.6 | 21:29:23 | 3527.6 | 146.1 | 33.72 |
| HIPASSJ1853+09 | 18:53:58.0 | 09:51:52 | 4731.7 | 331.9 | 3.92 |
| HIPASSJ1900+13 | 19:00:02.1 | 13:30:32 | 4724.8 | 96.7 | 4.25 |
| HIPASSJ1901+06 | 19:01:35.4 | 06:52:00 | 2942.2 | 79.8 | 0.88 |
| HIPASSJ1914+10 | 19:14:58.4 | 10:17:37 | 654.7 | 81.6 | -0.47 |
| HIPASSJ1919+18 | 19:19:53.7 | 18:47:37 | 4830.6 | 118.8 | 2.44 |
| HIPASSJ1921+14 | 19:21:35.8 | 14:54:15 | 4080.3 | 81.7 | 0.25 |
| HIPASSJ1922+08 | 19:22:10.4 | 08:13:21 | 3119.8 | 112.5 | -3.01 |
| HIPASSJ1927+20 | 19:27:31.5 | 20:13:41 | 7141.0 | 72.4 | 1.53 |
| HIPASSJ1929+08 | 19:29:09.1 | 08:06:27 | 3092.7 | 225.6 | -4.59 |
| HIPASSJ1937+23 | 19:37:06.8 | 23:15:34 | 7148.5 | 161.7 | 1.04 |
| HIPASSJ1942+18 | 19:42:45.1 | 18:40:58 | 4473.0 | 127.0 | -2.36 |
| HIPASSJ1950+18a | 19:50:40.8 | 18:20:05 | 4879.6 | 152.2 | -4.16 |
† This source has a foreground star saturating its optical field.
| Region | Total NOIRCAT matches | Real | Random |
|---|---|---|---|
| 408 | 162 | 246 | |
| 2 | 2 | 0 | |
| 215 | 161 | 54 |
However, 74% of NOIRCAT have matches in position as well as in velocity. The inclusion of velocity provides a better discriminant between real and spurious matches. Although we use a very loose km s-1 velocity offset to allow for possible matches, the average velocity difference (between the HIPASS and optical/IR velocities) is 22 km s-1. To estimate the probability of a random velocity match, we query the NED database with 1,000 semi-random positions chosen one degree away in angular separation from a random NHICAT source position and set our random object’s velocity at the velocity of the NHICAT source. Both position and velocity will be used to determine a match. Even though a velocity offset of 400 km s-1 appears very generous match criterion, we find that only 40 of our 1,000 semi-random sources were matched to objects within the NED database. Figure 8 compares the cumulative distributions of the match velocity difference for NOIRCAT (solid line) and for the randomly-matched sample (dashed line). As shown 99.8% of the NOIRCAT sample with unique optical/IR source identification have match velocity offsets below 200 km s-1. The average velocity offset of the semi-random sample is 189 km s-1.

For a conservative estimate of the number of random matches within NOIRCAT, we now assume that the real velocity offset distribution does not have a tail and that all velocity offsets greater than 100 km s-1 can be attributed to a random velocity match. Similar to the previous test, we fit the tail-end (where velocity offsets are greater than 100 km s-1) of the NOIRCAT velocity offset distribution with a scaled-down distribution of the semi-random sample. From this model of semi-random matches, we find that there is a 1.5% probability that the Flag 1, 2 and 5a NOIRCAT sources may be due to random velocity matches. In summary, if we only used the source positions as a matching criteria then there is a 0.48 probability that a match is random. However, the inclusion of velocity as a match criteria significantly decreases the probability to 0.015 that a match made within NOIRCAT is spurious.
 |
 |
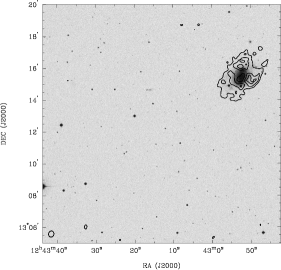 |
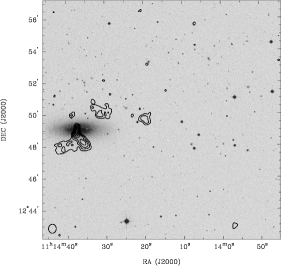
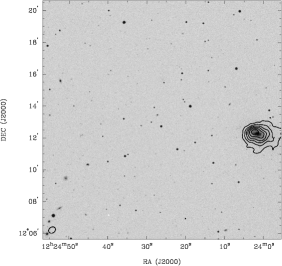
Although the positional accuracy is 3′, we found 36 Flag 1 and 2 sources with match angular separations greater than 5.0′. Of these, we found three with previous VLA observations listed in the NRAO Archive777The National Radio Astronomy Observatory is a facility of the National Science Foundation operated under cooperative agreement by Associated Universities, Inc. Figure 9 shows the VLA integrated flux contours overlaid on POSS II optical fields for these three NOIRCAT sources. These three sources (HIPASSJ1114+12, HIPASSJ1224+12 & HIPASSJ1243+13a) have match separations of 5.3′, 6.1′ and 6.3′, respectively. García-Burillo et al. (2000) suggested that HIPASSJ1114+12’s optical counterpart, NGC 3593, had accreted a gas-rich dwarf 1 Gyr ago and recent stars had time to form a central counter-rotating disk in the settling gas. For both HIPASSJ1224+12 and HIPASSJ1243+13a, the optical counterparts (NGC 4351 & NGC 4639) are part of the Virgo Cluster.
Using the MBSPECT tool of the Miriad data reduction package, we measure the total integrated flux () and velocity width () from the VLA observations. As detailed in Table 6, the HIPASS integrated fluxes () and the FWHM velocity widths () are very different to those measured from the VLA observations.
| HIPASS name | ||||
|---|---|---|---|---|
| Jy km s-1 | km s-1 | Jy km s-1 | km s-1 | |
| J1114+12 | 0.43 | 44.0 | 14.1 | 215.1 |
| J1224+12 | 8.79 | 210.3 | 5.3 | 109.3 |
| J1243+13a | 1.93 | 70.9 | 35.2 | 331.0 |
The Hi total integrated flux observed by the VLA of HIPASSJ1114+12 is less than of the total flux measured by HIPASS. Additionally, the HIPASS velocity width is five times greater than the velocity width detected by the VLA. This suggests that most of the Hi emission measured by HIPASS in HIPASSJ1114+12 is diffuse and remains undetected by the VLA due to the lack of sensitivity at low column densities. This can also explain the difference in the total integrated flux measured by HIPASS and the VLA of HIPASS1243+13a.
Conversely, the VLA has observed more Hi integrated flux and a greater Hi velocity width than HIPASS in HIPASSJ1224+12. Due to the strong radio emission from Virgo A (a Seyfert galaxy and a strong radio source), half of the emission profile was lost in the noise. Thus, we would expect that re-fitting the baseline would recover this flux. Figure 10 shows the HIPASS spectra of the three sources listed in Table 6.
4 Summary
In this paper we have presented NOIRCAT, the optical/near-infrared counterpart catalogue to NHICAT. NOIRCAT contains optically-matched counterparts for of the NHICAT sources. In combination with HOPCAT, NOIRCAT creates the largest catalogue of optical counterparts of Hi sources, covering the entire sky in the declination range of .
Of the 347 Flag 5 sources, have optical counterparts with matching velocities in previously-published radio emission-line observations. Another have probable optical counterparts to galaxies without published velocities (other than HIPASS observations). Although our estimates in Section 3 showed that more than half these matches should be real, only follow-up higher spatial resolution Hi observations of these sources will help pinpoint the exact Hi position and constrain the possible number of dark galaxies. Many of the Flag 5c sources lie in the direction of the Galactic plane and as such, are obscured behind our Galaxy.
Our statistical analysis indicated that up to 1.5% of the NOIRCAT matches may be due to random matches. It is not possible to determine the exact number of matches from the current sample as more observations at better sensitivities and higher resolution are required.
Ignoring the effects of mergers, Verde et al. (2002) postulated that a large fraction of low-mass halos ( ) will be Toomre-stable and not form stars if the gas collapse during galaxy formation conserves angular momentum. In addition, simulations by Davies et al. (2006) predicted that ‘objects with scale sizes of tens of kpc and velocities of a few hundreds of km s-1can remain dark’. Contrary to these results, Taylor & Webster (2005) found that a majority of disks are predicted to be unstable and likely to form stars in at least half the hypothetical dark galaxies with baryon masses greater than . Standard reionisation models also propose that dark halos do not contain gas (Susa & Umemura, 2004).
 |
 |
 |
Although our statistical analysis with our current dataset cannot confirm the number of possible dark galaxy candidates within NOIRCAT, detailed dark galaxy modelling by Taylor & Webster (2009) on the NHICAT completeness limits found that there could be dark galaxies within NHICAT. These galaxies would be at the predicted limiting threshold for the formation of stars, if they formed. Hence, further observations of the Flag 5b and 5c sources may confirm the existence of these galaxies unless they are located in the direction of the Galactic plane.
As with other HIPASS catalogues, NOIRCAT will be publicly-available online at: http://hipass.aus-vo.org. We will also submit NOIRCAT to the NED database. Sources classified as Flags 1, 2, 3, 4 and 5a are included in the official NOIRCAT online.
Chapter \thechapter Acknowledgments.
We thank the anonymous referee for providing detailed and constructive comments which greatly improved this paper. This research has made use of the NASA/IPAC Extragalactic Database (NED) which is operated by the Jet Propulsion Laboratory, California Institute of Technology, under contract with the National Aeronautics and Space Administration. This research has also made use of data products from the Two Micron All Sky Survey, which is a joint project of the University of Massachusetts and the Infrared Processing and Analysis Center/California Institute of Technology, funded by the National Aeronautics and Space Administration and the National Science Foundation. O.I.W. thanks Marianne Doyle and Mike Read for their help in acquiring the POSSII image fields as well as Stuart Wyithe for his comments and ideas about dark galaxies with respect to current reionisation models.
References
- Barnes et al. (2001) Barnes D. G., Staveley-Smith L., de Blok W. J. G., Oosterloo T., Stewart I. M., Wright A. E., Banks G. D., Bhathal R., et al. 2001, MNRAS, 322, 486
- Bell & de Jong (2001) Bell E. F., de Jong R. S., 2001, ApJ, 550, 212
- Bell et al. (2003) Bell E. F., McIntosh D. H., Katz N., Weinberg M. D., 2003, ApJS, 149, 289
- Bertin & Arnouts (1996) Bertin E., Arnouts S., 1996, A&AS, 117, 393
- Chengalur et al. (1995) Chengalur J. N., Giovanelli R., Haynes M. P., 1995, AJ, 109, 2415
- Davies et al. (2006) Davies J. I., Disney M. J., Minchin R. F., Auld R., Smith R., 2006, MNRAS, 368, 1479
- Disney (1976) Disney M. J., 1976, Nat, 263, 573
- Doyle et al. (2005) Doyle M. T., Drinkwater M. J., Rohde D. J., Pimbblet K. A., Read M., Meyer M. J., Zwaan M. A., Ryan-Weber E., et al. 2005, MNRAS, 361, 34
- García-Burillo et al. (2000) García-Burillo S., Sempere M. J., Combes F., Hunt L. K., Neri R., 2000, A&A, 363, 869
- Geller et al. (2006) Geller M. J., Kenyon S. J., Barton E. J., Jarrett T. H., Kewley L. J., 2006, AJ, 132, 2243
- Giovanelli & Haynes (1989) Giovanelli R., Haynes M. P., 1989, ApJ, 346, L5
- Giuricin et al. (1993) Giuricin G., Biviano A., Girardi M., Mardirossian F., Mezzetti M., 1993, A&A, 275, 390
- Hanish et al. (2006) Hanish D. J., Meurer G. R., Ferguson H. C., Zwaan M. A., Heckman T. M., Staveley-Smith L., Bland-Hawthorn J., Kilborn V. A., et al. 2006, ApJ, 649, 150
- Jansen et al. (000a) Jansen R. A., Fabricant D., Franx M., Caldwell N., 2000a, ApJS, 126, 331
- Jansen et al. (000b) Jansen R. A., Franx M., Fabricant D., Caldwell N., 2000b, ApJS, 126, 271
- Jarrett (2007) Jarrett T., 2007, Masking of 2MASS images with nearby foreground stars, private communication
- Kilborn et al. (2006) Kilborn V. A., Forbes D. A., Koribalski B. S., Brough S., Kern K., 2006, MNRAS, 371, 739
- Kilborn et al. (2000) Kilborn V. A., Staveley-Smith L., Marquarding M., Webster R. L., Malin D. F., Banks G. D., Bhathal R., de Blok W. J. G., et al. 2000, AJ, 120, 1342
- Kilborn et al. (2002) Kilborn V. A., Webster R. L., Staveley-Smith L., Marquarding M., Banks G. D., Barnes D. G., Bhathal R., de Blok W. J. G., Boyce P. J., et al. 2002, AJ, 124, 690
- Klypin et al. (1999) Klypin A., Gottlöber S., Kravtsov A. V., Khokhlov A. M., 1999, ApJ, 516, 530
- Koribalski et al. (2004) Koribalski B. S., Staveley-Smith L., Kilborn V. A., Ryder S. D., Kraan-Korteweg R. C., Ryan-Weber E. V., Ekers R. D., Jerjen H., et al. 2004, AJ, 128, 16
- Meurer et al. (1996) Meurer G. R., Carignan C., Beaulieu S. F., Freeman K. C., 1996, AJ, 111, 1551
- Meyer et al. (2004) Meyer M. J., Zwaan M. A., Webster R. L., Staveley-Smith L., Ryan-Weber E., Drinkwater M. J., Barnes D. G., Howlett M., et al. 2004, MNRAS, 350, 1195(MZ04)
- Moore et al. (1999) Moore B., Ghigna S., Governato F., Lake G., Quinn T., Stadel J., Tozzi P., 1999, ApJ, 524, L19
- Reid et al. (1991) Reid I. N., Brewer C., Brucato R. J., McKinley W. R., Maury A., Mendenhall D., Mould J. R., Mueller J., et al. 1991, PASP, 103, 661
- Roberts (1962) Roberts M. S., 1962, AJ, 67, 437
- Ryan-Weber et al. (2002) Ryan-Weber E., Koribalski B. S., Staveley-Smith L., Jerjen H., Kraan-Korteweg R. C., Ryder S. D., Barnes D. G., de Blok W. J. G., et al. 2002, AJ, 124, 1954
- Ryder et al. (2001) Ryder S. D., Koribalski B., Staveley-Smith L., Kilborn V. A., Malin D. F., Banks G. D., Barnes D. G., Bhatal R., et al. 2001, ApJ, 555, 232
- Schneider (1996) Schneider S. E., 1996, in Skillman E. D., ed., ASP Conf. Ser. 106: The Minnesota Lectures on Extragalactic Neutral Hydrogen HI Selection Effects and the Galaxy Mass Function. pp 323–+
- Schneider et al. (1983) Schneider S. E., Helou G., Salpeter E. E., Terzian Y., 1983, ApJ, 273, L1
- Susa & Umemura (2004) Susa H., Umemura M., 2004, ApJ, 610, L5
- Taylor & Webster (2005) Taylor E. N., Webster R. L., 2005, ApJ, 634, 1067
- Taylor & Webster (2009) Taylor E. N., Webster R. L., 2009, On star formation and the existence of dark galaxies, in preparation
- Turner & MacFadyen (1997) Turner N. J. J., MacFadyen A., 1997, MNRAS, 285, 125
- Verde et al. (2002) Verde L., Oh S. P., Jimenez R., 2002, MNRAS, 336, 541
- Wong et al. (2006) Wong O. I., Ryan-Weber E. V., Garcia-Appadoo D. A., Webster R. L., Staveley-Smith L., Zwaan M. A., Meyer M. J., Barnes D. G., et al. 2006, MNRAS, pp 911–+
Appendix A NHICAT properties of 221 Flag 5b sources for which NED had 1 or more sources which were classified as galaxies with positional matches only
| HIPASS_name | RA_HIPASS (J2000) | Dec_HIPASS (J2000) | Vel_HIPASS (km s-1 ) | W_HIPASS (km s-1 ) |
|---|---|---|---|---|
| HIPASSJ0003+08 | 00:03:14.6 | 08:42:34 | 2626.7 | 139.1 |
| HIPASSJ0003+15 | 00:03:58.4 | 15:11:59 | 873.8 | 100.6 |
| HIPASSJ0010+13 | 00:10:42.8 | 13:43:57 | 1740.5 | 76.4 |
| HIPASSJ0014+07 | 00:14:39.8 | 07:30:58 | 3513.9 | 108.2 |
| HIPASSJ0016+07 | 00:16:54.8 | 07:12:06 | 3967.5 | 402.3 |
| HIPASSJ0017+04 | 00:17:01.1 | 04:55:42 | 6528.2 | 501.3 |
| HIPASSJ0019+04 | 00:19:28.3 | 04:04:42 | 3023.8 | 543.1 |
| HIPASSJ0020+08 | 00:20:06.4 | 08:28:58 | 5604.5 | 67.0 |
| HIPASSJ0020+10 | 00:20:03.0 | 10:53:16 | 1142.4 | 134.3 |
| HIPASSJ0021+08 | 00:21:00.9 | 08:35:06 | 693.1 | 41.3 |
| HIPASSJ0028+11 | 00:28:54.3 | 11:18:15 | 6207.9 | 81.3 |
| HIPASSJ0033+02 | 00:33:44.3 | 02:40:37 | 4389.2 | 225.9 |
| HIPASSJ0109+13 | 01:09:57.9 | 13:18:37 | 4219.4 | 166.5 |
| HIPASSJ0120+05 | 01:20:20.7 | 05:49:57 | 2165.0 | 82.8 |
| HIPASSJ0121+12 | 01:21:20.6 | 12:25:35 | 642.7 | 119.1 |
| HIPASSJ0129+10 | 01:29:33.0 | 10:00:01 | 9530.9 | 93.3 |
| HIPASSJ0131+23 | 01:31:21.7 | 23:54:22 | 3413.0 | 61.5 |
| HIPASSJ0133+14 | 01:33:13.0 | 14:23:11 | 671.0 | 78.0 |
| HIPASSJ0134+04 | 01:34:53.5 | 04:24:17 | 1959.5 | 108.1 |
| HIPASSJ0142+02 | 01:42:28.4 | 02:56:20 | 1763.9 | 80.6 |
| HIPASSJ0143+19 | 01:43:15.9 | 19:58:20 | 496.7 | 71.7 |
| HIPASSJ0158+04 | 01:58:05.1 | 04:21:43 | 4765.3 | 312.4 |
| HIPASSJ0210+06 | 02:10:41.4 | 06:46:27 | 1604.0 | 103.3 |
| HIPASSJ0211+14 | 02:11:49.9 | 14:11:42 | 3812.7 | 58.9 |
| HIPASSJ0221+14 | 02:21:52.1 | 14:19:27 | 3586.3 | 51.7 |
| HIPASSJ0237+12 | 02:37:26.3 | 12:31:07 | 960.2 | 50.9 |
| HIPASSJ0239+12 | 02:39:29.9 | 12:41:25 | 3554.1 | 154.2 |
| HIPASSJ0243+16 | 02:43:16.8 | 16:45:37 | 821.4 | 44.8 |
| HIPASSJ0247+03 | 02:47:55.9 | 03:53:38 | 1024.6 | 90.5 |
| HIPASSJ0250+03 | 02:50:56.6 | 03:22:08 | 3009.1 | 46.5 |
| HIPASSJ0251+06 | 02:51:32.0 | 06:02:30 | 6921.3 | 111.5 |
| HIPASSJ0253+02 | 02:53:48.6 | 02:20:42 | 6731.0 | 349.4 |
| HIPASSJ0253+06 | 02:53:09.3 | 06:32:03 | 5431.5 | 328.9 |
| HIPASSJ0314+24 | 03:14:22.0 | 24:10:20 | 1303.8 | 143.9 |
| HIPASSJ0320+17 | 03:20:24.3 | 17:18:56 | 355.2 | 74.2 |
| HIPASSJ0332+15 | 03:32:18.4 | 15:26:35 | 6141.0 | 123.1 |
| HIPASSJ0339+08 | 03:39:33.5 | 08:31:37 | 6728.9 | 110.3 |
| HIPASSJ0340+05 | 03:40:51.5 | 05:22:08 | 6137.2 | 65.2 |
| HIPASSJ0341+24 | 03:41:19.2 | 24:00:54 | 1259.6 | 110.3 |
| HIPASSJ0341+18 | 03:41:53.5 | 18:07:21 | 1296.8 | 45.3 |
| HIPASSJ0345+08 | 03:45:11.7 | 08:51:12 | 1755.6 | 40.9 |
| HIPASSJ0345+02 | 03:45:36.6 | 02:12:00 | 4256.7 | 75.1 |
| HIPASSJ0354+06 | 03:54:41.4 | 06:37:15 | 3470.4 | 249.8 |
| HIPASSJ0413+24 | 04:13:29.7 | 24:50:23 | 3877.4 | 130.3 |
| HIPASSJ0414+02 | 04:14:24.5 | 02:46:54 | 3336.4 | 270.8 |
| HIPASSJ0415+02 | 04:15:41.3 | 02:28:45 | 3584.6 | 140.6 |
| HIPASSJ0417+13 | 04:17:55.1 | 13:30:32 | 7510.4 | 396.3 |
| HIPASSJ0421+10 | 04:21:10.1 | 10:09:26 | 7694.7 | 93.6 |
| HIPASSJ0428+18 | 04:28:50.7 | 18:57:19 | 4793.7 | 87.5 |
| HIPASSJ0431+07 | 04:31:07.3 | 07:24:28 | 3917.2 | 104.9 |
| HIPASSJ0432+16 | 04:32:42.8 | 16:12:18 | 4107.1 | 44.6 |
| HIPASSJ0446+08 | 04:46:31.4 | 08:18:58 | 4651.7 | 241.8 |
| HIPASSJ0503+18 | 05:03:14.4 | 18:24:56 | 5005.8 | 389.1 |
| HIPASSJ0506+25 | 05:06:50.7 | 25:12:46 | 3059.7 | 254.5 |
| HIPASSJ0508+10 | 05:08:49.5 | 10:45:00 | 1669.1 | 555.1 |
| HIPASSJ0519+22 | 05:19:44.1 | 22:56:38 | 7182.5 | 314.9 |
| HIPASSJ0520+17 | 05:20:50.9 | 17:02:24 | 6621.8 | 168.8 |
| HIPASSJ0524+04 | 05:24:58.6 | 04:31:11 | 519.3 | 166.5 |
| HIPASSJ0524+07 | 05:24:18.8 | 07:23:46 | 4395.3 | 106.7 |
| HIPASSJ0527+15 | 05:27:42.9 | 15:52:52 | 5598.2 | 161.2 |
| HIPASSJ0531+08 | 05:31:05.6 | 08:20:12 | 961.0 | 90.1 |
| HIPASS_name | RA_HIPASS (J2000) | Dec_HIPASS (J2000) | Vel_HIPASS (km s-1 ) | W_HIPASS (km s-1 ) |
|---|---|---|---|---|
| HIPASSJ0544+04 | 05:44:24.9 | 04:13:03 | 3537.2 | 66.7 |
| HIPASSJ0545+05 | 05:45:02.0 | 05:04:09 | 387.8 | 122.0 |
| HIPASSJ0547+17 | 05:47:07.9 | 17:35:07 | 5571.2 | 90.9 |
| HIPASSJ0554+18 | 05:54:10.1 | 18:00:42 | 5726.2 | 46.7 |
| HIPASSJ0556+13 | 05:56:26.8 | 13:40:07 | 7877.4 | 264.9 |
| HIPASSJ0559+15 | 05:59:53.0 | 15:36:00 | 5454.9 | 196.8 |
| HIPASSJ0603+08 | 06:03:49.3 | 08:38:43 | 5380.5 | 206.6 |
| HIPASSJ0605+19 | 06:05:26.6 | 19:29:32 | 5763.3 | 286.2 |
| HIPASSJ0620+20 | 06:20:36.1 | 20:10:49 | 1318.0 | 138.1 |
| HIPASSJ0621+11 | 06:21:18.5 | 11:06:52 | 5602.4 | 195.6 |
| HIPASSJ0622+11 | 06:22:49.2 | 11:08:28 | 5509.4 | 384.1 |
| HIPASSJ0623+04 | 06:23:52.1 | 04:16:55 | 2867.8 | 102.5 |
| HIPASSJ0624+23 | 06:24:35.3 | 23:21:20 | 1464.1 | 72.8 |
| HIPASSJ0626+24 | 06:26:39.8 | 24:40:18 | 1473.2 | 99.2 |
| HIPASSJ0630+23 | 06:30:04.1 | 23:34:08 | 1452.4 | 135.4 |
| HIPASSJ0630+08 | 06:30:09.2 | 08:21:16 | 363.7 | 53.4 |
| HIPASSJ0630+16 | 06:30:08.5 | 16:47:50 | 2526.4 | 275.1 |
| HIPASSJ0631+02 | 06:31:12.9 | 02:44:05 | 2774.1 | 114.7 |
| HIPASSJ0633+21 | 06:33:12.5 | 21:02:15 | 5451.5 | 467.6 |
| HIPASSJ0635+20 | 06:35:32.9 | 20:36:31 | 4329.3 | 269.4 |
| HIPASSJ0635+11 | 06:35:47.6 | 11:13:11 | 3575.4 | 76.6 |
| HIPASSJ0635+14 | 06:35:52.7 | 14:36:39 | 4023.3 | 347.5 |
| HIPASSJ0637+03 | 06:37:39.3 | 03:24:50 | 3428.5 | 159.8 |
| HIPASSJ0637+22 | 06:37:56.1 | 22:39:24 | 1380.5 | 114.0 |
| HIPASSJ0645+22 | 06:45:42.5 | 22:25:58 | 4482.1 | 195.0 |
| HIPASSJ0656+06b | 06:56:27.1 | 06:14:42 | 6783.4 | 228.5 |
| HIPASSJ0704+13 | 07:04:55.2 | 13:56:18 | 2367.5 | 53.1 |
| HIPASSJ0705+02 | 07:05:43.6 | 02:37:12 | 1744.6 | 46.3 |
| HIPASSJ0710+05 | 07:10:09.9 | 05:16:33 | 3609.1 | 139.6 |
| HIPASSJ0714+06 | 07:14:00.6 | 06:18:00 | 8422.1 | 139.7 |
| HIPASSJ0730+07 | 07:30:02.3 | 07:14:41 | 3920.0 | 94.0 |
| HIPASSJ0731+08 | 07:31:16.0 | 08:00:01 | 1882.9 | 55.2 |
| HIPASSJ0755+03 | 07:55:52.3 | 03:27:05 | 9720.8 | 93.4 |
| HIPASSJ0818+04 | 08:18:14.2 | 04:37:29 | 4221.7 | 52.2 |
| HIPASSJ0831+07 | 08:31:31.0 | 07:00:18 | 1850.8 | 128.2 |
| HIPASSJ0901+21 | 09:01:20.5 | 21:13:10 | 7641.6 | 86.5 |
| HIPASSJ0905+21 | 09:05:26.9 | 21:38:58 | 3073.6 | 107.0 |
| HIPASSJ0908+05a | 09:08:12.9 | 05:55:02 | 1313.7 | 71.4 |
| HIPASSJ0922+03 | 09:22:25.6 | 03:51:36 | 4139.3 | 128.9 |
| HIPASSJ0942+04 | 09:42:46.9 | 04:49:53 | 1955.0 | 66.2 |
| HIPASSJ1003+11 | 10:03:15.9 | 11:29:33 | 3501.6 | 52.8 |
| HIPASSJ1027+24 | 10:27:07.6 | 24:10:09 | 1211.8 | 52.5 |
| HIPASSJ1031+25 | 10:31:34.9 | 25:16:07 | 1282.3 | 125.4 |
| HIPASSJ1034+23 | 10:34:38.9 | 23:03:06 | 1238.0 | 49.3 |
| HIPASSJ1052+07 | 10:52:59.4 | 07:37:52 | 3392.0 | 80.2 |
| HIPASSJ1106+19 | 11:06:02.6 | 19:49:15 | 1334.9 | 38.3 |
| HIPASSJ1113+21 | 11:13:43.0 | 21:34:37 | 1440.2 | 164.6 |
| HIPASSJ1119+03 | 11:19:10.4 | 03:36:02 | 7169.7 | 202.7 |
| HIPASSJ1119+09 | 11:19:16.4 | 09:34:56 | 995.2 | 69.9 |
| HIPASSJ1122+13 | 11:22:33.2 | 13:40:32 | 896.3 | 51.4 |
| HIPASSJ1129+11 | 11:29:44.4 | 11:58:38 | 3240.9 | 94.6 |
| HIPASSJ1130+23 | 11:30:48.2 | 23:05:26 | 2912.0 | 179.8 |
| HIPASSJ1137+18 | 11:37:29.7 | 18:22:18 | 946.0 | 41.1 |
| HIPASSJ1148+23 | 11:48:55.2 | 23:48:54 | 528.2 | 101.1 |
| HIPASSJ1204+16 | 12:04:00.7 | 16:30:43 | 2063.9 | 173.6 |
| HIPASSJ1205+21 | 12:05:10.1 | 21:29:07 | 3128.5 | 37.3 |
| HIPASSJ1209+14 | 12:09:56.3 | 14:20:57 | 820.0 | 52.6 |
| HIPASSJ1213+16 | 12:13:03.1 | 16:11:21 | 7135.9 | 83.5 |
| HIPASSJ1214+09 | 12:14:41.5 | 09:11:45 | 1784.3 | 121.9 |
| HIPASSJ1215+09b | 12:15:53.0 | 09:40:01 | 2219.4 | 35.6 |
| HIPASSJ1215+12 | 12:15:26.5 | 12:59:54 | 2090.3 | 36.0 |
| HIPASSJ1218+07 | 12:18:23.0 | 07:39:09 | 3956.6 | 150.4 |
| HIPASSJ1219+06b | 12:19:53.6 | 06:39:42 | 480.7 | 41.5 |
| HIPASS_name | RA_HIPASS (J2000) | Dec_HIPASS (J2000) | Vel_HIPASS (km s-1 ) | W_HIPASS (km s-1 ) |
|---|---|---|---|---|
| HIPASSJ1230+09 | 12:30:22.3 | 09:31:28 | 495.9 | 69.5 |
| HIPASSJ1230+17 | 12:30:06.6 | 17:24:52 | 2556.1 | 282.9 |
| HIPASSJ1231+20 | 12:31:44.5 | 20:23:28 | 1332.1 | 68.6 |
| HIPASSJ1234+15 | 12:34:41.7 | 15:12:11 | 671.1 | 91.2 |
| HIPASSJ1240+13 | 12:40:01.5 | 13:50:48 | 1004.3 | 40.2 |
| HIPASSJ1242+05 | 12:42:43.3 | 05:46:12 | 989.1 | 106.0 |
| HIPASSJ1243+07 | 12:43:13.1 | 07:37:56 | 1314.7 | 66.8 |
| HIPASSJ1244+12 | 12:44:07.0 | 12:08:52 | 1008.1 | 111.7 |
| HIPASSJ1250+17 | 12:50:22.7 | 17:30:18 | 843.5 | 116.9 |
| HIPASSJ1256+19 | 12:56:04.9 | 19:07:38 | 418.4 | 33.0 |
| HIPASSJ1314+23 | 13:14:11.2 | 23:11:30 | 3441.9 | 76.6 |
| HIPASSJ1327+10 | 13:27:18.7 | 10:03:17 | 1050.0 | 50.8 |
| HIPASSJ1336+08 | 13:36:04.2 | 08:51:39 | 1159.4 | 130.8 |
| HIPASSJ1355+17 | 13:55:22.9 | 17:47:24 | 956.7 | 97.5 |
| HIPASSJ1403+09 | 14:03:21.3 | 09:25:34 | 4638.5 | 43.9 |
| HIPASSJ1404+08a | 14:04:15.4 | 08:47:43 | 6289.2 | 55.2 |
| HIPASSJ1406+22 | 14:06:56.0 | 22:04:40 | 2320.0 | 122.3 |
| HIPASSJ1415+16 | 14:15:38.2 | 16:32:48 | 2270.6 | 90.0 |
| HIPASSJ1420+08 | 14:20:54.4 | 08:40:24 | 1298.0 | 81.9 |
| HIPASSJ1435+05 | 14:35:24.0 | 05:17:26 | 1636.3 | 96.0 |
| HIPASSJ1435+13 | 14:35:37.9 | 13:02:19 | 1827.0 | 227.9 |
| HIPASSJ1436+21 | 14:36:36.3 | 21:02:51 | 5458.5 | 291.9 |
| HIPASSJ1445+07 | 14:45:16.0 | 07:52:49 | 1690.6 | 38.3 |
| HIPASSJ1526+14 | 15:26:22.1 | 14:25:11 | 8694.9 | 136.8 |
| HIPASSJ1538+12a | 15:38:18.2 | 12:58:47 | 1860.5 | 158.2 |
| HIPASSJ1545+12 | 15:45:42.6 | 12:30:40 | 1122.5 | 110.4 |
| HIPASSJ1548+16 | 15:48:58.1 | 16:43:14 | 2051.9 | 94.5 |
| HIPASSJ1557+14 | 15:57:56.1 | 14:58:41 | 11276.2 | 62.4 |
| HIPASSJ1604+14 | 16:04:10.8 | 14:37:54 | 4793.0 | 111.5 |
| HIPASSJ1606+08 | 16:06:14.9 | 08:29:46 | 1362.9 | 145.9 |
| HIPASSJ1614+02 | 16:14:14.1 | 02:30:46 | 4852.8 | 78.3 |
| HIPASSJ1621+20 | 16:21:38.7 | 20:52:25 | 3100.6 | 128.1 |
| HIPASSJ1735+02 | 17:35:34.7 | 02:46:46 | 10311.9 | 139.3 |
| HIPASSJ1736+15 | 17:36:49.7 | 15:12:00 | 6613.4 | 45.2 |
| HIPASSJ1747+04 | 17:47:06.5 | 04:11:58 | 8158.7 | 80.9 |
| HIPASSJ1747+18 | 17:47:31.8 | 18:18:00 | 5827.3 | 57.7 |
| HIPASSJ1750+21 | 17:50:13.4 | 21:15:50 | 3221.7 | 82.4 |
| HIPASSJ1752+22 | 17:52:56.0 | 22:54:44 | 8255.3 | 143.2 |
| HIPASSJ1754+02 | 17:54:40.9 | 02:55:07 | 1761.7 | 187.1 |
| HIPASSJ1758+14 | 17:58:46.7 | 14:47:43 | 2957.5 | 133.8 |
| HIPASSJ1804+21 | 18:04:37.7 | 21:39:04 | 2224.0 | 196.6 |
| HIPASSJ1805+17 | 18:05:05.9 | 17:19:09 | 5548.3 | 149.7 |
| HIPASSJ1805+23a | 18:05:31.2 | 23:13:00 | 2339.6 | 101.4 |
| HIPASSJ1805+23b | 18:05:57.2 | 23:26:38 | 6666.8 | 58.6 |
| HIPASSJ1807+09 | 18:07:57.2 | 09:46:19 | 2070.0 | 150.5 |
| HIPASSJ1807+25 | 18:07:22.0 | 25:19:41 | 4688.0 | 126.2 |
| HIPASSJ1817+14 | 18:17:07.7 | 14:25:02 | 5362.7 | 200.5 |
| HIPASSJ1819+14 | 18:19:56.8 | 14:40:45 | 5181.1 | 132.5 |
| HIPASSJ1828+06 | 18:28:49.8 | 06:32:26 | 2957.3 | 158.5 |
| HIPASSJ1832+06 | 18:32:12.6 | 06:25:06 | 2823.3 | 90.6 |
| HIPASSJ1833+10 | 18:33:29.4 | 10:38:48 | 3165.1 | 158.1 |
| HIPASSJ1837+11 | 18:37:37.3 | 11:55:17 | 3584.4 | 80.9 |
| HIPASSJ1837+22 | 18:37:45.3 | 22:04:32 | 4101.0 | 132.2 |
| HIPASSJ1839+13 | 18:39:35.3 | 13:19:21 | 3892.9 | 151.4 |
| HIPASSJ1842+17 | 18:42:53.8 | 17:02:14 | 3909.8 | 89.4 |
| HIPASSJ1842+15 | 18:42:58.3 | 15:00:29 | 4263.6 | 36.6 |
| HIPASSJ1843+19 | 18:43:27.2 | 19:26:41 | 4300.7 | 206.1 |
| HIPASSJ1846+22 | 18:46:11.3 | 22:36:24 | 4698.6 | 316.5 |
| HIPASSJ1849+18 | 18:49:55.0 | 18:44:16 | 3081.8 | 130.0 |
| HIPASSJ1912+13 | 19:12:37.3 | 13:23:54 | 2776.7 | 112.2 |
| HIPASSJ1915+20 | 19:15:00.4 | 20:11:43 | 4710.3 | 545.6 |
| HIPASSJ1917+04 | 19:17:39.1 | 04:27:21 | 6182.8 | 167.2 |
| HIPASS_name | RA_HIPASS (J2000) | Dec_HIPASS (J2000) | Vel_HIPASS (km s-1 ) | W_HIPASS (km s-1 ) |
|---|---|---|---|---|
| HIPASSJ1950+18b | 19:50:52.8 | 18:23:51 | 3979.2 | 310.9 |
| HIPASSJ2004+07 | 20:04:12.1 | 07:23:37 | 5943.3 | 145.0 |
| HIPASSJ2004+14 | 20:04:46.0 | 14:06:19 | 4406.0 | 138.4 |
| HIPASSJ2015+12 | 20:15:50.3 | 12:40:44 | 1950.9 | 51.6 |
| HIPASSJ2042+07 | 20:42:16.7 | 07:36:53 | 5737.4 | 120.5 |
| HIPASSJ2045+12 | 20:45:19.4 | 12:53:03 | 4916.0 | 124.2 |
| HIPASSJ2109+21 | 21:09:41.2 | 21:18:16 | 3394.7 | 111.2 |
| HIPASSJ2112+12 | 21:12:26.7 | 12:37:20 | 4857.6 | 200.0 |
| HIPASSJ2132+07 | 21:32:52.3 | 07:58:22 | 3490.8 | 66.7 |
| HIPASSJ2142+22 | 21:42:27.7 | 22:38:58 | 5623.0 | 84.4 |
| HIPASSJ2149+14 | 21:49:34.4 | 14:14:35 | 1103.0 | 119.4 |
| HIPASSJ2158+14 | 21:58:34.9 | 14:07:01 | 1703.2 | 90.5 |
| HIPASSJ2207+15 | 22:07:06.0 | 15:59:05 | 1767.1 | 64.3 |
| HIPASSJ2208+03 | 22:08:05.5 | 03:36:27 | 4012.2 | 152.7 |
| HIPASSJ2209+01 | 22:09:44.7 | 01:59:07 | 3840.3 | 100.7 |
| HIPASSJ2211+17 | 22:11:54.7 | 17:54:35 | 1738.0 | 151.3 |
| HIPASSJ2224+22 | 22:24:52.1 | 22:58:23 | 1249.8 | 90.6 |
| HIPASSJ2225+06 | 22:25:31.1 | 06:23:15 | 8377.6 | 69.1 |
| HIPASSJ2251+07 | 22:51:29.7 | 07:15:58 | 3211.6 | 105.6 |
| HIPASSJ2253+11 | 22:53:48.0 | 11:16:15 | 2243.5 | 148.8 |
| HIPASSJ2255+11 | 22:55:37.8 | 11:03:54 | 2064.3 | 146.8 |
| HIPASSJ2301+12 | 23:01:06.0 | 12:44:53 | 2805.2 | 213.5 |
| HIPASSJ2308+17 | 23:08:47.5 | 17:12:44 | 1764.2 | 142.0 |
| HIPASSJ2316+05 | 23:16:00.0 | 05:11:47 | 9884.7 | 152.9 |
| HIPASSJ2319+16 | 23:19:36.8 | 16:06:43 | 7222.5 | 478.0 |
| HIPASSJ2322+13 | 23:22:27.2 | 13:52:11 | 7799.7 | 64.1 |
| HIPASSJ2333+04 | 23:33:20.8 | 04:23:33 | 5814.1 | 88.9 |
| HIPASSJ2336+12 | 23:36:29.9 | 12:46:22 | 6184.4 | 62.1 |
| HIPASSJ2336+14 | 23:36:41.6 | 14:12:05 | 3971.0 | 174.2 |
| HIPASSJ2339+07 | 23:39:32.7 | 07:48:53 | 3430.9 | 60.5 |
| HIPASSJ2349+02 | 23:49:53.6 | 02:43:12 | 5307.8 | 222.8 |
| HIPASSJ2353+07 | 23:53:55.1 | 07:56:25 | 5132.9 | 167.3 |
| HIPASSJ2357+23 | 23:57:57.2 | 23:59:54 | 10927.8 | 100.2 |
| HIPASSJ2358+04 | 23:58:15.2 | 04:47:37 | 3035.2 | 110.7 |
| HIPASSJ2359+02 | 23:59:17.3 | 02:42:05 | 2616.0 | 147.8 |