11institutetext: Department of Physics, Rochester Institute of Technology, 54 Lomb Memorial Drive, Rochester, NY 14623 22institutetext: Department of Physics, Penn State University, Berks Campus, P. O. Box 7009, Reading, PA 19610 33institutetext: Center for Imaging Science, Rochester Institute of Technology, 54 Lomb Memorial Drive, Rochester, NY 14623

Physical Properties of Very Powerful FRII Radio Galaxies

Christopher P. O’Dea 11    Ruth A. Daly 22    Preeti Kharb 33    Kenneth A. Freeman 22    and Stefi A. Baum 33
Abstract

Aims. We estimate ages and physical properties of powerful radio galaxies.

Methods. An analysis of new multi-wavelength VLA observations of eleven very powerful classical double (FRIIb) radio galaxies with redshifts between 0.4 and 1.3 is presented. We estimate ages and velocities for each side of each source. The eleven new sources are combined with previously studied samples and the characteristics of the full sample of 31 sources are studied; the full sample includes sources with redshifts between 0.056 and 1.79, and core-hot spot sizes of about 30 to 400 kpc.

Results. The velocities are independent of core-hotspot separation, suggesting the rate of growth of a given source is roughly constant over the source lifetime. We combine the rate of growth, width, and pressure of a source to study the beam power, lifetime, energy, and ambient gas density using standard methods previously applied to smaller samples. Typical beam powers are in the range from 1044superscript104410^{44} to 1046superscript104610^{46} erg/s; we show that this quantity is insensitive to assumptions regarding minimum energy conditions. The beam powers are independent of core-hotspot separation suggesting that the beam power of a given source is roughly constant over the source lifetime. Typical total source lifetimes are found to be about a few ×(106107)absentsuperscript106superscript107\times(10^{6}-10^{7}) years, and typical total outflow energies (E/c2𝐸superscript𝑐2E/c^{2}) are found to be about 5×(105106)5superscript105superscript1065\times(10^{5}-10^{6}) M. Ambient gas densities are found to decrease with increasing core-hotspot distance, but have no redshift dependence. Overall, the results obtained with the sample of 31 sources studied here are consistent with those obtained earlier with smaller samples.

Key Words.:
Galaxies: active — Galaxies: jets — (Galaxies:) intergalactic medium

1 INTRODUCTION

Radio galaxies are beacons that pinpoint sites of active nuclei of galaxies containing the most massive black holes. They provide important information on the properties of the active nuclei, the large-scale environments of these distant galaxies, and the interaction between outflows from active nuclei and the source environment. In this paper, we focus on the properties of very powerful classical double radio galaxies, referred to as FRIIb sources.

Classical double radio sources, also known as FRII sources (Fanaroff & Riley 1974), exhibit a variety of structures. Leahy & Williams (1984) identified five types of FRII sources including sources with no bridge distortion (type 1) and four types of bridge distortion (types 2-5). Leahy, Muxlow, & Stephens (1989) found a correlation between radio bridge (also called lobe) structure and radio power: the most powerful classical double radio galaxies, those with 178 MHz radio powers greater than about 3h2×10263superscript2superscript10263h^{-2}\times 10^{26} W/Hz/sr, have quite regular bridge structure, that is, they have type 1 bridge structure. The regular radio bridge structure of these very high power classical double radio galaxies was taken as an indication that back flow was likely to be negligible in these sources. Given that FRII sources can be divided into those with regular radio bridge structure, type 1 of Leahy & Williams (1984), and those with distorted radio bridge structure, types 2 - 5 of Leahy & Williams (1984), Daly (2002) divided the sources into types FRIIa and FRIIb based on the power dependence found by Leahy, Muxlow, & Stephens (1989). Thus, Daly (2002) defined FRII sources with 178 MHz radio powers greater than about 3h2×10263superscript2superscript10263h^{-2}\times 10^{26} W/Hz/sr as FRIIb sources, and all FRII sources with lower power to be FRIIa sources. It is the FRIIb sources that have high radio power and regular radio bridge structure, and thus are likely to have negligible back flow in the radio bridge region.

Only FRIIb sources are included in the present study. Thus, most of the sources are found at relatively high redshift; only a few local sources belong to this population. An estimate of source age is presented for 11 new radio sources, as discussed in section 2. The new sources are combined with previously studied samples of 14 and 6 radio galaxies to form a sample of 31 sources. The physical properties of the sample of 31 radio sources such as the source velocities, pressures, widths, beam powers, ambient gas densities, lifetimes, and energies are discussed in section 3, and the results are summarized in section 4. Throughout the paper, we assume a Lambda Cold Dark Matter cosmology with the standard cosmological parameters ΩmsubscriptΩ𝑚\Omega_{m}=0.3 and ΩΛsubscriptΩΛ\Omega_{\Lambda}=0.7, and a value of Hubble’s constant of H0subscript𝐻0H_{0}=70 km s-1 Mpc-1.

2 Estimates of Source Age for the New Sample of Eleven Radio Galaxies

In the current paradigm (the “standard model”) for classical double radio galaxies supersonic jets propagate outwards through the ambient medium (e.g., Blandford & Rees 1974; Scheuer 1974; Leahy, Muxlow, & Stephens 1989; Begelman & Cioffi 1989; Daly 1990; Leahy 1991). The energy of the jets is thermalized in a terminal shock (called the hotspot). X-ray observations show that particle acceleration occurs in the hot spots (e.g., Hardcastle, Croston & Kraft 2007). The shocked jet material flows sideways from the hot spots to inflate a cocoon (called the radio lobes or bridges). This cocoon material is left behind as the jet continues to push forwards. Radiative losses will steepen the radio spectrum (e.g., Kardashev 1962; Pacholczyk 1970; Alexander 1987) with increasing distance from the acceleration site (e.g., Burch 1977). Thus, multi frequency radio imaging can allow the spectral steepening to be measured, and in the context of the standard model, the source age and overall advance speed to be estimated. Note that it is the radio spectral index, and not the radio flux density at one given frequency, that enters into the spectral aging approach. The sources are considered to have a region in which the electrons are accelerated to very high energies (identified with the hot spot and its immediate vicinity), and regions in which these electrons age significantly due to synchrotron and inverse Compton losses (identified as regions distinct from the acceleration site, that is, regions in the radio lobe).

Many multi-wavelength studies of radio sources have shown that this approach gives reasonable estimates of source ages (e.g., Myers & Spangler 1985; Alexander 1987; Alexander & Leahy 1987; Leahy, Muxlow & Stephens 1989; Carilli et al. 1991; Liu, Pooley, & Riley 1992; Mack et al. 1998; Guerra, Daly, & Wan 2000; Jamrozy et al. 2008). Observations at 90 GHz of some radio sources show spectral steepening consistent with the expectations of spectral aging models (Hardcastle & Looney 2008). Studies of large radio sources show that spectral aging analyses give source ages that are in good agreement with estimates based on dynamical models (e.g., Parma et al. 1998; Murgia et al. 1999; Kaiser 2000; Machalski et al. 2007). VLBI studies of hot spot proper motions in compact radio sources give direct measurements of dynamical ages which are in good agreement with estimates from spectral aging (e.g., Polatidis and Conway 2003; Murgia 2003; Nagai et al. 2006; Orienti, Dallacasa & Stanghellini 2007). These studies indicate that spectral aging analysis provides a useful estimate of the source age.

2.1 The Injection Spectral Index

The injection spectral index is the spectral index the electrons have in and around the acceleration site (the hot spot and its immediate vicinity). We combined snapshot data from the A and C configurations at 20 cm, and from the B and D configurations at 6 cm to give us sensitivity to structure on a range of size scales with a nominal resolution of about 1.2 arcsec (Kharb et al. 2008). In order to optimize the quality of the maps and our sensitivity to spectral index gradients in the low surface brightness lobe emission we tapered the uv data to achieve a resolution of between 2-2.5 arcsec. The spectral index maps used are shown in Figures 51.1, and 51.3 through 51.12 of the electronic version of Kharb et al. (2008), and each figure includes an insert showing the beam size.

As expected for hot spots of powerful radio galaxies (e.g., Black et al. 1992; Hardcastle, Croston, and Kraft 2007), our sources show sub-arcsecond scale structure in the hot spots (see the 8.4 GHz images at 0.25similar-toabsent0.25\sim 0.25 arcsec resolution in Kharb et al. 2008). Thus, the 2-2.5 arcsec resolution images used here will average over substructure in the hot spots. In order to indicate how much substructure is included in our estimates of the injection spectral index, we show the 0.25similar-toabsent0.25\sim 0.25 arcsec resolution 8.4 GHz images of the hot spots in Figures 1-21 with two circles centered on the peak brightness of the hot spot. One circle has a diameter equal to our CLEAN beam FHWM (between 2 and 2.5 arcsec) and one has a diameter equal to 1 arcsec.

One potential concern is that the spectral index we determine for the hot spot and vicinity (and thus the injection index) is affected by the substructure which we include, or perhaps by lobe emission where the hot spot is seen projected against the lobe. To check this, we remade the images with a CLEAN restoring beam of 1.0 arcsec, calculated the 1.4 to 4.8 GHz spectral index image, and determined the spectral index for the hot spot. The 1 arcsec beam is close to the nominal 1.2 arcsec and so is not a large extrapolation of our data. The 1 arcsec CLEAN beam has an area which is at least 4 times less than that of the 2-2.5 arcsec resolution data and thus the contribution to each beam from extended emission would be lower by that factor of 4. Table  1 shows that the hot spot spectral indices determined at the two resolutions (1 arcsec and 2-2.5 arcsec) are consistent with each other - i.e., there is no significant offset, but a scatter of about 0.1. Thus, we conclude that the spectral index measurements of the hot spots are not significantly affected by including hot spot sub-structure or faint emission from the lobes on scales between 12similar-toabsent12\sim 1-2 arcsec. In addition, we note that the spectral index of the lobe emission near the hot spot is close to that of the hot spot itself (as indicated in the analysis described above, and shown in Figures 51.1, and 51.3 through 51.12 of the electronic version of Kharb et al. 2008). This is presumably because the lobe material near the hot spot has not experienced substantial radiative aging.

Leahy, Muxlow and Stephens (1989) used the 151 MHz to 1.5 GHz hot spot spectral index obtained at resolutions of 3 to 4 arcsec as the injection index, and Liu, Pooley and Riley (1992) used the 38 MHz to 1 GHz spectral index integrated over the source as the injection index. The data of Liu, Pooley, & Riley (1992) were analyzed by Wellman, Daly, & Wan (1997; hereafter WDW) the 1.4 to 5 GHz hot spot spectral index obtained at about 1.2 arcsec resolution as the injection index who showed that the spectral aging results were in very good agreement with those obtained by Liu, Pooley, & Riley (1992). Thus, the two approaches are consistent, suggesting that at low frequencies, the electrons have not experienced significant radiative losses and the spectral index is that of the original injection spectrum.

In Table 1 we compare our 20-6 cm hot spot spectral indices with the 38 MHz to 1.4 GHz spectral indices based on integrated flux densities, which is similar to the approach of Liu, Pooley, & Riley (1992). We see that there are no significant offsets (i.e., one is not systematically steeper than the other), but there is a scatter of about 0.1. Thus, our hot spot spectral indices measured between 1.4 and 4.8 GHz are consistent with those measured (for the whole source) at low frequencies (38 MHz to 1.4 GHz) and are a useful measure of the injection spectrum. Because both of these comparisons result in scatter of about 0.1, we adopt this value as a conservative estimate of the possible contribution of systematic errors to the spectral index measurements.

As an additional consistency check, we note that the hotspot spectral index is correlated with the lobe spectral index and is flatter than the lobe spectral index (Fig 2 of Kharb et al. 2008), as expected if the spectra of the radiating electrons steepen after they leave the hot spot.

2.2 Estimating Source Age

To estimate the source ages, we followed the procedure outlined by Leahy, Muxlow, & Stephens (1989). The spectral age is characterized by a break frequency νTsubscript𝜈𝑇\nu_{T}. The source age t𝑡t is given by

t=50.2B1/2B2+BMWB2νT1/2𝑡50.2superscript𝐵12superscript𝐵2superscriptsubscript𝐵MWB2superscriptsubscript𝜈𝑇12t=50.2{B^{1/2}\over B^{2}+B_{\rm MWB}^{2}}\nu_{T}^{-1/2} (1)

where t is in Myr, B and BMWBsubscript𝐵MWBB_{\rm MWB} are in units of 10μ10𝜇10\muG, νTsubscript𝜈𝑇\nu_{T} is in GHz and is simply related to the observed break frequency ν0Tsubscript𝜈0𝑇\nu_{0T}, νT=ν0T(1+z)subscript𝜈𝑇subscript𝜈0𝑇1𝑧\nu_{T}=\nu_{0T}(1+z), and BMWB=3.18(1+z)2subscript𝐵MWB3.18superscript1𝑧2B_{\rm MWB}=3.18(1+z)^{2} μG𝜇𝐺\mu G is the equivalent magnetic field strength of the cosmic microwave background (Jaffe & Perola 1973). The minimum energy magnetic field strength is obtained using the expression of Miley (1980) assuming no relativistic protons, a filling factor of unity, a tangled magnetic field , cylindrical symmetry with random orientation to the line of sight, and a power-law spectrum with cutoffs at 10 MHz and 100 GHz. The expected spectral index for a given injection spectral index as a function of break frequency was computed by numerically integrating the equations given by Meyers & Spangler (1985). Meyers and Spangler showed that the spectral index between two frequencies near the break was sufficient to allow estimation of the break frequency. We performed the Myers and Spangler calculations for both the Kardashev-Pacholczyk (KP) and Jaffe-Perola (JP) models. They give similar results and we quote the results for the JP model.

Total intensity maps at 20 and 6 cm at matched angular resolutions of 2 to 2.5 arcsec with circular Gaussian restoring beams were corrected for the primary beam attenuation and were used to obtain the spectral index maps. The spectral index between two frequencies ν1subscript𝜈1\nu_{1} and ν2subscript𝜈2\nu_{2} is given by

α=log(S1/S2)log(ν1/ν2)𝛼subscript𝑆1subscript𝑆2subscript𝜈1subscript𝜈2\alpha={\log(S_{1}/S_{2})\over\log(\nu_{1}/\nu_{2})} (2)

where S1subscript𝑆1S_{1} and S2subscript𝑆2S_{2} are the respective flux densities. The error in the spectral index is given by

Δα=logelog(ν1/ν2)((ΔS1S1)2+(ΔS2S2)2)1/2Δ𝛼𝑒𝑙𝑜𝑔subscript𝜈1subscript𝜈2superscriptsuperscriptΔsubscript𝑆1subscript𝑆12superscriptΔsubscript𝑆2subscript𝑆2212\Delta\alpha={\log e\over log(\nu_{1}/\nu_{2})}\left(\left({\Delta S_{1}\over S_{1}}\right)^{2}+\left({\Delta S_{2}\over S_{2}}\right)^{2}\right)^{1/2} (3)

where ΔS1Δsubscript𝑆1\Delta S_{1} and ΔS2Δsubscript𝑆2\Delta S_{2} are the one sigma errors in the flux densities. The errors in flux density includes a contribution from the thermal noise due to the sensitivity of the array which is straightforward to determine (e.g., Crane and Napier 1985) plus additional contributions whose magnitude is difficult to determine e.g., the missing uv spacings, and problems with the calibration, self-calibration, and deconvolution processes (e.g., Perley 1985; Leahy, Muxlow and Stephens 1989). To account for the additional flux density errors, we adopted values for ΔS1Δsubscript𝑆1\Delta S_{1} and ΔS2Δsubscript𝑆2\Delta S_{2} that were factors of three larger than the rms noise in the image at locations far from the source. However, the hot spots are so bright, that even with the conservative values of ΔSΔ𝑆\Delta S, the calculated values of ΔαΔ𝛼\Delta\alpha are very small. So as discussed in § 2.1 we adopted an additional conservative upper limit for the uncertainty in the spectral index of Δα=0.1Δ𝛼0.1\Delta\alpha=0.1 We also blanked the images at values less than 3 times the rms noise determined at distances far from the source.

Following the work on Leahy, Muxlow, & Stephens (1989), Liu, Pooley, & Riley (1992), and WDW, the spectral index gradient is measured between the hot spot and one lobe position for each side of each source; in the Appendix, it is shown that very similar results are obtained by measuring the spectral gradient between many points on each side of each source. The lobe position was chosen to be in a region of high signal to noise, and far from the hot spot so that a significant spectral index difference existed between the hot spot and the lobe. The break frequency was determined by comparing the observed spectral index difference with the calculations of the JP model using the Myers and Spangler method. The one sigma range of the spectral index difference was used to obtain the uncertainty of the break frequency. The age of the electrons was obtained using equation (1), with the magnetic field strengths described in section 3.2; the best fit parameters are listed in Table 2. Using the age and the distance from the hot spot, the rate of growth of each side of each source (the expansion velocity) is obtained, and is listed in Table LABEL:tabprop. In the Appendix, velocities are determined at multiple locations on each side of each source. It turns out that these velocities are in very good agreement with those obtained here and listed in Table LABEL:tabprop. on the

3 Physical Parameters of the Combined Sample of 31 Radio Galaxies

The physical parameters of the new sample of 11 radio galaxies of Kharb et al. (2008) are combined with those published earlier for samples of 6 (Guerra, Daly, & Wan 2000) and 14 radio galaxies (Leahy, Muxlow, & Stephens 1989; Liu, Pooley, & Riley 1992; WDW) to yield a sample of 31 radio galaxies. Parameters are determined for each side of each source, though two sources (3C 239 and 3C 324) only had radio bridge data on one side of the source, so we study a total of 60 radio bridges.

The lobe propagation velocity for each side of each source is presented and discussed in section 3.2 and listed in Table LABEL:tabprop. Converting the velocity from the cosmological model adopted for the earlier studied samples of 6 and 14 radio galaxies to that adopted here is non-trivial, so these are listed in Table LABEL:tabprop for the cosmology adopted here. Beam powers, ambient gas densities, total source lifetimes, and total source energies are obtained for the new sample of 11 sources and combined with those published earlier for the samples of 6 and 14 sources. The results obtained for the full sample are presented in sections 3.3, 3.4, 3.5, and 3.6 respectively.

3.1 Projection Effects

In this study, radio galaxies are considered so as to minimize projection effects. If the sources are not in the plane of the sky, our estimated velocities will be lower limits to the true velocity, e.g., a source which is oriented 30 degrees from the plane of the sky will have a velocity 15% larger than our estimate. Projection effects were studied in detail by Wan & Daly (1998), and are found to be quite small for the quantities studied here except when the outflow axis of the source is quite close to the line of sight of the observer.

In Kharb et al (2008), we showed that several diagnostics of alignment and Doppler boosting were consistent with the eleven galaxies studied here lying close to the plane of the sky. The UV/optical spectra show that these are all narrow-line radio galaxies, which suggests that they are oriented at angles >45absent45>45 degrees to the line of sight, under the standard Unified scheme (e.g., Barthel 1989; Urry & Padovani 1995).

We noted that the ratio of the angular extent of the larger radio lobe (distance between hotspot and core) to the smaller one, known as the arm-length ratio (Q𝑄Q), was 1.1similar-toabsent1.1\sim 1.1 for the majority of the radio galaxies, with only three galaxies exhibiting ratios>1.5absent1.5>1.5 (3C44 (1.6), 3C54 (1.8) and 3C441 (2.4)). Assuming that the jets are intrinsically symmetric and any apparent asymmetry is due to the difference in light travel times between the two sides (e.g., Longair & Riley 1979; Kapahi & Saikia 1982) and using the relation Q=(1+βcosθ)/(1βcosθ)𝑄1𝛽𝜃1𝛽𝜃Q=(1+\beta\cos\theta)/(1-\beta\cos\theta), an arm-length ratio of 1.1 would give a βcosθ𝛽𝜃\beta\cos\theta of 0.047 or θ𝜃\theta = 62 degrees relative to the line of sight for β𝛽\beta = 0.1 (e.g., Bridle & Perley 1984).

Another statistical indicator of beaming/orientation is the radio core prominence parameter (Rc, Orr & Browne 1982), which is the ratio of the (beamed) core to the (unbeamed) extended flux density (see Appendix C, Urry & Padovani 1995). For these radio galaxies, 4.3<logRc<2.54.3subscript𝑅c2.5-4.3<\log R_{\rm c}<-2.5 (Kharb et al. 2008). Kharb & Shastri (2004) estimated the Rc values (which are linearly correlated with θ𝜃\theta) for a large sample of radio galaxies and their respective beamed counterparts (see Fig. 3 of Kharb & Shastri). Assuming that these sources are randomly oriented in the sky and span the entire θ𝜃\theta range (0 to 90 degrees), a comparison with Fig. 3 indicates that our eleven galaxies lie at angles larger than 60 degrees to the line of sight, or within 30 degrees of the plane of the sky.

For sources lying at small angles to line of sight, intrinsic misalignment between the jet and counter-jet appears to get amplified (e.g., Kapahi & Saikia 1982). The observed misalignment (ζ𝜁\zeta) is related to the intrinsic misalignment (ζintsubscript𝜁𝑖𝑛𝑡\zeta_{int}), by sin(θ)=tan(ζint)/tan(ζ)𝑠𝑖𝑛𝜃𝑡𝑎𝑛subscript𝜁𝑖𝑛𝑡𝑡𝑎𝑛𝜁sin(\theta)=tan(\zeta_{int})/tan(\zeta), for the simplified case in which the azimuth of the jet bending is 90°90°90\degr (see Appl, S. et al. 1996). We found that the jet and counter-jet were misaligned by less than 5 degrees for the majority of our radio galaxies, with only one galaxy showing a misalignment >10absent10>10 degrees (3C169.1 (15 degrees)). If we adopt an intrinsic misalignment angle of 4°similar-toabsent4°\sim 4\degr (e.g., Appl, S. et al. 1996), this would imply a jet orientation angle θ>50°𝜃50°\theta>50\degr relative to the line of sight for the majority of the radio galaxies.

As seen in Fig. 5 of Kharb et al (2008), the lobe-to-lobe differences in depolarization are not correlated with either the radio core prominence or the misalignment angle. In other words, we do not find evidence for the ‘Laing-Garrington effect’ (Garrington et al. 1988; Laing 1988) in our radio galaxies. The lack of a correlation is consistent with the picture of these radio galaxies lying close to the plane of the sky. This is also consistent with the fact that all these galaxies lack bright one-sided jets, typically observed in quasars.

The fact that all of the sources are narrow-line radio galaxies, and have arm-length ratios close to unity, low radio core prominence parameters, small misalignments between the jet and counter-jet, and do not exhibit the Laing-Garrington effect all suggest that the sources are within about 30 degrees of the plane of the sky.

3.2 Velocities

The velocities are obtained using the spectral age given by equation (1) and the separation θ𝜃\theta between the hotspot and the location where αfinalsubscript𝛼final\alpha_{\rm final} was measured. The average minimum energy magnetic field strength in the radio lobe region was obtained in a manner identical to that used earlier so the new results can be combined with those obtained previously; thus, Bminsubscript𝐵𝑚𝑖𝑛B_{min} in the radio lobe region was taken to be (B10B25)0.5superscriptsubscript𝐵10subscript𝐵250.5(B_{10}B_{25})^{0.5}, where B10subscript𝐵10B_{10} and B25subscript𝐵25B_{25} are the minimum energy magnetic field strengths at distances of 10 and 25 h1superscript1h^{-1} kpc behind the hotspot (toward the core). In addition to considering a magnetic field strength given by the minimum energy value Bminsubscript𝐵𝑚𝑖𝑛B_{min}, we also consider the possibility that the magnetic field strength is less than the minimum energy value by a factor of 4, so B=0.25Bmin𝐵0.25subscript𝐵𝑚𝑖𝑛B=0.25B_{min}, parameterized by b=B/Bmin𝑏𝐵subscript𝐵𝑚𝑖𝑛b=B/B_{min}. This is the same offset that was studied previously, and thus provides a good comparison to results obtained previously, and there are good reasons for this choice, as described below.

An offset from minimum energy conditions was suggested by Carilli et al. (1991) for Cygnus A and Perley & Taylor (1991) for 3C 295 to obtain agreement between the ambient gas density indicated by X-ray observations and that indicated by the ram pressure confinement of the forward region of the radio lobe (see also De Young 2002). WDW showed that the dispersion in the offset is likely to be less than about 15 % for very powerful radio galaxies of the type studied here.

Note that only FRIIb radio galaxies are included in the study. These sources have very regular bridge structure suggesting that back flow is not important in these sources (Alexander and Leahy 1987; Leahy, Muxlow, and Stephens 1989; WDW; Kaiser 2000; Daly 2002), and that the sources are growing at a rate that is well into the supersonic regime. As described by Alexander and Leahy (1987) and Leahy, Muxlow, and Stephens (1989), significant back flow will collide with the relativistic plasma in the bridge causing side flows and bridge distortions. As shown by Machalski et al. (2007), a spectral aging analysis of radio sources provides a reliable parametric fit to the source age.

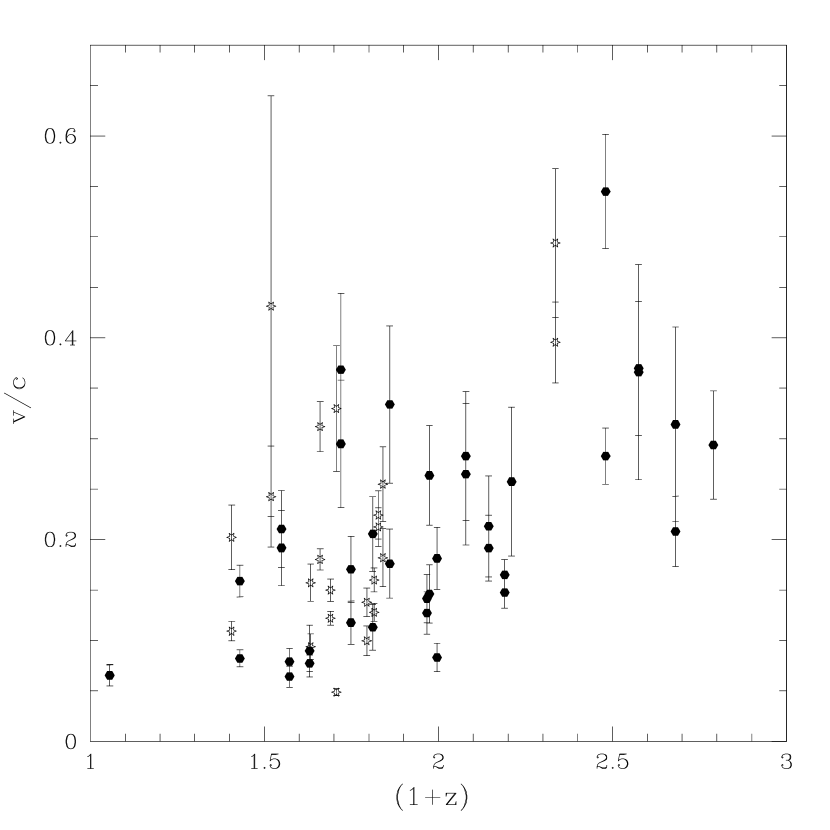
The overall rate of growth or lobe propagation velocity is listed for each source for b=0.25𝑏0.25b=0.25 and b=1𝑏1b=1 in Table LABEL:tabprop and shown in Figures 22 and 23 as functions of core-hotspot distance and in Figures 24 and 25 as functions of redshift. When a value of b=0.25𝑏0.25b=0.25 is taken, a fractional error in b𝑏b of 15 % is included in the uncertainties of the velocity, pressure, and beam power. When a value of b=1𝑏1b=1 is taken, no uncertainty in b𝑏b is propagated through other quantities. Typically, the difference in the total error is not strongly affected by the uncertainty in b𝑏b. Several previous studies of spectral aging have obtained velocities assuming b=1𝑏1b=1 with no uncertainty in this quantity. Thus, the values and uncertainties of v𝑣v we obtain with b=1𝑏1b=1 can be directly compared with those obtained by other groups, and, to illustrate the effect of including the uncertainty of b𝑏b on the uncertainty of v𝑣v, this is included for the case b=0.25𝑏0.25b=0.25.

The velocities obtained do not correlate with core-hotspot separation, as indicated in Tables 5 and 6; this result is also obtained in the Appendix. This suggests that the velocity of a particular source is roughly constant over the lifetime of that source. The velocities do not correlate with redshift, suggesting that no redshift dependent selection effects or systematic errors are skewing the synchrotron ages.

Thus, we find that propagation speeds of powerful radio galaxies on scales of tens to hundreds of kpc are independent of source size or redshift. This is consistent with the results of observational, analytical, and numerical simulation studies of radio galaxy evolution which suggest that large radio sources propagate at roughly constant velocity (e.g., Fanti et al. 1995; Neeser et al. 1995; Begelman 1996; Kaiser & Alexander 1997; Kaiser, Dennett-Thorpe, & Alexander 1997; De Young 1997; O’Dea and Baum 1997; Blundell, Rawlings & Willott 1999; Snellen et al. 2000; Alexander 2000; De Young 1997; Carvalho & O’Dea 2002a,b).

3.3 Beam Powers

The beam power of a source may be estimated based on the rate of growth of the source, v𝑣v, the pressure in the radio bridge, P𝑃P, and the cross-sectional width of the bridge, a𝑎a, as described, for example, by Daly (1990) and Rawlings & Saunders (1991). Here, we use eqs. (2) and (3) of Wan, Daly, and Guerra (2000), who show that Lj=3.6×1044(a/kpc)2(v/c)(P/(1010dynes cm2))ergs s1subscript𝐿𝑗3.6superscript1044superscript𝑎𝑘𝑝𝑐2𝑣𝑐𝑃superscript1010superscriptdynes cm2superscriptergs s1L_{j}=3.6\times 10^{44}(a/kpc)^{2}(v/c)(P/(10^{-10}\hbox{dynes cm}^{-2}))\hbox{ergs s}^{-1} and P=[(4/3)b1.5+b2](Bmin/24π)𝑃delimited-[]43superscript𝑏1.5superscript𝑏2subscript𝐵𝑚𝑖𝑛24𝜋P=[(4/3)b^{-1.5}+b^{2}](B_{min}/24\pi), so P(b=1.0)0.218P(b=.25)𝑃𝑏1.00.218𝑃𝑏.25P(b=1.0)\approx 0.218P(b=.25). Widths and pressure for the 11 new sources were obtained in a manner identical to the way they were obtained for the previously studied samples of 6 and 14 radio galaxies (see WDW and Wan, Daly, & Guerra 2000). The lobe pressure as a function of core - hot spot separation and redshift are shown in Figures 26 and 27, respectively. Values of Ljsubscript𝐿𝑗L_{j} obtained for the sample are listed in Table LABEL:tabprop for b=0.25𝑏0.25b=0.25, and shown in Figures 28, 29, 30 and 31 for b=0.25𝑏0.25b=0.25 and b=1𝑏1b=1.

The quantity Ljsubscript𝐿𝑗L_{j} is rather insensitive to the value of bB/Bmin𝑏𝐵subscript𝐵𝑚𝑖𝑛b\equiv B/B_{min} for the current sample, and thus is insensitive to offsets from minimum energy conditions. The reason is that the dependence of v𝑣v on b𝑏b just about cancels the dependence of P𝑃P on b𝑏b. When BbBminBMB𝐵𝑏subscript𝐵𝑚𝑖𝑛subscript𝐵𝑀𝐵B\equiv bB_{min}\geq B_{MB}, as is the case here, equation (1) indicates that vb1.5proportional-to𝑣superscript𝑏1.5v\propto b^{1.5}, and for b1𝑏1b\leq 1, which is expected to be the case, Pb1.5proportional-to𝑃superscript𝑏1.5P\propto b^{-1.5}, so LjvPproportional-tosubscript𝐿𝑗𝑣𝑃L_{j}\propto vP is quite insensitive to the value of b𝑏b. Thus, the values of Ljsubscript𝐿𝑗L_{j} obtained here remain valid even if the relativistic plasma in the sources is not close to minimum energy.

The values of Ljsubscript𝐿𝑗L_{j} range from about 1044superscript104410^{44} to 1046superscript104610^{46} erg/s or so. There is no dependence of Ljsubscript𝐿𝑗L_{j} on core-hotspot separation, as indicated in Tables 4 and 5, suggesting that the beam power of a particular source is roughly constant over the lifetime of that source. There is a correlation between beam power and redshift, as is expected from the fact that the parent population is a subset of the flux limited 3CR sample.

3.4 Ambient Gas Densities

The equation of ram pressure confinement (e.g., De Young 2002) indicates that the ambient gas density is given by naP/v2proportional-tosubscript𝑛𝑎𝑃superscript𝑣2n_{a}\propto P/v^{2}, with the constant of proportionality equal to 1/(1.4μmp)11.4𝜇subscript𝑚𝑝1/(1.4\mu m_{p}), where μ𝜇\mu is the mean molecular weight of the gas taken to be 0.63 for solar abundances, and mpsubscript𝑚𝑝m_{p} is the proton rest mass. It is well known that the ambient gas density obtained with this equation for b=1𝑏1b=1 is well below that known to be present from X-ray observations. This is the primary reason to consider values of b𝑏b less than one. The studies of Carilli et al. (1991) of Cygnus A and Perley and Taylor (1991) of 3C 295 indicate that b is likely to be less than one. The study of WDW suggests that the dispersion of b for very powerful classical double radio galaxies like those included in this study is less than about 15 %.

The ambient gas density in the vicinity of the hotspot was determined for each side of each source for the 11 new radio galaxies for b = 0.25 and for b = 1, following the procedure of WDW, and combined with the previously determined values of the ambient gas density for the other 20 sources. The results are shown in Figures 32, 33, 34 and 35 as a function of core-hotspot distance and redshift, and listed in Table LABEL:tabprop for b = 0.25.

The ambient gas density falls with distance from the source center, as indicated in Table 5 and 6. For b = 0.25, nar1.9±0.6proportional-tosubscript𝑛𝑎superscript𝑟plus-or-minus1.90.6n_{a}\propto r^{-1.9\pm 0.6}; the uncertainty of 0.60.60.6 is estimated by correcting the best fit uncertainty of 0.20.20.2 by (χ2/58)\sqrt{(}\chi^{2}/58), since there are 60 data points or 58 degrees of freedom included in the fit. For b = 1, nar1.38±0.28proportional-tosubscript𝑛𝑎superscript𝑟plus-or-minus1.380.28n_{a}\propto r^{-1.38\pm 0.28} with the uncertainty corrected from the raw value of 0.13 by (χ2/58)\sqrt{(}\chi^{2}/58). The magnitude of the ambient gas density is similar to that in cluster-type gaseous environments for b = 0.25, and well below that for b=1. The values of the ambient gas density and offsets from minimum energy conditions obtained and studied here are consistent with recent X-ray studies (Belsole et al. 2007; Croston et al. 2007).

3.5 Total Outflow Lifetimes

The total outflow lifetime TTsubscript𝑇𝑇T_{T} is an estimate of the total lifetime of the jet (past and future) that is powering that side of the source in its current cycle of radio activity. It is obtained from the beam power using the relationship, TTLjβ/3proportional-tosubscript𝑇𝑇superscriptsubscript𝐿𝑗𝛽3T_{T}\propto L_{j}^{-\beta/3} for the best fit value of β=1.5𝛽1.5\beta=1.5 obtained by Daly et al. (2007), and it is normalized using Cygnus A. TTsubscript𝑇𝑇T_{T} is not the current synchrotron or dynamical age of the source, but is the total time that the outflow will be supplying beam power to the source hot spots. The empirical basis for the relationship and its derivation are described in detail by Daly et al. (2007). The total lifetime is interesting because the total energy that will be channeled through the jet over its lifetime can be obtained from using the relation E=LjTTsubscript𝐸subscript𝐿𝑗subscript𝑇𝑇E_{*}=L_{j}T_{T}.

The total lifetime of the jet on each side of each source is shown in Figures 36, 37, 38, and 39 for b=1𝑏1b=1 and b=0.25𝑏0.25b=0.25; although the beam power is nearly independent of b𝑏b, the normalization does depend upon this parameter. We see that the total lifetime determined in this way does not depend on the distance of the hotspot from the core of the source, indicating that we are randomly sampling the source during its lifetime, and the estimated total lifetime does not depend on the age of the source at the instant it is observed. The source lifetime does depend on redshift, as expected from the dependence of beam power on redshift. This follows from the fact that the sample is flux limited, so we only observe the most powerful sources at high redshift; these are the sources with large beam power and correspondingly small total lifetimes.

The estimated total lifetimes are roughly a few ×106absentsuperscript106\times 10^{6} yr for b=1𝑏1b=1 and are about a factor of 5 higher for b=0.25𝑏0.25b=0.25. This is the lifetime of the radio luminous outflow. However, there is a correlation between optical emission line luminosity and radio luminosity in powerful radio galaxies (e.g., Baum & Heckman 1989; Rawlings & Saunders 1991; Xu, Livio & Baum 1999; Willott et al 1999). This requires the radio outflow phase to be accompanied by an optically luminous QSO phase which can ionize the emission line nebulae. Thus, in these powerful radio galaxies, the QSO phase must persist for at least the lifetime of the radio source giving an independent lower limit to the QSO lifetime of a few ×106absentsuperscript106\times 10^{6} to a few ×107absentsuperscript107\times 10^{7} yr (depending on the value of b𝑏b). This has implications for the question of how much mass is accreted by the black hole during a bright phase (e.g., Martini 2004).

3.6 Total Outflow Energy

The total outflow energy ETsubscript𝐸𝑇E_{T} is an estimate of the total energy that the jet will deposit into the radio source over the entire lifetime of the jet TTsubscript𝑇𝑇T_{T}, and is obtained using the expression ET=LjTTsubscript𝐸𝑇subscript𝐿𝑗subscript𝑇𝑇E_{T}=L_{j}T_{T}. The total outflow energies (E/c2𝐸superscript𝑐2E/c^{2}) are a few ×105absentsuperscript105\times 10^{5} M for b=1𝑏1b=1 and about a factor of 5 higher for b=0.25𝑏0.25b=0.25.

The total energy that will be processed by the central engine and expelled through the jet during the entire lifetime of the jet is shown in Figures 40, 41, 42 and 43 for two values of b. The total energy is independent of core-hotspot separation (see Tables 5 and 6), indicating that we are observing the source at a random epoch during the lifetime of the source and our estimate of total outflow energy does not depend on the actual age of the source when we observe it. The total energy does depend upon redshift as expected from the dependence of beam power on redshift and the fact that ETLj0.5proportional-tosubscript𝐸𝑇superscriptsubscript𝐿𝑗0.5E_{T}\propto L_{j}^{0.5}; this is an artifact of the fact that we are working with a flux limited sample.

4 SUMMARY

We present an analysis of new multi-wavelength VLA observations of eleven very powerful classical double radio galaxies with redshifts between 0.4 and 1.3. We estimate spectral ages and velocities for each radio bridge. Pressures and widths for each side of each source are also determined. These quantities are used to solve for the beam power, ambient gas density, total source lifetime, and total energy channeled through the jets over the source lifetime both assuming minimum energy conditions, and allowing for an offset from these conditions.

Results obtained with the eleven new sources were combined with a sample of 20 radio galaxies, and the characteristics of the full sample of 31 sources were studied. The velocities are independent of core-hotspot separation, suggesting that the velocity of a given source is roughly constant over that source lifetime. The velocities are independent of redshift, suggesting that there are no redshift-dependent systematic effects/errors in the computation of the velocity. Our result that source expansion speeds are roughly constant is consistent with independent studies based on the statistics of powerful radio galaxies, theoretical modeling, and numerical simulations.

Typical beam powers are in the range from 1044superscript104410^{44} to 1046superscript104610^{46} erg/s, and this quantity is insensitive to offsets from minimum energy conditions due to the fact that LjvPproportional-tosubscript𝐿𝑗𝑣𝑃L_{j}\propto v\leavevmode\nobreak\ P, and vb1.5proportional-to𝑣superscript𝑏1.5v\propto b^{1.5} and Pb1.5proportional-to𝑃superscript𝑏1.5P\propto b^{-1.5} for b1𝑏1b\leq 1, and BBMB𝐵subscript𝐵𝑀𝐵B\geq B_{MB}, which is the range of magnetic field strengths relevant for these sources. We find that the beam powers are independent of core-hotspot separation, suggesting that the beam power of a given source is roughly constant over that source lifetime.

The estimated total lifetimes are roughly a few ×106absentsuperscript106\times 10^{6} yr for b=1𝑏1b=1 (equipartition), and about 5 times higher for b=0.25𝑏0.25b=0.25. The observed correlation between radio luminosity and optical emission line luminosity requires the radio source to be accompanied by an optically bright QSO phase. Thus, the total source lifetimes derived here are lower limits on the QSO phase of the activity.

The total outflow energies (E/c2𝐸superscript𝑐2E/c^{2}) are a few ×105absentsuperscript105\times 10^{5} M for b=1𝑏1b=1 (equipartition) and about a factor of 5 higher for b=0.25𝑏0.25b=0.25.

Typical ambient gas densities are similar to those in clusters of galaxies at the current epoch for an offset from minimum energy conditions by a factor of about 0.25. The ambient gas densities (obtained from the ram pressure confinement of the forward region of the source) decrease as the core-hotspot distance increases, as expected for source sizes of about 30 to 400 kpc, but have no redshift dependence.

Acknowledgements.
We would like to thank the referee for helpful comments and suggestions. We would like to acknowledge helpful conversations with Roger Blandford, Greg Taylor, Paul Wiita, Dan Harris, and Alan Marscher. We are grateful to the Penn State University Computer Center for the use of their IMSL libraries. Support for this work was provided in part by US National Science Foundation grant number AST-0507465 (R. A. D.). This research made use of (1) the NASA/IPAC Extragalactic Database (NED) which is operated by the Jet Propulsion Laboratory, California Institute of Technology, under contract with the National Aeronautics and Space Administration; and (2) NASA’s Astrophysics Data System Abstract Service.

References

  • Alexander & Leahy (1987) Alexander, P., & Leahy, J. P., 1987, MNRAS, 225, 1
  • Alexander (1987) Alexander, P., 1987, MNRAS, 225, 27
  • Alexander (2000) Alexander, P., 2000, MNRAS, 319, 8
  • Appl, Sol & Vicente (1996) Appl, S., Sol, H., & Vicente, L., 1996, A&A, 310, 419
  • Barthel (1989) Barthel, P. D., 1989, ApJ, 336, 606
  • Baum & Heckman (1989) Baum, S. A., & Heckman, T., 1989, ApJ, 336, 702
  • Begelman & Cioffi (1989) Begelman, M.C. & Cioffi, D. F., 1989, ApJ, 345, L21
  • Begelman (1996) Begelman, M.C. 1996, in: “Cygnus A – Study of a Radio Galaxy”, eds. C. Carilli and D. Harris, (Cambridge: Cambridge University Press), p. 209
  • Black et al. (1992) Black, A. R. S., Baum, S. A., Leahy, J. P., Perley, R. A., Riley, J. M., Scheuer, P. A. G., MNRAS, 256, 186
  • Blandford & Rees (1974) Blandford, R. D., & Rees, M. J., 1974, MNRAS, 169, 395
  • Belsole et al. (2007) Belsole, E., Worrall, D. M., Hardcastle, M. J., & Croston, J. H. 2007, MNRAS, 381, 1109
  • Blundell et al. (1999) Blundell, K. M., Rawlings, S., & Willott, C. J., 1999, AJ, 117, 677
  • Bridle & Perley (1984) Bridle, A. H., & Perley, R. A., 1984, ARA&A, 22, 319
  • Burch (1977) Burch, S. F., 1977, MNRAS, 180, 623
  • Carilli et al. (1991) Carilli, C. L., Perley, R. A., Dreher, J. W., Leahy, J. P. 1991, ApJ, 383, 554 MNRAS, 270,
  • Carvalho & O’Dea (2002) Carvalho, J. & O’Dea, C. P., 2002a, ApJS, 141, 337
  • Carvalho & O’Dea (2002) Carvalho, J. & O’Dea, C. P., 2002b, ApJS, 141, 371 J. M., 1992, ApJ, 392, 458
  • Crane and Napier (1985) Crane, P. C., and Napier, P. J. 1985, in Synthesis Imaging, eds. R. A. Perley, F. R. Schwab, and A. H. Bridle (NRAO, Charlottesville) p. 87
  • Croston et al. (2005) Croston, J. H., Hardcastle, M. J., Harris, D. E., Belsole, E., Birkinshaw, M., & Worrall, D. M., 2005, ApJ, 626, 733
  • Daly (1990) Daly, R. A., 1990, ApJ, 355, 416
  • Daly (2002) Daly, R. A., 2002, NewAR., 46, 47
  • Daly et al. (2007) Daly, R. A., Mory, M. P., O’Dea, C. P., Kharb, P., Baum, S., Guerra, E. J., & Djorgovski, S. G., 2007, ApJ, accepted for publication (astro-ph/0710.51120)
  • De Young (1997) De Young, D. S., 1997, ApJ, 490, L55
  • De Young (2002) De Young, D. S., 2002, The Physics of Extragalactic Radio Sources, (University of Chicago Press: Chicago) 3c346 Rendong,
  • Fanaroff & Riley (1974) Fanaroff, B. L., & Riley, J. M. 1974, MNRAS, 167, 31P
  • Fanti et al. (1995) Fanti, C., Fanti, R., Dallacasa, D., Schilizzi, R. T., Spencer, R. E., & Stanghellini, C., 1995, A&A, 302, 317
  • Garrington et al., (1988) Garrington, S. T., Leahy, J. P., Conway, R. G., Laing, R. A., 1988, Nature, 331, 147
  • Guerra et al. (2000) Guerra, E. J., Daly, R. A. , & Wan, L. 2000, ApJ, 544, 659 Alexander,
  • Hardcastle & Looney (2008) Hardcastle, M. J., & Looney, L. J., 2008, MNRAS, in press, astroph/0804.3369.
  • Hardcastle, Croston & Kraft (2007) Hardcastle, M. J., Croston, J. H., & Kraft, R. P., 2007, ApJ, 669, 893 501, A&A,
  • Jaffe & Perola (1973) Jaffe, W. J., & Perola, G. C., 1973, A&AS, 26, 423
  • Jamrozy et al. (2008) Jamrozy, M., Konar, C., Machalski, J., & Saikia, D. J. 2008, MNRAS, 385, 1286 David, L.,
  • Kaiser & Alexander (1997) Kaiser, C. R., & Alexander, P., 1997, MNRAS, 286, 215
  • Kaiser et al. (1997) Kaiser, C. R., Dennett-Thorpe, J., & Alexander, P., 1997, MNRAS, 292, 723
  • Kaiser (2000) Kaiser, C. R., 2000, A&A, 362, 447
  • Kapahi & Saikia (1982) Kapahi, V. K., &Saikia, D. J., 1982, JApA, 3, 465
  • Kardashev (1962) Kardashev, N. S., 1962, Soviet Astr.-AJ, 6, 317
  • Kharb & Shastri (2004) Kharb, P. & Shastri, P., 2004, A&A, 425, 825
  • Kharb et al. (2008) Kharb, P., O’Dea, C. P., Baum, S. A., Daly, R., Mory, M., Donahue, M., & Guerra, E., 2008, ApJS, 174, 74 2005, of CSS
  • Laing (1988) Laing, R. A., 1988, Nature, 331, 149
  • Leahy (1991) Leahy, J. P., 1991, in Beams and Jets in Astrophysics, ed. P. A. Hughes (Cambridge: Cambridge University Press)
  • Leahy et al. (1989) Leahy, J. P., Muxlow, T. W. B., & Stephens, P. W., 1989, MNRAS, 239, 401
  • Leahy & Williams (1984) Leahy, J. P., & Williams, A. G. 1984, MNRAS, 210, 929
  • Liu et al. (1992) Liu, R., Pooley, G., & Riley, J. M., 1992, MNRAS, 257, 545 D. A.,
  • Longair & Riley (1979) Longair, M. S., & Riley, J. M., 1979, MNRAS, 188, 625
  • Mack et al. (1998) Mack, K.-H., Klein, U., O’Dea, C. P., Willis, A. G., & Saripalli, L., 1998, A&A, 329, 431
  • Machalski et al. (2007) Machalski, J., Chyzy, K. T., Stawarz, L., & Koziel, D., 2007, A&A, 462, 43
  • Martini (2004) Martini, P., 2004, in Coevolution of Black Holes and Galaxies, (Cambridge: Cambridge University Press), ed. P. Ho, p. 169. G.,
  • Meyers & Spangler (1985) Meyers, S. T., & Spangler, S. R., 1985, ApJ, 291, 52
  • Miley (1980) Miley, G. K., 1980, ARAA, 18, 165
  • Murgia et al. (1999) Murgia, M., Fanti, C., Fanti, R., Gregorini, L., Klein, U., Mack, K.-H., Vigotti, M., 1999, A&A, 345, 769
  • Murgia (2003) Murgia, M., 2003, PASA, 20, 19
  • Nagai et al. (2006) Nagai, H., Inoue, M., Asada, K., Kameno, S., & Doi, A., 2006, ApJ, 648, 148
  • Neeser et al. (1995) Neeser, M. J., Eales, S. A., Law-Green, J., Duncan, Leahy, J. P., Rawlings, S. 1995, ApJ, 451, 76. ApJ, 380, 66
  • O’Dea & Baum (1997) O’Dea, C.P., & Baum, S.A., 1997, AJ, 113, 148
  • Orienti, Dallacasa & Stanghellini (2007) Orienti, M., Dallacasa, D., & Stanghellini, C., 2007, A&A, 461, 923
  • Orr & Browne (1982) Orr, M. J. L. & Browne, I. W. A., 1982, MNRAS, 200, 1067
  • Pacholczyk (1970) Pacholczyk, A. G., 1970, Radio Astrophysics (San Francisco: Freeman)
  • Parma et al. (1999) Parma, P., Murgia, M., Morganti, R., Capetti, A., de Ruiter, H. R., & Fanti, R., 1999, A&A, 344, 7 214, 463
  • Perley (1985) Perley, R. A., 1985, in Synthesis Imaging, eds. R. A. Perley, F. R. Schwab, and A. H. Bridle (NRAO, Charlottesville) p. 161
  • Perley & Taylor (1991) Perley, R. A., & Taylor, G. B., 1991, AJ, 101, 1623
  • Polatidis and Conway (2003) Polatidis, A. G., Conway, J. E., 2003, PASA, 20, 69
  • Rawlings & Saunders (1991) Rawlings, S., & Saunders, R., 1991, Nature, 349, 138
  • Scheuer (1974) Scheuer, P. A. G., 1974, MNRAS, 166, 513 P. N., Arnaud, K.
  • Snellen et al. (2000) Snellen, I. A. G., Schilizzi, R. T., Miley, G. K., de Bruyn, A. G., Bremer, M. N., & Röttgering, H. J. A., 2000, MNRAS, 319, 445 573, 533 N.,
  • Urry & Padovani (1995) Urry, C. M. & Padovani, P. 1995, PASP,107, 803 D., & MNRAS,
  • Wan & Daly (1998) Wan, L., & Daly, R. A. 1998, ApJ, 499, 614
  • Wan et al. (2000) Wan, L., Daly, R. A., & Guerra, E. J., 2000, ApJ, 544, 671
  • Wellman et al. (1997) Wellman, G. F., Daly, R. A., & Wan, L., 1997, ApJ, 480, 96 (WDW)
  • Willott et al. (1999) Willott, C., Rawlings, S., Blundell, K. M., & Lacy, M., 1999, MNRAS, 309, 1017 J., electronically
  • Xu et al. (1999) Xu, C., Livio, M., & Baum, S. A., 1999, AJ, 118, 1169
Table 1: Comparison of Hot Spot Spectral Indices
Source α𝛼\alpha (2”, N) α𝛼\alpha (1”, N) α𝛼\alpha (2”, S) α𝛼\alpha (1”, S) α381400subscript𝛼381400\alpha_{38-1400} (int)
(1) (2) (3) (4) (5) (6)
3C 6.1 0.84 0.84 0.82 0.82 0.63
3C 34 0.81 0.78 0.84 0.88 1.07
3C 41 0.71 0.70 0.52 0.46 0.69
3C 44 0.89 1.00 0.90 0.96 0.94
3C 54 0.74 0.73 0.78 0.93 0.81
3C 114 0.82 0.98 0.84 0.98 0.90
3C 142.1 0.89 0.94 0.81 0.77 0.87
3C 169.1 0.79 0.77 0.91 0.88
3C 172 0.88 1.03 0.91 1.19 0.78
3C 441 0.65 0.57 0.95 0.88 0.82
3C469.1 1.11 1.36 0.95 1.11 0.86

Col 1: Source Name. Col 2-5: The spectral index of the hotspot between 20 and 6 cm. Col 2: 2-2.5 arcsec resolution, North side. Col 3: 1.0 arcsec resolution, North side. Col 4: 2-2.5 arcsec resolution, South side. Col 5: 1.0 arcsec resolution, South side. Col 6: Spectral index from integrated flux densities at 38 and 1400 MHz. (Except for 3C 34 North and South are really East and West, respectively.)

Table 2: Estimates of Ages of the Eleven Radio Galaxies
Source Side αhssubscript𝛼𝑠\alpha_{hs} αfinalsubscript𝛼final\alpha_{\rm final} θ𝜃\theta ν0Tsubscript𝜈0𝑇\nu_{0T} Bminsubscript𝐵𝑚𝑖𝑛B_{min} t(b=1)subscript𝑡𝑏1t_{(b=1)} t(b=0.25)subscript𝑡𝑏0.25t_{(b=0.25)}
arcsec GHz μ𝜇\mu G Myr Myr
3C 6.1 N 0.84 1.37 9.5 10.6±2.9plus-or-minus10.62.910.6\pm 2.9 50.8±0.6plus-or-minus50.80.650.8\pm 0.6 1.0±0.1plus-or-minus1.00.11.0\pm 0.1 4±1plus-or-minus414\pm 1
3C 6.1 S 0.82 1.34 9 12.6±3.7plus-or-minus12.63.712.6\pm 3.7 39.2±0.6plus-or-minus39.20.639.2\pm 0.6 1.2±0.2plus-or-minus1.20.21.2\pm 0.2 5±1plus-or-minus515\pm 1
3C 34 E 0.81 1.72 20 5.6±0.6plus-or-minus5.60.65.6\pm 0.6 28±0.4plus-or-minus280.428\pm 0.4 3.2±0.2plus-or-minus3.20.23.2\pm 0.2 10±1plus-or-minus10110\pm 1
3C 34 W 0.84 1.95 18.5 4.5±0.4plus-or-minus4.50.44.5\pm 0.4 27.6±0.3plus-or-minus27.60.327.6\pm 0.3 3.5±0.2plus-or-minus3.50.23.5\pm 0.2 12±1plus-or-minus12112\pm 1
3C 41 N 0.71 1.42 10 6.6±1.4plus-or-minus6.61.46.6\pm 1.4 30.2±0.9plus-or-minus30.20.930.2\pm 0.9 2.5±0.3plus-or-minus2.50.32.5\pm 0.3 8±1plus-or-minus818\pm 1
3C 41 S 0.52 1.57 11 3.5±0.3plus-or-minus3.50.33.5\pm 0.3 45±0.4plus-or-minus450.445\pm 0.4 2.0±0.1plus-or-minus2.00.12.0\pm 0.1 9±1plus-or-minus919\pm 1
3C 44 N 0.89 1.97 30.5 4.1±0.6plus-or-minus4.10.64.1\pm 0.6 40±1plus-or-minus40140\pm 1 2.3±0.2plus-or-minus2.30.22.3\pm 0.2 11±2plus-or-minus11211\pm 2
3C 44 S 0.90 2.03 19 3.7±0.4plus-or-minus3.70.43.7\pm 0.4 39.5±0.7plus-or-minus39.50.739.5\pm 0.7 2.5±0.2plus-or-minus2.50.22.5\pm 0.2 12±2plus-or-minus12212\pm 2
3C 54 N 0.74 1.5 21 6.4±1.1plus-or-minus6.41.16.4\pm 1.1 32±1plus-or-minus32132\pm 1 2.4±0.2plus-or-minus2.40.22.4\pm 0.2 7±1plus-or-minus717\pm 1
3C 54 S 0.78 1.98 15.5 3.3±0.4plus-or-minus3.30.43.3\pm 0.4 48.4±0.2plus-or-minus48.40.248.4\pm 0.2 1.8±0.1plus-or-minus1.80.11.8\pm 0.1 9±1plus-or-minus919\pm 1
3C 114 N 0.82 2.07 19.5 3.3±0.3plus-or-minus3.30.33.3\pm 0.3 28.2±0.1plus-or-minus28.20.128.2\pm 0.1 3.8±0.1plus-or-minus3.80.13.8\pm 0.1 11±1plus-or-minus11111\pm 1
3C 114 S 0.84 1.82 22.5 4.1±0.6plus-or-minus4.10.64.1\pm 0.6 27.4±0.3plus-or-minus27.40.327.4\pm 0.3 3.5±0.2plus-or-minus3.50.23.5\pm 0.2 10±1plus-or-minus10110\pm 1
3C 142.1 N 0.89 1.75 13.5 5.5±0.9plus-or-minus5.50.95.5\pm 0.9 39.6±0.1plus-or-minus39.60.139.6\pm 0.1 2.2±0.2plus-or-minus2.20.22.2\pm 0.2 13±2plus-or-minus13213\pm 2
3C 142.1 S 0.81 1.2 30 13±4plus-or-minus13413\pm 4 25.7±0.5plus-or-minus25.70.525.7\pm 0.5 2.7±0.4plus-or-minus2.70.42.7\pm 0.4 12±2plus-or-minus12212\pm 2
3C 169.1 N 0.79 1.33 16 9.3±2.5plus-or-minus9.32.59.3\pm 2.5 19.8±0.1plus-or-minus19.80.119.8\pm 0.1 3.9±0.5plus-or-minus3.90.53.9\pm 0.5 9±1plus-or-minus919\pm 1
3C 169.1 S 0.77 1.5 23.5 6.3±1.4plus-or-minus6.31.46.3\pm 1.4 25.8±0.1plus-or-minus25.80.125.8\pm 0.1 3.4±0.4plus-or-minus3.40.43.4\pm 0.4 11±2plus-or-minus11211\pm 2
3C 172 N 0.91 1.22 20 21±9plus-or-minus21921\pm 9 28.6±0.6plus-or-minus28.60.628.6\pm 0.6 1.7±0.3plus-or-minus1.70.31.7\pm 0.3 7±2plus-or-minus727\pm 2
3C 172 S 0.88 1.01 21.5 86±83plus-or-minus868386\pm 83 25±1plus-or-minus25125\pm 1 1.1±0.5plus-or-minus1.10.51.1\pm 0.5 4±1.5plus-or-minus41.54\pm 1.5
3C 441 N 0.65 1.1 5 9.6±2plus-or-minus9.629.6\pm 2 27.6±0.2plus-or-minus27.60.227.6\pm 0.2 2.4±0.2plus-or-minus2.40.22.4\pm 0.2 8±1plus-or-minus818\pm 1
3C 441 S 0.95 1.35 16.5 17±6plus-or-minus17617\pm 6 37.8±0.7plus-or-minus37.80.737.8\pm 0.7 1.2±0.2plus-or-minus1.20.21.2\pm 0.2 5±1plus-or-minus515\pm 1
3C 469.1 N 1.11 1.76 10.5 9.8±2.1plus-or-minus9.82.19.8\pm 2.1 65±4plus-or-minus65465\pm 4 0.6±0.1plus-or-minus0.60.10.6\pm 0.1 2.4±0.3plus-or-minus2.40.32.4\pm 0.3
3C 469.1 S 0.95 1.96 14.5 4.6±0.7plus-or-minus4.60.74.6\pm 0.7 57.3±0.5plus-or-minus57.30.557.3\pm 0.5 1.0±0.1plus-or-minus1.00.11.0\pm 0.1 3.6±0.3plus-or-minus3.60.33.6\pm 0.3

Col 1: Source Name. Col 2: Side of the source on which the spectral aging was determined. Col 3: The spectral index of the hotspot between 20 and 6 cm. This is adopted as the injection spectral index for the electrons in the lobe. Col 4: The spectral index in the lobe furthest from the hot spot along the brightness ridge line. The errors in hotspot and lobe spectral index are likely dominated by systematic errors rather than by thermal noise and are estimated to be 0.1similar-toabsent0.1\sim 0.1. Note that any constant multiplicative error on the flux density (e.g., due to an absolute flux density calibration error) will subtract out when the difference between the hotspot and lobe spectral index is determined. Col 5: The distance from the hotspot to the location of the maximum spectral index. The estimated error is of order 1 arcsec. Col 6: The estimated break frequency. Col 7: The equipartition magnetic field in the lobe obtained from Bmin=(B10B25)0.5subscript𝐵𝑚𝑖𝑛superscriptsubscript𝐵10subscript𝐵250.5B_{min}=(B_{10}B_{25})^{0.5} using the minimum energy fields obtained at distances of 10 and 25 kpc from the hotspot along the ridge line towards the nucleus. Col 8: The radiative loss age at the distance θ𝜃\theta from the hotspot, assuming the magnetic field is equal to the minimum energy value. Col 9: The radiative loss age at the distance θ𝜃\theta from the hotspot, assuming the magnetic field is equal to 1/4 of the minimum energy value.

Table 3: Summary of Source Properties
Source z r (v/c)𝑣𝑐(v/c) (v/c)𝑣𝑐(v/c) aLsubscript𝑎𝐿a_{L} P10subscript𝑃10P_{10} Ljsubscript𝐿𝑗L_{j} nasubscript𝑛𝑎n_{a}
kpc (b=0.25) (b=1) kpc 1010superscript101010^{-10} dynes cm-2 1044superscript104410^{44} ergs s-1 103superscript10310^{-3} cm-3
3C 239 1.790 69.5 0.044±0.008plus-or-minus0.0440.0080.044\pm 0.008 0.29±0.05plus-or-minus0.290.050.29\pm 0.05 10.0±0.4plus-or-minus10.00.410.0\pm 0.4 15.3±1.8plus-or-minus15.31.815.3\pm 1.8 242±86plus-or-minus24286242\pm 86 0.6±0.3plus-or-minus0.60.30.6\pm 0.3
3C 322 1.681 139.4 0.036±0.006plus-or-minus0.0360.0060.036\pm 0.006 0.21±0.03plus-or-minus0.210.030.21\pm 0.03 19.6±1.0plus-or-minus19.61.019.6\pm 1.0 5.0±0.6plus-or-minus5.00.65.0\pm 0.6 250±89plus-or-minus25089250\pm 89 0.3±0.1plus-or-minus0.30.10.3\pm 0.1
3C 322 1.681 185.3 0.050±0.015plus-or-minus0.0500.0150.050\pm 0.015 0.31±0.10plus-or-minus0.310.100.31\pm 0.10 11.5±1.2plus-or-minus11.51.211.5\pm 1.2 11.3±1.6plus-or-minus11.31.611.3\pm 1.6 264±121plus-or-minus264121264\pm 121 0.3±0.2plus-or-minus0.30.20.3\pm 0.2
3C 68.2 1.575 104.7 0.055±0.015plus-or-minus0.0550.0150.055\pm 0.015 0.37±0.11plus-or-minus0.370.110.37\pm 0.11 8.2±1.9plus-or-minus8.21.98.2\pm 1.9 6.1±1.2plus-or-minus6.11.26.1\pm 1.2 80±43plus-or-minus804380\pm 43 0.1±0.1plus-or-minus0.10.10.1\pm 0.1
3C 68.2 1.575 115.8 0.053±0.009plus-or-minus0.0530.0090.053\pm 0.009 0.37±0.07plus-or-minus0.370.070.37\pm 0.07 9.3±1.1plus-or-minus9.31.19.3\pm 1.1 8.9±1.3plus-or-minus8.91.38.9\pm 1.3 144±55plus-or-minus14455144\pm 55 0.2±0.1plus-or-minus0.20.10.2\pm 0.1
3C 437 1.480 168.4 0.049±0.004plus-or-minus0.0490.0040.049\pm 0.004 0.28±0.03plus-or-minus0.280.030.28\pm 0.03 18.1±1.3plus-or-minus18.11.318.1\pm 1.3 5.2±0.6plus-or-minus5.20.65.2\pm 0.6 294±98plus-or-minus29498294\pm 98 0.2±0.1plus-or-minus0.20.10.2\pm 0.1
3C 437 1.480 160.5 0.080±0.007plus-or-minus0.0800.0070.080\pm 0.007 0.54±0.06plus-or-minus0.540.060.54\pm 0.06 16.7±1.3plus-or-minus16.71.316.7\pm 1.3 9.6±1.2plus-or-minus9.61.29.6\pm 1.2 760±249plus-or-minus760249760\pm 249 0.11±0.04plus-or-minus0.110.040.11\pm 0.04
3C 324 1.210 35.2 0.038±0.010plus-or-minus0.0380.0100.038\pm 0.010 0.26±0.07plus-or-minus0.260.070.26\pm 0.07 7.1±1.4plus-or-minus7.11.47.1\pm 1.4 11.5±2.0plus-or-minus11.52.011.5\pm 2.0 77±39plus-or-minus773977\pm 39 0.6±0.4plus-or-minus0.60.40.6\pm 0.4
3C 194 1.190 50.3 0.023±0.002plus-or-minus0.0230.0020.023\pm 0.002 0.15±0.02plus-or-minus0.150.020.15\pm 0.02 7.2±1.6plus-or-minus7.21.67.2\pm 1.6 5.5±1.0plus-or-minus5.51.05.5\pm 1.0 23±11plus-or-minus231123\pm 11 0.8±0.3plus-or-minus0.80.30.8\pm 0.3
3C 194 1.190 79.6 0.025±0.002plus-or-minus0.0250.0020.025\pm 0.002 0.17±0.02plus-or-minus0.170.020.17\pm 0.02 8.9±1.3plus-or-minus8.91.38.9\pm 1.3 4.8±0.7plus-or-minus4.80.74.8\pm 0.7 35±13plus-or-minus351335\pm 13 0.6±0.2plus-or-minus0.60.20.6\pm 0.2
3C 267 1.144 175.1 0.032±0.007plus-or-minus0.0320.0070.032\pm 0.007 0.21±0.05plus-or-minus0.210.050.21\pm 0.05 8.8±1.2plus-or-minus8.81.28.8\pm 1.2 11.2±1.7plus-or-minus11.21.711.2\pm 1.7 97±41plus-or-minus974197\pm 41 0.8±0.4plus-or-minus0.80.40.8\pm 0.4
3C 267 1.144 165.6 0.029±0.005plus-or-minus0.0290.0050.029\pm 0.005 0.19±0.03plus-or-minus0.190.030.19\pm 0.03 10.7±0.9plus-or-minus10.70.910.7\pm 0.9 7.9±1.0plus-or-minus7.91.07.9\pm 1.0 95±34plus-or-minus953495\pm 34 0.7±0.3plus-or-minus0.70.30.7\pm 0.3
3C 356 1.079 377.1 0.048±0.012plus-or-minus0.0480.0120.048\pm 0.012 0.26±0.07plus-or-minus0.260.070.26\pm 0.07 13.6±2.2plus-or-minus13.62.213.6\pm 2.2 3.4±0.5plus-or-minus3.40.53.4\pm 0.5 105±49plus-or-minus10549105\pm 49 0.11±0.07plus-or-minus0.110.070.11\pm 0.07
3C 356 1.079 251.4 0.045±0.010plus-or-minus0.0450.0100.045\pm 0.010 0.28±0.06plus-or-minus0.280.060.28\pm 0.06 13.6±2.2plus-or-minus13.62.213.6\pm 2.2 6.5±1.0plus-or-minus6.51.06.5\pm 1.0 190±84plus-or-minus19084190\pm 84 0.24±0.14plus-or-minus0.240.140.24\pm 0.14
3C 280 0.996 49.3 0.027±0.004plus-or-minus0.0270.0040.027\pm 0.004 0.18±0.03plus-or-minus0.180.030.18\pm 0.03 7.7±0.5plus-or-minus7.70.57.7\pm 0.5 12.0±1.4plus-or-minus12.01.412.0\pm 1.4 69±24plus-or-minus692469\pm 24 1.2±0.5plus-or-minus1.20.51.2\pm 0.5
3C 280 0.996 60.4 0.014±0.002plus-or-minus0.0140.0020.014\pm 0.002 0.08±0.01plus-or-minus0.080.010.08\pm 0.01 7.7±0.3plus-or-minus7.70.37.7\pm 0.3 7.7±0.9plus-or-minus7.70.97.7\pm 0.9 22±8plus-or-minus22822\pm 8 3.1±1.3plus-or-minus3.11.33.1\pm 1.3
3C 268.1 0.974 201.8 0.025±0.005plus-or-minus0.0250.0050.025\pm 0.005 0.15±0.03plus-or-minus0.150.030.15\pm 0.03 14.5±0.7plus-or-minus14.50.714.5\pm 0.7 2.6±0.3plus-or-minus2.60.32.6\pm 0.3 48±17plus-or-minus481748\pm 17 0.31±0.15plus-or-minus0.310.150.31\pm 0.15
3C 268.1 0.974 171.6 0.041±0.007plus-or-minus0.0410.0070.041\pm 0.007 0.26±0.05plus-or-minus0.260.050.26\pm 0.05 13.8±0.7plus-or-minus13.80.713.8\pm 0.7 4.1±0.5plus-or-minus4.10.54.1\pm 0.5 114±40plus-or-minus11440114\pm 40 0.18±0.08plus-or-minus0.180.080.18\pm 0.08
3C 289 0.967 44.5 0.019±0.003plus-or-minus0.0190.0030.019\pm 0.003 0.13±0.02plus-or-minus0.130.020.13\pm 0.02 8.9±0.3plus-or-minus8.90.38.9\pm 0.3 7.2±0.8plus-or-minus7.20.87.2\pm 0.8 38±12plus-or-minus381238\pm 12 1.6±0.6plus-or-minus1.60.61.6\pm 0.6
3C 289 0.967 46.1 0.021±0.003plus-or-minus0.0210.0030.021\pm 0.003 0.14±0.02plus-or-minus0.140.020.14\pm 0.02 9.7±0.4plus-or-minus9.70.49.7\pm 0.4 7.2±0.8plus-or-minus7.20.87.2\pm 0.8 50±16plus-or-minus501650\pm 16 1.3±0.5plus-or-minus1.30.51.3\pm 0.5
3C 325 0.860 77.7 0.027±0.005plus-or-minus0.0270.0050.027\pm 0.005 0.18±0.03plus-or-minus0.180.030.18\pm 0.03 5.2±1.8plus-or-minus5.21.85.2\pm 1.8 5.1±1.3plus-or-minus5.11.35.1\pm 1.3 14±8plus-or-minus14814\pm 8 0.52±0.27plus-or-minus0.520.270.52\pm 0.27
3C 325 0.860 55.0 0.046±0.010plus-or-minus0.0460.0100.046\pm 0.010 0.33±0.08plus-or-minus0.330.080.33\pm 0.08 7.0±1.3plus-or-minus7.01.37.0\pm 1.3 17.6±2.8plus-or-minus17.62.817.6\pm 2.8 144±63plus-or-minus14463144\pm 63 0.62±0.34plus-or-minus0.620.340.62\pm 0.34
3C 265 0.811 250.0 0.031±0.005plus-or-minus0.0310.0050.031\pm 0.005 0.21±0.04plus-or-minus0.210.040.21\pm 0.04 9.5±1.3plus-or-minus9.51.39.5\pm 1.3 4.9±0.7plus-or-minus4.90.74.9\pm 0.7 48±19plus-or-minus481948\pm 19 0.38±0.18plus-or-minus0.380.180.38\pm 0.18
3C 265 0.811 294.3 0.021±0.004plus-or-minus0.0210.0040.021\pm 0.004 0.11±0.02plus-or-minus0.110.020.11\pm 0.02 9.5±1.3plus-or-minus9.51.39.5\pm 1.3 3.2±0.5plus-or-minus3.20.53.2\pm 0.5 21±9plus-or-minus21921\pm 9 0.56±0.28plus-or-minus0.560.280.56\pm 0.28
3C 247 0.749 39.5 0.027±0.005plus-or-minus0.0270.0050.027\pm 0.005 0.17±0.03plus-or-minus0.170.030.17\pm 0.03 7.8±0.8plus-or-minus7.80.87.8\pm 0.8 5.4±0.7plus-or-minus5.40.75.4\pm 0.7 31±12plus-or-minus311231\pm 12 0.57±0.27plus-or-minus0.570.270.57\pm 0.27
3C 247 0.749 64.7 0.017±0.003plus-or-minus0.0170.0030.017\pm 0.003 0.12±0.02plus-or-minus0.120.020.12\pm 0.02 5.8±0.4plus-or-minus5.80.45.8\pm 0.4 7.5±0.9plus-or-minus7.50.97.5\pm 0.9 15±5plus-or-minus15515\pm 5 1.9±0.8plus-or-minus1.90.81.9\pm 0.8
3C 55 0.720 261.7 0.044±0.009plus-or-minus0.0440.0090.044\pm 0.009 0.29±0.06plus-or-minus0.290.060.29\pm 0.06 11.6±1.0plus-or-minus11.61.011.6\pm 1.0 4.5±0.6plus-or-minus4.50.64.5\pm 0.6 95±35plus-or-minus953595\pm 35 0.18±0.09plus-or-minus0.180.090.18\pm 0.09
3C 55 0.720 268.0 0.055±0.011plus-or-minus0.0550.0110.055\pm 0.011 0.37±0.08plus-or-minus0.370.080.37\pm 0.08 9.5±1.3plus-or-minus9.51.39.5\pm 1.3 4.6±0.7plus-or-minus4.60.74.6\pm 0.7 82±32plus-or-minus823282\pm 32 0.12±0.06plus-or-minus0.120.060.12\pm 0.06
3C 337 0.630 196.1 0.018±0.005plus-or-minus0.0180.0050.018\pm 0.005 0.09±0.03plus-or-minus0.090.030.09\pm 0.03 9.7±0.7plus-or-minus9.70.79.7\pm 0.7 1.4±0.2plus-or-minus1.40.21.4\pm 0.2 8±3plus-or-minus838\pm 3 0.32±0.20plus-or-minus0.320.200.32\pm 0.20
3C 337 0.630 109.5 0.014±0.001plus-or-minus0.0140.0010.014\pm 0.001 0.08±0.01plus-or-minus0.080.010.08\pm 0.01 16.5±0.6plus-or-minus16.50.616.5\pm 0.6 1.6±0.2plus-or-minus1.60.21.6\pm 0.2 22±7plus-or-minus22722\pm 7 0.61±0.22plus-or-minus0.610.220.61\pm 0.22
3C 427.1 0.572 82.8 0.010±0.002plus-or-minus0.0100.0020.010\pm 0.002 0.06±0.01plus-or-minus0.060.010.06\pm 0.01 13.7±0.4plus-or-minus13.70.413.7\pm 0.4 2.7±0.3plus-or-minus2.70.32.7\pm 0.3 18±6plus-or-minus18618\pm 6 2.1±0.8plus-or-minus2.10.82.1\pm 0.8
3C 427.1 0.572 75.0 0.011±0.002plus-or-minus0.0110.0020.011\pm 0.002 0.08±0.01plus-or-minus0.080.010.08\pm 0.01 8.9±0.6plus-or-minus8.90.68.9\pm 0.6 4.4±0.5plus-or-minus4.40.54.4\pm 0.5 14±5plus-or-minus14514\pm 5 2.5±1.0plus-or-minus2.51.02.5\pm 1.0
3C 330 0.549 205.9 0.031±0.005plus-or-minus0.0310.0050.031\pm 0.005 0.21±0.04plus-or-minus0.210.040.21\pm 0.04 10.3±1.4plus-or-minus10.31.410.3\pm 1.4 4.0±0.6plus-or-minus4.00.64.0\pm 0.6 47±18plus-or-minus471847\pm 18 0.3±0.1plus-or-minus0.30.10.3\pm 0.1
3C 330 0.549 199.7 0.029±0.005plus-or-minus0.0290.0050.029\pm 0.005 0.19±0.04plus-or-minus0.190.040.19\pm 0.04 10.3±0.9plus-or-minus10.30.910.3\pm 0.9 3.3±0.4plus-or-minus3.30.43.3\pm 0.4 36±13plus-or-minus361336\pm 13 0.28±0.13plus-or-minus0.280.130.28\pm 0.13
3C 244.1 0.430 155.9 0.015±0.001plus-or-minus0.0150.0010.015\pm 0.001 0.08±0.01plus-or-minus0.080.010.08\pm 0.01 8.5±0.5plus-or-minus8.50.58.5\pm 0.5 1.4±0.2plus-or-minus1.40.21.4\pm 0.2 5±2plus-or-minus525\pm 2 0.49±0.16plus-or-minus0.490.160.49\pm 0.16
3C 244.1 0.430 141.4 0.024±0.002plus-or-minus0.0240.0020.024\pm 0.002 0.16±0.02plus-or-minus0.160.020.16\pm 0.02 7.2±0.5plus-or-minus7.20.57.2\pm 0.5 3.1±0.4plus-or-minus3.10.43.1\pm 0.4 14±4plus-or-minus14414\pm 4 0.40±0.12plus-or-minus0.400.120.40\pm 0.12
3C 405 0.056 63.8 0.009±0.001plus-or-minus0.0090.0010.009\pm 0.001 0.07±0.01plus-or-minus0.070.010.07\pm 0.01 10.7±0.3plus-or-minus10.70.310.7\pm 0.3 7.4±0.9plus-or-minus7.40.97.4\pm 0.9 26±6plus-or-minus26626\pm 6 7.7±2.7plus-or-minus7.72.77.7\pm 2.7
3C 405 0.056 72.5 0.009±0.001plus-or-minus0.0090.0010.009\pm 0.001 0.07±0.01plus-or-minus0.070.010.07\pm 0.01 10.7±0.3plus-or-minus10.70.310.7\pm 0.3 6.1±0.7plus-or-minus6.10.76.1\pm 0.7 22±5plus-or-minus22522\pm 5 6.3±2.4plus-or-minus6.32.46.3\pm 2.4
3C 6.1 0.840 106.0 0.052±0.009plus-or-minus0.0520.0090.052\pm 0.009 0.25±0.04plus-or-minus0.250.040.25\pm 0.04 4.99±0.07plus-or-minus4.990.074.99\pm 0.07 8.09±0.07plus-or-minus8.090.078.09\pm 0.07 38±7plus-or-minus38738\pm 7 0.22±0.06plus-or-minus0.220.060.22\pm 0.06
3C 6.1 0.840 92.2 0.047±0.008plus-or-minus0.0470.0080.047\pm 0.008 0.18±0.03plus-or-minus0.180.030.18\pm 0.03 11.29±0.03plus-or-minus11.290.0311.29\pm 0.03 3.04±0.01plus-or-minus3.040.013.04\pm 0.01 64±15plus-or-minus641564\pm 15 0.10±0.03plus-or-minus0.100.030.10\pm 0.03
3C 34 0.690 170.4 0.045±0.004plus-or-minus0.0450.0040.045\pm 0.004 0.15±0.01plus-or-minus0.150.010.15\pm 0.01 13.91±0.01plus-or-minus13.910.0113.91\pm 0.01 2.01±0.01plus-or-minus2.010.012.01\pm 0.01 63±13plus-or-minus631363\pm 13 0.07±0.01plus-or-minus0.070.010.07\pm 0.01
3C 34 0.690 149.9 0.038±0.002plus-or-minus0.0380.0020.038\pm 0.002 0.12±0.01plus-or-minus0.120.010.12\pm 0.01 11.28±0.04plus-or-minus11.280.0411.28\pm 0.04 1.63±0.01plus-or-minus1.630.011.63\pm 0.01 28±5plus-or-minus28528\pm 5 0.09±0.01plus-or-minus0.090.010.09\pm 0.01
3C 41 0.794 93.8 0.032±0.005plus-or-minus0.0320.0050.032\pm 0.005 0.10±0.01plus-or-minus0.100.010.10\pm 0.01 7.28±0.06plus-or-minus7.280.067.28\pm 0.06 2.86±0.02plus-or-minus2.860.022.86\pm 0.02 17±4plus-or-minus17417\pm 4 0.21±0.06plus-or-minus0.210.060.21\pm 0.06
3C 41 0.794 84.8 0.030±0.004plus-or-minus0.0300.0040.030\pm 0.004 0.14±0.01plus-or-minus0.140.010.14\pm 0.01 7.49±0.01plus-or-minus7.490.017.49\pm 0.01 6.71±0.01plus-or-minus6.710.016.71\pm 0.01 40±7plus-or-minus40740\pm 7 0.56±0.12plus-or-minus0.560.120.56\pm 0.12
3C 44 0.660 280.0 0.065±0.008plus-or-minus0.0650.0080.065\pm 0.008 0.31±0.02plus-or-minus0.310.020.31\pm 0.02 5.90±0.05plus-or-minus5.900.055.90\pm 0.05 3.44±0.02plus-or-minus3.440.023.44\pm 0.02 28±4plus-or-minus28428\pm 4 0.06±0.01plus-or-minus0.060.010.06\pm 0.01
3C 44 0.660 172.2 0.038±0.004plus-or-minus0.0380.0040.038\pm 0.004 0.18±0.01plus-or-minus0.180.010.18\pm 0.01 8.35±0.02plus-or-minus8.350.028.35\pm 0.02 2.94±0.01plus-or-minus2.940.012.94\pm 0.01 28±4plus-or-minus28428\pm 4 0.15±0.02plus-or-minus0.150.020.15\pm 0.02
3C 54 0.827 201.9 0.071±0.008plus-or-minus0.0710.0080.071\pm 0.008 0.22±0.02plus-or-minus0.220.020.22\pm 0.02 9.74±0.02plus-or-minus9.740.029.74\pm 0.02 2.92±0.01plus-or-minus2.920.012.92\pm 0.01 70±15plus-or-minus701570\pm 15 0.04±0.01plus-or-minus0.040.010.04\pm 0.01
3C 54 0.827 187.6 0.045±0.006plus-or-minus0.0450.0060.045\pm 0.006 0.21±0.02plus-or-minus0.210.020.21\pm 0.02 7.86±0.01plus-or-minus7.860.017.86\pm 0.01 4.86±0.01plus-or-minus4.860.014.86\pm 0.01 48±7plus-or-minus48748\pm 7 0.18±0.03plus-or-minus0.180.030.18\pm 0.03
3C 114 0.815 192.1 0.045±0.003plus-or-minus0.0450.0030.045\pm 0.003 0.13±0.01plus-or-minus0.130.010.13\pm 0.01 18.09±0.01plus-or-minus18.090.0118.09\pm 0.01 1.37±0.002plus-or-minus1.370.0021.37\pm 0.002 72±15plus-or-minus721572\pm 15 0.05±0.01plus-or-minus0.050.010.05\pm 0.01
3C 114 0.815 209.5 0.058±0.004plus-or-minus0.0580.0040.058\pm 0.004 0.16±0.01plus-or-minus0.160.010.16\pm 0.01 15.19±0.01plus-or-minus15.190.0115.19\pm 0.01 1.47±0.002plus-or-minus1.470.0021.47\pm 0.002 70±15plus-or-minus701570\pm 15 0.03±0.00plus-or-minus0.030.000.03\pm 0.00
3C 142.1 0.406 99.2 0.019±0.003plus-or-minus0.0190.0030.019\pm 0.003 0.11±0.01plus-or-minus0.110.010.11\pm 0.01 6.77±0.00plus-or-minus6.770.006.77\pm 0.00 4.39±0.005plus-or-minus4.390.0054.39\pm 0.005 13±2plus-or-minus13213\pm 2 0.95±0.17plus-or-minus0.950.170.95\pm 0.17
3C 142.1 0.406 185.1 0.047±0.008plus-or-minus0.0470.0080.047\pm 0.008 0.20±0.03plus-or-minus0.200.030.20\pm 0.03 9.49±0.01plus-or-minus9.490.019.49\pm 0.01\par 1.82±0.003plus-or-minus1.820.0031.82\pm 0.003 27±6plus-or-minus27627\pm 6 0.06±0.02plus-or-minus0.060.020.06\pm 0.02
3C 169.1 0.633 131.4 0.039±0.005plus-or-minus0.0390.0050.039\pm 0.005 0.09±0.01plus-or-minus0.090.010.09\pm 0.01 20.17±0.01plus-or-minus20.170.0120.17\pm 0.01\par 0.58±0.002plus-or-minus0.580.0020.58\pm 0.002 33±8plus-or-minus33833\pm 8 0.03±0.01plus-or-minus0.030.010.03\pm 0.01
3C 169.1 0.633 189.7 0.048±0.006plus-or-minus0.0480.0060.048\pm 0.006 0.16±0.02plus-or-minus0.160.020.16\pm 0.02 12.98±0.02plus-or-minus12.980.0212.98\pm 0.02 1.16±0.003plus-or-minus1.160.0031.16\pm 0.003 34±7plus-or-minus34734\pm 7 0.04±0.01plus-or-minus0.040.010.04\pm 0.01
3C 172 0.519 294.7 0.058±0.013plus-or-minus0.0580.0130.058\pm 0.013 0.24±0.05plus-or-minus0.240.050.24\pm 0.05 6.01±0.11plus-or-minus6.010.116.01\pm 0.11 2.01±0.03plus-or-minus2.010.032.01\pm 0.03 15±4plus-or-minus15415\pm 4 0.04±0.02plus-or-minus0.040.020.04\pm 0.02
3C 172 0.519 333.0 0.119±0.058plus-or-minus0.1190.0580.119\pm 0.058 0.43±0.21plus-or-minus0.430.210.43\pm 0.21 14.14±0.01plus-or-minus14.140.0114.14\pm 0.01 1.92±0.004plus-or-minus1.920.0041.92\pm 0.004 163±83plus-or-minus16383163\pm 83 0.01±0.01plus-or-minus0.010.010.01\pm 0.01
3C 441 0.707 69.4 0.015±0.001plus-or-minus0.0150.0010.015\pm 0.001 0.049±0.004plus-or-minus0.0490.0040.049\pm 0.004 19.16±0.01plus-or-minus19.160.0119.16\pm 0.01 1.40±0.002plus-or-minus1.400.0021.40\pm 0.002 28±6plus-or-minus28628\pm 6 0.45±0.06plus-or-minus0.450.060.45\pm 0.06
3C 441 0.707 169.7 0.076±0.016plus-or-minus0.0760.0160.076\pm 0.016 0.33±0.06plus-or-minus0.330.060.33\pm 0.06 10.14±0.02plus-or-minus10.140.0210.14\pm 0.02 3.11±0.01plus-or-minus3.110.013.11\pm 0.01 87±21plus-or-minus872187\pm 21 0.04±0.02plus-or-minus0.040.020.04\pm 0.02
3C 469.1 1.336 306.1 0.124±0.020plus-or-minus0.1240.0200.124\pm 0.020 0.49±0.07plus-or-minus0.490.070.49\pm 0.07 6.97±0.04plus-or-minus6.970.046.97\pm 0.04 17.17±0.07plus-or-minus17.170.0717.17\pm 0.07 368±79plus-or-minus36879368\pm 79 0.08±0.02plus-or-minus0.080.020.08\pm 0.02
3C 469.1 1.336 327.5 0.112±0.012plus-or-minus0.1120.0120.112\pm 0.012 0.40±0.04plus-or-minus0.400.040.40\pm 0.04 13.54±0.02plus-or-minus13.540.0213.54\pm 0.02 6.48±0.01plus-or-minus6.480.016.48\pm 0.01 473±96plus-or-minus47396473\pm 96 0.04±0.01plus-or-minus0.040.010.04\pm 0.01
Table 3: continued.

All calculations follow WDW and assume b = 0.25 except where noted. The top part of the table contains the properties of the previous sample of 20 radio sources recalculated for the currently adopted cosmology. The bottom part of the table contains the new sample of 11 radio galaxies. Col 1. Source Name. Col 2. redshift. Col 3. The distance between the core and hotspot. Col 4. The source expansion speed. Col 5. The source expansion speed for b= 1. Col 6. The half-width of the lobe at a projected distance of 10 kpc along the ridge line from the hotspot towards the core. Col 7. The minimum energy pressure in the lobe at a projected distance of 10 kpc along the ridge line from the hotspot towards the core. Col 8. The beam power. Col 9. The ambient density.

Table 4: Summary of Source Properties. II
Source TT(b=0.25)subscript𝑇𝑇𝑏0.25T_{T(b=0.25)} ET(b=0.25)subscript𝐸𝑇𝑏0.25E_{T(b=0.25)} TT(b=1)subscript𝑇𝑇𝑏1T_{T(b=1)} ET(b=1)subscript𝐸𝑇𝑏1E_{T(b=1)}
107superscript10710^{7} yr 106superscript10610^{6} Msubscript𝑀M_{\sun} 107superscript10710^{7} yr 106superscript10610^{6} Msubscript𝑀M_{\sun}
3C 239 1.2±0.4plus-or-minus1.20.41.2\pm 0.4 5.1±1.5plus-or-minus5.11.55.1\pm 1.5 0.17±0.04plus-or-minus0.170.040.17\pm 0.04 1.02±0.26plus-or-minus1.020.261.02\pm 0.26
3C 322 1.2±0.3plus-or-minus1.20.31.2\pm 0.3 5.2±1.5plus-or-minus5.21.55.2\pm 1.5 0.18±0.05plus-or-minus0.180.050.18\pm 0.05 0.97±0.25plus-or-minus0.970.250.97\pm 0.25
3C 322 1.2±0.4plus-or-minus1.20.41.2\pm 0.4 5.4±1.7plus-or-minus5.41.75.4\pm 1.7 0.16±0.05plus-or-minus0.160.050.16\pm 0.05 1.04±0.31plus-or-minus1.040.311.04\pm 0.31
3C 68.2 2.1±0.7plus-or-minus2.10.72.1\pm 0.7 3.0±1.0plus-or-minus3.01.03.0\pm 1.0 0.29±0.09plus-or-minus0.290.090.29\pm 0.09 0.59±0.19plus-or-minus0.590.190.59\pm 0.19
3C 68.2 1.6±0.5plus-or-minus1.60.51.6\pm 0.5 4.0±1.2plus-or-minus4.01.24.0\pm 1.2 0.21±0.06plus-or-minus0.210.060.21\pm 0.06 0.81±0.22plus-or-minus0.810.220.81\pm 0.22
3C 437 1.1±0.3plus-or-minus1.10.31.1\pm 0.3 5.7±1.6plus-or-minus5.71.65.7\pm 1.6 0.16±0.04plus-or-minus0.160.040.16\pm 0.04 1.05±0.26plus-or-minus1.050.261.05\pm 0.26
3C 437 0.7±0.2plus-or-minus0.70.20.7\pm 0.2 9.1±2.6plus-or-minus9.12.69.1\pm 2.6 0.09±0.02plus-or-minus0.090.020.09\pm 0.02 1.83±0.46plus-or-minus1.830.461.83\pm 0.46
3C 324 2.2±0.7plus-or-minus2.20.72.2\pm 0.7 2.9±1.0plus-or-minus2.91.02.9\pm 1.0 0.29±0.09plus-or-minus0.290.090.29\pm 0.09 0.59±0.18plus-or-minus0.590.180.59\pm 0.18
3C 194 3.9±1.3plus-or-minus3.91.33.9\pm 1.3 1.6±0.5plus-or-minus1.60.51.6\pm 0.5 0.55±0.16plus-or-minus0.550.160.55\pm 0.16 0.31±0.09plus-or-minus0.310.090.31\pm 0.09
3C 194 3.2±1.0plus-or-minus3.21.03.2\pm 1.0 1.9±0.6plus-or-minus1.90.61.9\pm 0.6 0.45±0.12plus-or-minus0.450.120.45\pm 0.12 0.38±0.10plus-or-minus0.380.100.38\pm 0.10
3C 267 1.9±0.6plus-or-minus1.90.61.9\pm 0.6 3.3±1.0plus-or-minus3.31.03.3\pm 1.0 0.26±0.07plus-or-minus0.260.070.26\pm 0.07 0.65±0.18plus-or-minus0.650.180.65\pm 0.18
3C 267 1.9±0.6plus-or-minus1.90.61.9\pm 0.6 3.2±0.9plus-or-minus3.20.93.2\pm 0.9 0.27±0.07plus-or-minus0.270.070.27\pm 0.07 0.63±0.17plus-or-minus0.630.170.63\pm 0.17
3C 356 1.8±0.6plus-or-minus1.80.61.8\pm 0.6 3.4±1.1plus-or-minus3.41.13.4\pm 1.1 0.28±0.08plus-or-minus0.280.080.28\pm 0.08 0.62±0.18plus-or-minus0.620.180.62\pm 0.18
3C 356 1.4±0.4plus-or-minus1.40.41.4\pm 0.4 4.6±1.5plus-or-minus4.61.54.6\pm 1.5 0.19±0.06plus-or-minus0.190.060.19\pm 0.06 0.88±0.25plus-or-minus0.880.250.88\pm 0.25
3C 280 2.3±0.7plus-or-minus2.30.72.3\pm 0.7 2.7±0.8plus-or-minus2.70.82.7\pm 0.8 0.31±0.08plus-or-minus0.310.080.31\pm 0.08 0.54±0.14plus-or-minus0.540.140.54\pm 0.14
3C 280 4.0±1.2plus-or-minus4.01.24.0\pm 1.2 1.6±0.4plus-or-minus1.60.41.6\pm 0.4 0.58±0.15plus-or-minus0.580.150.58\pm 0.15 0.29±0.08plus-or-minus0.290.080.29\pm 0.08
3C 268.1 2.7±0.8plus-or-minus2.70.82.7\pm 0.8 2.3±0.7plus-or-minus2.30.72.3\pm 0.7 0.40±0.11plus-or-minus0.400.110.40\pm 0.11 0.43±0.11plus-or-minus0.430.110.43\pm 0.11
3C 268.1 1.8±0.5plus-or-minus1.80.51.8\pm 0.5 3.5±1.0plus-or-minus3.51.03.5\pm 1.0 0.25±0.06plus-or-minus0.250.060.25\pm 0.06 0.69±0.18plus-or-minus0.690.180.69\pm 0.18
3C 289 3.1±0.9plus-or-minus3.10.93.1\pm 0.9 2.0±0.6plus-or-minus2.00.62.0\pm 0.6 0.42±0.11plus-or-minus0.420.110.42\pm 0.11 0.41±0.10plus-or-minus0.410.100.41\pm 0.10
3C 289 2.7±0.8plus-or-minus2.70.82.7\pm 0.8 2.3±0.7plus-or-minus2.30.72.3\pm 0.7 0.36±0.09plus-or-minus0.360.090.36\pm 0.09 0.47±0.12plus-or-minus0.470.120.47\pm 0.12
3C 325 5.1±2.0plus-or-minus5.12.05.1\pm 2.0 1.2±0.5plus-or-minus1.20.51.2\pm 0.5 0.72±0.24plus-or-minus0.720.240.72\pm 0.24 0.24±0.08plus-or-minus0.240.080.24\pm 0.08
3C 325 1.6±0.5plus-or-minus1.60.51.6\pm 0.5 4.0±1.3plus-or-minus4.01.34.0\pm 1.3 0.21±0.06plus-or-minus0.210.060.21\pm 0.06 0.82±0.24plus-or-minus0.820.240.82\pm 0.24
3C 265 2.7±0.8plus-or-minus2.70.82.7\pm 0.8 2.3±0.7plus-or-minus2.30.72.3\pm 0.7 0.37±0.10plus-or-minus0.370.100.37\pm 0.10 0.46±0.12plus-or-minus0.460.120.46\pm 0.12
3C 265 4.1±1.3plus-or-minus4.11.34.1\pm 1.3 1.5±0.5plus-or-minus1.50.51.5\pm 0.5 0.62±0.17plus-or-minus0.620.170.62\pm 0.17 0.27±0.08plus-or-minus0.270.080.27\pm 0.08
3C 247 3.4±1.0plus-or-minus3.41.03.4\pm 1.0 1.8±0.5plus-or-minus1.80.51.8\pm 0.5 0.47±0.13plus-or-minus0.470.130.47\pm 0.13 0.36±0.10plus-or-minus0.360.100.36\pm 0.10
3C 247 4.8±1.4plus-or-minus4.81.44.8\pm 1.4 1.3±0.4plus-or-minus1.30.41.3\pm 0.4 0.65±0.17plus-or-minus0.650.170.65\pm 0.17 0.26±0.07plus-or-minus0.260.070.26\pm 0.07
3C 55 1.9±0.6plus-or-minus1.90.61.9\pm 0.6 3.2±0.9plus-or-minus3.20.93.2\pm 0.9 0.27±0.07plus-or-minus0.270.070.27\pm 0.07 0.64±0.17plus-or-minus0.640.170.64\pm 0.17
3C 55 2.1±0.6plus-or-minus2.10.62.1\pm 0.6 3.0±0.9plus-or-minus3.00.93.0\pm 0.9 0.29±0.08plus-or-minus0.290.080.29\pm 0.08 0.60±0.17plus-or-minus0.600.170.60\pm 0.17
3C 337 6.6±2.1plus-or-minus6.62.16.6\pm 2.1 0.9±0.3plus-or-minus0.90.30.9\pm 0.3 1.05±0.30plus-or-minus1.050.301.05\pm 0.30 0.16±0.05plus-or-minus0.160.050.16\pm 0.05
3C 337 4.0±1.1plus-or-minus4.01.14.0\pm 1.1 1.6±0.4plus-or-minus1.60.41.6\pm 0.4 0.61±0.15plus-or-minus0.610.150.61\pm 0.15 0.28±0.07plus-or-minus0.280.070.28\pm 0.07
3C 427.1 4.5±1.3plus-or-minus4.51.34.5\pm 1.3 1.4±0.4plus-or-minus1.40.41.4\pm 0.4 0.62±0.16plus-or-minus0.620.160.62\pm 0.16 0.28±0.07plus-or-minus0.280.070.28\pm 0.07
3C 427.1 5.0±1.4plus-or-minus5.01.45.0\pm 1.4 1.2±0.4plus-or-minus1.20.41.2\pm 0.4 0.68±0.18plus-or-minus0.680.180.68\pm 0.18 0.25±0.07plus-or-minus0.250.070.25\pm 0.07
3C 330 2.8±0.8plus-or-minus2.80.82.8\pm 0.8 2.3±0.7plus-or-minus2.30.72.3\pm 0.7 0.38±0.10plus-or-minus0.380.100.38\pm 0.10 0.45±0.12plus-or-minus0.450.120.45\pm 0.12
3C 330 3.1±0.9plus-or-minus3.10.93.1\pm 0.9 2.0±0.6plus-or-minus2.00.62.0\pm 0.6 0.44±0.12plus-or-minus0.440.120.44\pm 0.12 0.39±0.10plus-or-minus0.390.100.39\pm 0.10
3C 244.1 8.3±2.3plus-or-minus8.32.38.3\pm 2.3 0.8±0.2plus-or-minus0.80.20.8\pm 0.2 1.24±0.31plus-or-minus1.240.311.24\pm 0.31 0.14±0.03plus-or-minus0.140.030.14\pm 0.03
3C 244.1 5.0±1.4plus-or-minus5.01.45.0\pm 1.4 1.2±0.3plus-or-minus1.20.31.2\pm 0.3 0.70±0.17plus-or-minus0.700.170.70\pm 0.17 0.24±0.06plus-or-minus0.240.060.24\pm 0.06
3C 405 3.7±1.0plus-or-minus3.71.03.7\pm 1.0 1.7±0.4plus-or-minus1.70.41.7\pm 0.4 0.48±0.12plus-or-minus0.480.120.48\pm 0.12 0.36±0.09plus-or-minus0.360.090.36\pm 0.09
3C 405 4.1±1.1plus-or-minus4.11.14.1\pm 1.1 1.5±0.4plus-or-minus1.50.41.5\pm 0.4 0.52±0.13plus-or-minus0.520.130.52\pm 0.13 0.33±0.08plus-or-minus0.330.080.33\pm 0.08
3C 6.1 3.1±0.8plus-or-minus3.10.83.1\pm 0.8 2.0±0.5plus-or-minus2.00.52.0\pm 0.5 0.50±0.12plus-or-minus0.500.120.50\pm 0.12 0.34±0.08plus-or-minus0.340.080.34\pm 0.08
3C 6.1 2.4±0.6plus-or-minus2.40.62.4\pm 0.6 2.7±0.7plus-or-minus2.70.72.7\pm 0.7 0.42±0.10plus-or-minus0.420.100.42\pm 0.10 0.40±0.10plus-or-minus0.400.100.40\pm 0.10
3C 34 2.4±0.6plus-or-minus2.40.62.4\pm 0.6 2.6±0.7plus-or-minus2.60.72.6\pm 0.7 0.46±0.11plus-or-minus0.460.110.46\pm 0.11 0.37±0.09plus-or-minus0.370.090.37\pm 0.09
3C 34 3.6±0.9plus-or-minus3.60.93.6\pm 0.9 1.7±0.4plus-or-minus1.70.41.7\pm 0.4 0.71±0.16plus-or-minus0.710.160.71\pm 0.16 0.24±0.06plus-or-minus0.240.060.24\pm 0.06
3C 41 4.6±1.2plus-or-minus4.61.24.6\pm 1.2 1.4±0.4plus-or-minus1.40.41.4\pm 0.4 0.91±0.22plus-or-minus0.910.220.91\pm 0.22 0.19±0.05plus-or-minus0.190.050.19\pm 0.05
3C 41 3.0±0.7plus-or-minus3.00.73.0\pm 0.7 2.1±0.5plus-or-minus2.10.52.1\pm 0.5 0.49±0.12plus-or-minus0.490.120.49\pm 0.12 0.35±0.08plus-or-minus0.350.080.35\pm 0.08
3C 44 3.6±0.9plus-or-minus3.60.93.6\pm 0.9 1.7±0.4plus-or-minus1.70.41.7\pm 0.4 0.58±0.14plus-or-minus0.580.140.58\pm 0.14 0.29±0.07plus-or-minus0.290.070.29\pm 0.07
3C 44 3.6±0.9plus-or-minus3.60.93.6\pm 0.9 1.8±0.4plus-or-minus1.80.41.8\pm 0.4 0.58±0.14plus-or-minus0.580.140.58\pm 0.14 0.29±0.07plus-or-minus0.290.070.29\pm 0.07
3C 54 2.3±0.6plus-or-minus2.30.62.3\pm 0.6 2.8±0.7plus-or-minus2.80.72.8\pm 0.7 0.45±0.11plus-or-minus0.450.110.45\pm 0.11 0.38±0.09plus-or-minus0.380.090.38\pm 0.09
3C 54 2.7±0.7plus-or-minus2.70.72.7\pm 0.7 2.3±0.6plus-or-minus2.30.62.3\pm 0.6 0.44±0.10plus-or-minus0.440.100.44\pm 0.10 0.38±0.09plus-or-minus0.380.090.38\pm 0.09
3C 114 2.2±0.6plus-or-minus2.20.62.2\pm 0.6 2.8±0.7plus-or-minus2.80.72.8\pm 0.7 0.47±0.11plus-or-minus0.470.110.47\pm 0.11 0.36±0.08plus-or-minus0.360.080.36\pm 0.08
3C 114 2.3±0.6plus-or-minus2.30.62.3\pm 0.6 2.8±0.7plus-or-minus2.80.72.8\pm 0.7 0.48±0.11plus-or-minus0.480.110.48\pm 0.11 0.35±0.08plus-or-minus0.350.080.35\pm 0.08
3C 142.1 5.2±1.2plus-or-minus5.21.25.2\pm 1.2 1.2±0.3plus-or-minus1.20.31.2\pm 0.3 0.76±0.18plus-or-minus0.760.180.76\pm 0.18 0.23±0.05plus-or-minus0.230.050.23\pm 0.05
3C 142.1 3.6±0.9plus-or-minus3.60.93.6\pm 0.9 1.7±0.4plus-or-minus1.70.41.7\pm 0.4 0.62±0.15plus-or-minus0.620.150.62\pm 0.15 0.28±0.07plus-or-minus0.280.070.28\pm 0.07
3C 169.1 3.3±0.9plus-or-minus3.30.93.3\pm 0.9 1.9±0.5plus-or-minus1.90.51.9\pm 0.5 0.75±0.18plus-or-minus0.750.180.75\pm 0.18 0.23±0.05plus-or-minus0.230.050.23\pm 0.05
3C 169.1 3.3±0.8plus-or-minus3.30.83.3\pm 0.8 1.9±0.5plus-or-minus1.90.51.9\pm 0.5 0.64±0.15plus-or-minus0.640.150.64\pm 0.15 0.27±0.06plus-or-minus0.270.060.27\pm 0.06
3C 172 4.9±1.3plus-or-minus4.91.34.9\pm 1.3 1.3±0.3plus-or-minus1.30.31.3\pm 0.3 0.85±0.21plus-or-minus0.850.210.85\pm 0.21 0.20±0.05plus-or-minus0.200.050.20\pm 0.05
3C 172 1.5±0.5plus-or-minus1.50.51.5\pm 0.5 4.2±1.5plus-or-minus4.21.54.2\pm 1.5 0.28±0.09plus-or-minus0.280.090.28\pm 0.09 0.62±0.21plus-or-minus0.620.210.62\pm 0.21
3C 441 3.6±0.9plus-or-minus3.60.93.6\pm 0.9 1.8±0.4plus-or-minus1.80.41.8\pm 0.4 0.71±0.17plus-or-minus0.710.170.71\pm 0.17 0.24±0.06plus-or-minus0.240.060.24\pm 0.06
3C 441 2.0±0.5plus-or-minus2.00.52.0\pm 0.5 3.1±0.8plus-or-minus3.10.83.1\pm 0.8 0.35±0.09plus-or-minus0.350.090.35\pm 0.09 0.49±0.12plus-or-minus0.490.120.49\pm 0.12
3C 469.1 1.0±0.3plus-or-minus1.00.31.0\pm 0.3 6.3±1.6plus-or-minus6.31.66.3\pm 1.6 0.17±0.04plus-or-minus0.170.040.17\pm 0.04 0.97±0.24plus-or-minus0.970.240.97\pm 0.24
3C 469.1 0.9±0.2plus-or-minus0.90.20.9\pm 0.2 7.2±1.8plus-or-minus7.21.87.2\pm 1.8 0.16±0.04plus-or-minus0.160.040.16\pm 0.04 1.04±0.25plus-or-minus1.040.251.04\pm 0.25
Table 4: continued.

The top part of the table contains the properties of the previous sample of 20 radio sources recalculated for the currently adopted cosmology. The bottom part of the table contains the new sample of 11 radio galaxies. Col 1. Source Name. Col 2. The total lifetime of the outflow (b=0.25). Col 3. The total energy of the outflow (b=0.25). Col 4. The total lifetime of the outflow (b = 1). Col 5. The total energy of the outflow (b = 1).

Table 5: Fits to the Data (b = 0.25)
Relationship Slope Y intercept χ2superscript𝜒2\chi^{2} Corr. ?
T𝑇T vs 1 + z 2.00±0.2plus-or-minus2.000.2-2.00\pm 0.2 6.1±0.5plus-or-minus6.10.56.1\pm 0.5 90.6 Y
Log T𝑇T vs Log (1 + z) 1.80±0.2plus-or-minus1.800.2-1.80\pm 0.2 0.9±0.06plus-or-minus0.90.060.9\pm 0.06 100.8 Y
T𝑇T vs r𝑟r 4.00±1.4×10³plus-or-minus4.001.4superscript103-4.00\pm 1.4\times 10^{-3} 2.5±0.3plus-or-minus2.50.32.5\pm 0.3 181.6 N
Log T𝑇T vs Log r𝑟r 0.25±0.11plus-or-minus0.250.11-0.25\pm 0.11 1±0.2plus-or-minus10.21\pm 0.2 183 N
ETsubscript𝐸𝑇E_{T} vs 1 + z 1.70±0.3plus-or-minus1.700.31.70\pm 0.3 1.1±0.5plus-or-minus1.10.5-1.1\pm 0.5 92.8 Y
Log ETsubscript𝐸𝑇E_{T} vs Log (1 + z) 1.80±0.2plus-or-minus1.800.21.80\pm 0.2 0.1±0.06plus-or-minus0.10.06-0.1\pm 0.06 100.8 Y
ETsubscript𝐸𝑇E_{T} vs r𝑟r 1.40±1.4×10³plus-or-minus1.401.4superscript1031.40\pm 1.4\times 10^{-3} 1.5±0.2plus-or-minus1.50.21.5\pm 0.2 138 N
Log ETsubscript𝐸𝑇E_{T} vs Log r𝑟r 0.25±0.11plus-or-minus0.250.110.25\pm 0.11 0.2±0.2plus-or-minus0.20.2-0.2\pm 0.2 183 N
nasubscript𝑛𝑎n_{a} vs. r𝑟r 1.90±0.9×10⁴plus-or-minus1.900.9superscript104-1.90\pm 0.9\times 10^{-4} 0.09±0.04plus-or-minus0.090.040.09\pm 0.04 347.3 N
Log nasubscript𝑛𝑎n_{a} vs. Log r𝑟r 1.90±0.2plus-or-minus1.900.2-1.90\pm 0.2 3.4±0.5plus-or-minus3.40.53.4\pm 0.5 561.9 Y
Log nasubscript𝑛𝑎n_{a} vs. Log (1 + z) 1.90±1.1plus-or-minus1.901.1-1.90\pm 1.1 0.3±0.3plus-or-minus0.30.3-0.3\pm 0.3 1213.6 N
v/c vs. r𝑟r 1.30±0.3×10⁴plus-or-minus1.300.3superscript1041.30\pm 0.3\times 10^{-4} 0.006±0.003plus-or-minus0.0060.0030.006\pm 0.003 741.1 N
Log v/c vs. Log r𝑟r 0.70±0.1plus-or-minus0.700.10.70\pm 0.1 3±0.2plus-or-minus30.2-3\pm 0.2 740.9 N
v/c vs. 1 + z 0.02±0.004plus-or-minus0.020.0040.02\pm 0.004 0.01±0.006plus-or-minus0.010.006-0.01\pm 0.006 747.5 N
Log v/c vs. Log (1 + z) 1.50±0.4plus-or-minus1.500.41.50\pm 0.4 1.88±0.1plus-or-minus1.880.1-1.88\pm 0.1 966.9 N
Ljsubscript𝐿𝑗L_{j} vs. r𝑟r 0.01±0.03plus-or-minus0.010.030.01\pm 0.03 16±5plus-or-minus16516\pm 5 364.8 N
Log Ljsubscript𝐿𝑗L_{j} vs. Log r𝑟r 0.60±0.2plus-or-minus0.600.20.60\pm 0.2 0.3±0.5plus-or-minus0.30.50.3\pm 0.5 710.6 N
Ljsubscript𝐿𝑗L_{j} vs. 1 + z 36.50±9plus-or-minus36.50936.50\pm 9 38±13plus-or-minus3813-38\pm 13 280.1 N
Log Ljsubscript𝐿𝑗L_{j} vs Log (1 + z) 3.80±0.5plus-or-minus3.800.53.80\pm 0.5 0.72±0.11plus-or-minus0.720.110.72\pm 0.11 361.4 Y

The best fits to the radio source relationships for b = 0.25. Col 1. The relationship. v/c is the lobe expansion velocity, r𝑟r is the core-hotspot separation, Ljsubscript𝐿𝑗L_{j} (×1044absentsuperscript1044\times 10^{44} ergs s-1) is the beam power, nasubscript𝑛𝑎n_{a} (×103absentsuperscript103\times 10^{-3} cm -3) is the ambient density, TTsubscript𝑇𝑇T_{T} is the source lifetime, and ETsubscript𝐸𝑇E_{T} is the total energy. Col 2. The best fit slope. Col 3. The best fit Y intercept. Col 4. The χ2superscript𝜒2\chi^{2} for 60 points and 58 degrees of freedom. Col 5. Is there a correlation? The uncertainty of the best fit parameter is multiplied by (χ2/58)superscript𝜒258\sqrt{(\chi^{2}/58)} to obtain the normalized uncertainty in the best fit parameter,and this is compared with the value of the best fit parameter to determine whether the correlation is significant.

Table 6: Fits to the Data (b = 1)
Relationship Slope Y intercept χ2superscript𝜒2\chi^{2} Corr. ?
T𝑇T vs 1 + z 3.20±0.4plus-or-minus3.200.4-3.20\pm 0.4 9.5±0.8plus-or-minus9.50.89.5\pm 0.8 113.9 Y
Log T𝑇T vs Log (1 + z) 1.90±0.3plus-or-minus1.900.3-1.90\pm 0.3 1.12±0.07plus-or-minus1.120.071.12\pm 0.07 131.5 Y
T𝑇T vs r𝑟r 3.40±2.5×10³plus-or-minus3.402.5superscript103-3.40\pm 2.5\times 10^{-3} 3.1±0.5plus-or-minus3.10.53.1\pm 0.5 255 N
Log T𝑇T vs Log r𝑟r 0.15±0.12plus-or-minus0.150.12-0.15\pm 0.12 1±0.3plus-or-minus10.31\pm 0.3 253.1 N
ETsubscript𝐸𝑇E_{T} vs 1 + z 3.50±0.6plus-or-minus3.500.63.50\pm 0.6 2.7±1plus-or-minus2.71-2.7\pm 1 113.7 Y
Log ETsubscript𝐸𝑇E_{T} vs Log (1 + z) 1.90±0.3plus-or-minus1.900.31.90\pm 0.3 0.11±0.07plus-or-minus0.110.070.11\pm 0.07 131.5 Y
ETsubscript𝐸𝑇E_{T} vs r𝑟r 1.00±3×10³plus-or-minus1.003superscript1031.00\pm 3\times 10^{-3} 2.7±0.4plus-or-minus2.70.42.7\pm 0.4 171.3 N
Log ETsubscript𝐸𝑇E_{T} vs Log r𝑟r 0.15±0.12plus-or-minus0.150.120.15\pm 0.12 0.3±0.3plus-or-minus0.30.30.3\pm 0.3 253.1 N
nasubscript𝑛𝑎n_{a} vs. r𝑟r 5.00±1×10⁶plus-or-minus5.001superscript106-5.00\pm 1\times 10^{-6} 0.002±0.003plus-or-minus0.0020.0030.002\pm 0.003 300.9 N
Log nasubscript𝑛𝑎n_{a} vs. Log r𝑟r 1.38±0.14plus-or-minus1.380.14-1.38\pm 0.14 0.3±0.3plus-or-minus0.30.30.3\pm 0.3 328.3 Y
Log nasubscript𝑛𝑎n_{a} vs. Log (1 + z) 1.60±0.6plus-or-minus1.600.6-1.60\pm 0.6 2.27±0.17plus-or-minus2.270.17-2.27\pm 0.17 760.3 N
v/c vs. r𝑟r 7.10±1.1×10⁴plus-or-minus7.101.1superscript1047.10\pm 1.1\times 10^{-4} 0.02±0.01plus-or-minus0.020.010.02\pm 0.01 572.8 N
Log v/c vs. Log r𝑟r 0.54±0.12plus-or-minus0.540.120.54\pm 0.12 1.9±0.3plus-or-minus1.90.3-1.9\pm 0.3 827.6 N
v/c vs. 1 + z 0.10±0.03plus-or-minus0.100.030.10\pm 0.03 0.07±0.05plus-or-minus0.070.05-0.07\pm 0.05 823.7 N
Log v/c vs. Log (1 + z) 1.80±0.3plus-or-minus1.800.31.80\pm 0.3 1.24±0.09plus-or-minus1.240.09-1.24\pm 0.09 771.5 N
Ljsubscript𝐿𝑗L_{j} vs. r𝑟r 0.04±0.03plus-or-minus0.040.030.04\pm 0.03 15±5plus-or-minus15515\pm 5 873.8 N
Log Ljsubscript𝐿𝑗L_{j} vs. Log r𝑟r 0.50±0.2plus-or-minus0.500.20.50\pm 0.2 0.4±0.5plus-or-minus0.40.50.4\pm 0.5 2072 N
Ljsubscript𝐿𝑗L_{j} vs. 1 + z 44.00±10plus-or-minus44.001044.00\pm 10 50±17plus-or-minus5017-50\pm 17 690.5 N
Log Ljsubscript𝐿𝑗L_{j} vs Log (1 + z) 4.70±0.5plus-or-minus4.700.54.70\pm 0.5 0.44±0.13plus-or-minus0.440.130.44\pm 0.13 933.1 N

The best fits to the radio source relationships for b = 1. Col 1 The relationship. v/c is the lobe expansion velocity, r𝑟r is the core-hotspot separation, Ljsubscript𝐿𝑗L_{j} (×1044absentsuperscript1044\times 10^{44} ergs s-1) is the beam power, nasubscript𝑛𝑎n_{a} (×103absentsuperscript103\times 10^{-3} cm -3) is the ambient density, T𝑇T is the source lifetime, and ETsubscript𝐸𝑇E_{T} is the total energy. Col 2. The best fit slope. Col 3. The best fit Y intercept. Col 4. The χ2superscript𝜒2\chi^{2} for 60 points and 58 degrees of freedom. Col 5. Is there a correlation? The uncertainty of the best fit parameter is multiplied by (χ2/58)superscript𝜒258\sqrt{(\chi^{2}/58)} to obtain the normalized uncertainty in the best fit parameter,and this is compared with the value of the best fit parameter to determine whether the correlation is significant.

Refer to caption
Figure 1: 3C6.1 north hot spot. 8.4 GHz VLA image from Kharb et al. (2008) with CLEAN restoring beam FWHM 0.23×0.200.230.200.23\times 0.20 arcsec (shown in the inset in the lower left). Two circles are shown centered on the brightness peak. The larger circle has a diameter of 2.0 arcsec, while the smaller circle has a diameter of 1.0 arcsec.
Refer to caption
Figure 2: 3C6.1 south hot spot. 8.4 GHz VLA image from Kharb et al. (2008) with CLEAN restoring beam FWHM 0.23×0.200.230.200.23\times 0.20 arcsec (shown in the inset in the lower left). Two circles are shown centered on the brightness peak. The larger circle has a diameter of 2.0 arcsec, while the smaller circle has a diameter of 1.0 arcsec.
Refer to caption
Figure 3: 3C34 east hot spot. 8.4 GHz VLA image from Kharb et al. (2008) with CLEAN restoring beam FWHM 0.33×0.260.330.260.33\times 0.26 arcsec (shown in the inset in the lower left). Two circles are shown centered on the brightness peak. The larger circle has a diameter of 2.0 arcsec, while the smaller circle has a diameter of 1.0 arcsec.
Refer to caption
Figure 4: 3C34 west hot spot. 8.4 GHz VLA image from Kharb et al. (2008) with CLEAN restoring beam FWHM 0.33×0.260.330.260.33\times 0.26 arcsec (shown in the inset in the lower left). Two circles are shown centered on the brightness peak. The larger circle has a diameter of 2.0 arcsec, while the smaller circle has a diameter of 1.0 arcsec.
Refer to caption
Figure 5: 3C41 north hot spot. 8.4 GHz VLA image from Kharb et al. (2008) with CLEAN restoring beam FWHM 0.21×0.190.210.190.21\times 0.19 arcsec (shown in the inset in the lower left). Two circles are shown centered on the brightness peak. The larger circle has a diameter of 2.0 arcsec, while the smaller circle has a diameter of 1.0 arcsec.
Refer to caption
Figure 6: 3C41 south hot spot. 8.4 GHz VLA image from Kharb et al. (2008) with CLEAN restoring beam FWHM 0.21×0.190.210.190.21\times 0.19 arcsec (shown in the inset in the lower left). Two circles are shown centered on the brightness peak. The larger circle has a diameter of 2.0 arcsec, while the smaller circle has a diameter of 1.0 arcsec.
Refer to caption
Figure 7: 3C44 north hot spot. 8.4 GHz VLA image from Kharb et al. (2008) with CLEAN restoring beam FWHM 0.22×0.210.220.210.22\times 0.21 arcsec (shown in the inset in the lower left). Two circles are shown centered on the brightness peak. The larger circle has a diameter of 2.5 arcsec, while the smaller circle has a diameter of 1.0 arcsec.
Refer to caption
Figure 8: 3C44 south hot spot. 8.4 GHz VLA image from Kharb et al. (2008) with CLEAN restoring beam FWHM 0.22×0.210.220.210.22\times 0.21 arcsec (shown in the inset in the lower left). Two circles are shown centered on the brightness peak. The larger circle has a diameter of 2.5 arcsec, while the smaller circle has a diameter of 1.0 arcsec.
Refer to caption
Figure 9: 3C54 north hot spot. 8.4 GHz VLA image from Kharb et al. (2008) with CLEAN restoring beam FWHM 0.22×0.180.220.180.22\times 0.18 arcsec (shown in the inset in the lower left). Two circles are shown centered on the brightness peak. The larger circle has a diameter of 2.5 arcsec, while the smaller circle has a diameter of 1.0 arcsec.
Refer to caption
Figure 10: 3C54 south hot spot. 8.4 GHz VLA image from Kharb et al. (2008) with CLEAN restoring beam FWHM 0.22×0.180.220.180.22\times 0.18 arcsec (shown in the inset in the lower left). Two circles are shown centered on the brightness peak. The larger circle has a diameter of 2.5 arcsec, while the smaller circle has a diameter of 1.0 arcsec.
Refer to caption
Figure 11: 3C114 north hot spot. 8.4 GHz VLA image from Kharb et al. (2008) with CLEAN restoring beam FWHM 0.22×0.210.220.210.22\times 0.21 arcsec (shown in the inset in the lower left). Two circles are shown centered on the brightness peak. The larger circle has a diameter of 2.5 arcsec, while the smaller circle has a diameter of 1.0 arcsec.
Refer to caption
Figure 12: 3C114 south hot spot. 8.4 GHz VLA image from Kharb et al. (2008) with CLEAN restoring beam FWHM 0.22×0.210.220.210.22\times 0.21 arcsec (shown in the inset in the lower left). Two circles are shown centered on the brightness peak. The larger circle has a diameter of 2.5 arcsec, while the smaller circle has a diameter of 1.0 arcsec.
Refer to caption
Figure 13: 3C142.1 north hot spot. 8.4 GHz VLA image from Kharb et al. (2008) with CLEAN restoring beam FWHM 0.24×0.230.240.230.24\times 0.23 arcsec (shown in the inset in the lower left). Two circles are shown centered on the brightness peak. The larger circle has a diameter of 2.0 arcsec, while the smaller circle has a diameter of 1.0 arcsec.
Refer to caption
Figure 14: 3C142.1 south hot spot. 8.4 GHz VLA image from Kharb et al. (2008) with CLEAN restoring beam FWHM 0.24×0.230.240.230.24\times 0.23 arcsec (shown in the inset in the lower left). Two circles are shown centered on the brightness peak. The larger circle has a diameter of 2.0 arcsec, while the smaller circle has a diameter of 1.0 arcsec.
Refer to caption
Figure 15: 3C169.1 south hot spot. 8.4 GHz VLA image from Kharb et al. (2008) with CLEAN restoring beam FWHM 0.24×0.190.240.190.24\times 0.19 arcsec (shown in the inset in the lower left). Two circles are shown centered on the brightness peak. The larger circle has a diameter of 2.5 arcsec, while the smaller circle has a diameter of 1.0 arcsec.
Refer to caption
Figure 16: 3C172 north hot spot. 8.4 GHz VLA image from Kharb et al. (2008) with CLEAN restoring beam FWHM 0.26×0.230.260.230.26\times 0.23 arcsec (shown in the inset in the lower left). Two circles are shown centered on the brightness peak. The larger circle has a diameter of 2.5 arcsec, while the smaller circle has a diameter of 1.0 arcsec.
Refer to caption
Figure 17: 3C172 south hot spot. 8.4 GHz VLA image from Kharb et al. (2008) with CLEAN restoring beam FWHM 0.26×0.230.260.230.26\times 0.23 arcsec (shown in the inset in the lower left). Two circles are shown centered on the brightness peak. The larger circle has a diameter of 2.5 arcsec, while the smaller circle has a diameter of 1.0 arcsec.
Refer to caption
Figure 18: 3C441 north hot spot. 8.4 GHz VLA image from Kharb et al. (2008) with CLEAN restoring beam FWHM 0.23×0.220.230.220.23\times 0.22 arcsec (shown in the inset in the lower left). Two circles are shown centered on the brightness peak. The larger circle has a diameter of 2.5 arcsec, while the smaller circle has a diameter of 1.0 arcsec.
Refer to caption
Figure 19: 3C441 south hot spot. 8.4 GHz VLA image from Kharb et al. (2008) with CLEAN restoring beam FWHM 0.23×0.220.230.220.23\times 0.22 arcsec (shown in the inset in the lower left). Two circles are shown centered on the brightness peak. The larger circle has a diameter of 2.5 arcsec, while the smaller circle has a diameter of 1.0 arcsec.
Refer to caption
Figure 20: 3C469.1 north hot spot. 8.4 GHz VLA image from Kharb et al. (2008) with CLEAN restoring beam FWHM 0.32×0.180.320.180.32\times 0.18 arcsec (shown in the inset in the lower left). Two circles are shown centered on the brightness peak. The larger circle has a diameter of 2.5 arcsec, while the smaller circle has a diameter of 1.0 arcsec.
Refer to caption
Figure 21: 3C469.1 south hot spot. 8.4 GHz VLA image from Kharb et al. (2008) with CLEAN restoring beam FWHM 0.32×0.180.320.180.32\times 0.18 arcsec (shown in the inset in the lower left). Two circles are shown centered on the brightness peak. The larger circle has a diameter of 2.5 arcsec, while the smaller circle has a diameter of 1.0 arcsec.
Refer to caption
Figure 22: Source advance velocity v/c𝑣𝑐v/c as a function of core-hotspot distance r𝑟r for b=1.
Refer to caption
Figure 23: Source advance velocity v/c𝑣𝑐v/c as a function of core-hotspot distance r𝑟r for b=0.25.
Refer to caption
Figure 24: Source advance velocity v/c𝑣𝑐v/c as a function of redshift (1+z) for b=1.
Refer to caption
Figure 25: Source advance velocity v/c𝑣𝑐v/c as a function of redshift (1+z) for b=0.25.
Refer to caption
Figure 26: Pressure in the lobe P𝑃P measured at 10 h1superscript1h^{-1} kpc from the hotspot toward the central region of the source, as a function of core-hotspot distance r𝑟r for b = 0.25. The pressure for b=1𝑏1b=1 is lower by a factor of 0.218 since P(b=1)=0.218P(b=0.25)𝑃𝑏10.218𝑃𝑏0.25P(b=1)=0.218P(b=0.25).
Refer to caption
Figure 27: Pressure in the lobe P𝑃P measured at 10 h1superscript1h^{-1} kpc from the hotspot toward the central region of the source, as a function of (1+z)1𝑧(1+z) for b = 0.25. The pressure for b=1𝑏1b=1 is lower by a factor of 0.218 since P(b=1)=0.218P(b=0.25)𝑃𝑏10.218𝑃𝑏0.25P(b=1)=0.218P(b=0.25).
Refer to caption
Figure 28: Beam Power Ljsubscript𝐿𝑗L_{j} as a function of core-hotspot distance r𝑟r for b=1.
Refer to caption
Figure 29: Beam Power Ljsubscript𝐿𝑗L_{j} as a function of core-hotspot distance r𝑟r for b=0.25.
Refer to caption
Figure 30: Beam Power Ljsubscript𝐿𝑗L_{j} as a function of redshift (1+z) for b=1.
Refer to caption
Figure 31: Beam Power Ljsubscript𝐿𝑗L_{j} as a function of redshift (1+z) for b=0.25.
Refer to caption
Figure 32: Ambient density nasubscript𝑛𝑎n_{a} as a function of core-hotspot distance r𝑟r for b=1.
Refer to caption
Figure 33: Ambient density nasubscript𝑛𝑎n_{a} as a function of core-hotspot distance r𝑟r for b=0.25.
Refer to caption
Figure 34: Ambient density nasubscript𝑛𝑎n_{a} as a function of redshift (1+z) for b=1.
Refer to caption
Figure 35: Ambient density nasubscript𝑛𝑎n_{a} as a function of redshift (1+z) for b=0.25.
Refer to caption
Figure 36: Source lifetime TTsubscript𝑇𝑇T_{T} as a function of core-hotspot distance r𝑟r for b=1.
Refer to caption
Figure 37: Source lifetime TTsubscript𝑇𝑇T_{T} as a function of core-hotspot distance r𝑟r for b=0.25.
Refer to caption
Figure 38: Source lifetime TTsubscript𝑇𝑇T_{T} as a function of redshift (1 + z) for b=1.
Refer to caption
Figure 39: Source lifetime TTsubscript𝑇𝑇T_{T} as a function of redshift (1 + z) for b=0.25.
Refer to caption
Figure 40: Source total Energy ETsubscript𝐸𝑇E_{T} as a function of core-hotspot distance r𝑟r for b=1.
Refer to caption
Figure 41: Source total Energy ETsubscript𝐸𝑇E_{T} as a function of core-hotspot distance r𝑟r for b=0.25.
Refer to caption
Figure 42: Source total Energy ETsubscript𝐸𝑇E_{T} as a function of redshift (1 + z) for b=1.
Refer to caption
Figure 43: Source total Energy ETsubscript𝐸𝑇E_{T} as a function of redshift (1 + z) for b=0.25.

Appendix A Comparison of Methods for Determining Spectral Ages

In sections 2.2 and 3.1 we determined the spectral age and velocity using a two position measurement of the spectral index gradient. Here, we consider the velocity of the source obtained at multiple locations on each side of each source, and find results that are very similar and consistent with those obtained in section 3.1.

To obtain the velocity at several different locations across the source, we determine the spectral index at intervals of 2.5 arcsec (roughly one CLEAN beam FWHM) from the hot spot along the brightness ridge of the lobe. At each position we determine the break frequency by comparing the observed spectral index with the calculations of the JP model using the Myers and Spangler method. The one sigma range of the spectral index was used to obtain the uncertainty of the break frequency. The age of the electrons at that location is obtained using equation (1), and the age and distance from the hot spot are combined to obtain the rate of growth of the source (the expansion velocity); the source, angular separation of each interval from the hot spot, break frequencies at zero redshift, and source velocities are listed in (Table LABEL:tabposn). The average rate of growth of each side is obtained using the weighted mean expansion velocity for each lobe, and is also listed. Positions near the hot spot (where there is little spectral aging) have high and uncertain break frequencies. The weighted average velocities for each lobe are consistent with those we determined using the two position method. Figures 44 - 47 show the average velocity as a function of core to hot spot distance and redshift including the velocities derived from the multiple position method. The results are in very good agreement with our results from the two position method, which is easily seen by comparing Figures 1, 2, 3, and 4 with Figures A.1, A.2, A.3, and A.4. The agreement between the two methods is about 1 sigma. If the two velocity determinations are compared without accounting for the uncertainty of each velocity, the scatter between the two methods is about 24%.

To view the comparison between the two determinations of the rate of growth of the sources, we can consider fits to the 11 new radio galaxies only. There are no discernible differences between fits to v(r)𝑣𝑟v(r) or v(1+z)𝑣1𝑧v(1+z) for b=1𝑏1b=1 and b=0.25𝑏0.25b=0.25 using method A, which is that described in the main text, and method B, which is described here. Generally, the χ2superscript𝜒2\chi^{2} of the fits is very large, so it is appropriate to multiple the error of the best fit parameters by (χ2/58)superscript𝜒258\sqrt{(\chi^{2}/58)}, as described earlier. For b=1𝑏1b=1, the slope of vB(r)=0.0005±0.0005subscript𝑣𝐵𝑟plus-or-minus0.00050.0005v_{B}(r)=0.0005\pm 0.0005, while vA(r)=0.0009±0.0002subscript𝑣𝐴𝑟plus-or-minus0.00090.0002v_{A}(r)=0.0009\pm 0.0002, both of which indicate either no or a very weak dependence of v𝑣v with D𝐷D and which are consistent at about one sigma; we also find that vB(1+z)=0.1±0.3subscript𝑣𝐵1𝑧plus-or-minus0.10.3v_{B}(1+z)=0.1\pm 0.3, while vA(1+z)=0.1±0.3subscript𝑣𝐴1𝑧plus-or-minus0.10.3v_{A}(1+z)=0.1\pm 0.3, which are consistent and neither of which indicates a significant trend. Here and throughout the units of distance r are kpc and the velocity v is relative to the speed of light. For b=0.25𝑏0.25b=0.25, the slope of vB(r)=0.0001±0.0001subscript𝑣𝐵𝑟plus-or-minus0.00010.0001v_{B}(r)=0.0001\pm 0.0001, while vA(r)=0.0003±0.00003subscript𝑣𝐴𝑟plus-or-minus0.00030.00003v_{A}(r)=0.0003\pm 0.00003, which are consistent at a few sigma and neither of which indicates a strong trend; we also find vB(1+z)=0.05±0.05subscript𝑣𝐵1𝑧plus-or-minus0.050.05v_{B}(1+z)=0.05\pm 0.05 and vA(1+z)=0.06±0.06subscript𝑣𝐴1𝑧plus-or-minus0.060.06v_{A}(1+z)=0.06\pm 0.06, both of which are consistent with zero slope and with each other.

In addition, we can compare the slopes of the fits to the full samples with the velocities of the eleven new sources determined using method A and method B. For b=1𝑏1b=1, the slope of vB(r)=0.0004±0.0004subscript𝑣𝐵𝑟plus-or-minus0.00040.0004v_{B}(r)=0.0004\pm 0.0004, while vA(r)=0.0001±0.0001subscript𝑣𝐴𝑟plus-or-minus0.00010.0001v_{A}(r)=0.0001\pm 0.0001, both of which indicate no dependence of v𝑣v with D𝐷D; we also find that vB(1+z)=0.1±0.1subscript𝑣𝐵1𝑧plus-or-minus0.10.1v_{B}(1+z)=0.1\pm 0.1, while vA(1+z)=0.02±0.015subscript𝑣𝐴1𝑧plus-or-minus0.020.015v_{A}(1+z)=0.02\pm 0.015, which are consistent at the one sigma level and neither of which indicates a significant trend. For b=0.25𝑏0.25b=0.25, the slope of vB(r)=0.0001±0.0001subscript𝑣𝐵𝑟plus-or-minus0.00010.0001v_{B}(r)=0.0001\pm 0.0001, while vA(r)=0.0007±0.0004subscript𝑣𝐴𝑟plus-or-minus0.00070.0004v_{A}(r)=0.0007\pm 0.0004, which are consistent at better than two sigma and neither of which indicates a strong trend; we also find vB(1+z)=0.02±0.02subscript𝑣𝐵1𝑧plus-or-minus0.020.02v_{B}(1+z)=0.02\pm 0.02 and vA(1+z)=0.1±0.1subscript𝑣𝐴1𝑧plus-or-minus0.10.1v_{A}(1+z)=0.1\pm 0.1, both of which are consistent with zero slope and with each other.

Clearly, results obtained with method A and method B are very similar.

Table 7: Estimates of Velocities at Multiple Positions in the Lobes in the Eleven Radio Galaxies
Source Side θ𝜃\theta ν0Tsubscript𝜈0𝑇\nu_{0T} v/c (b=0.25) v/c (b=1)
arcsec GHz
3C6.1 N 5 57±53plus-or-minus575357\pm 53 0.0629±0.0303plus-or-minus0.06290.03030.0629\pm 0.0303 0.303±0.143plus-or-minus0.3030.1430.303\pm 0.143
7.5 140±230plus-or-minus140230140\pm 230 0.1510±0.1219plus-or-minus0.15100.12190.1510\pm 0.1219 0.728±0.584plus-or-minus0.7280.5840.728\pm 0.584
10 25±13plus-or-minus251325\pm 13 0.0839±0.0245plus-or-minus0.08390.02450.0839\pm 0.0245 0.404±0.111plus-or-minus0.4040.1110.404\pm 0.111
avg 0.0770±0.0190plus-or-minus0.07700.01900.0770\pm 0.0190 0.370±0.090plus-or-minus0.3700.0900.370\pm 0.090
3C6.1 S 5 14±4plus-or-minus14414\pm 4 0.0272±0.0047plus-or-minus0.02720.00470.0272\pm 0.0047 0.107±0.018plus-or-minus0.1070.0180.107\pm 0.018
7.5 30±18plus-or-minus301830\pm 18 0.0603±0.0185plus-or-minus0.06030.01850.0603\pm 0.0185 0.236±0.071plus-or-minus0.2360.0710.236\pm 0.071
avg 0.0290±0.0050plus-or-minus0.02900.00500.0290\pm 0.0050 0.110±0.020plus-or-minus0.1100.0200.110\pm 0.020
3C34 E 5 66±66plus-or-minus666666\pm 66 0.0388±0.0196plus-or-minus0.03880.01960.0388\pm 0.0196 0.125±0.063plus-or-minus0.1250.0630.125\pm 0.063
7.5 32±18plus-or-minus321832\pm 18 0.0405±0.0117plus-or-minus0.04050.01170.0405\pm 0.0117 0.131±0.038plus-or-minus0.1310.0380.131\pm 0.038
10 38±26plus-or-minus382638\pm 26 0.0591±0.0200plus-or-minus0.05910.02000.0591\pm 0.0200 0.191±0.064plus-or-minus0.1910.0640.191\pm 0.064
12.5 14±4plus-or-minus14414\pm 4 0.0450±0.0071plus-or-minus0.04500.00710.0450\pm 0.0071 0.145±0.022plus-or-minus0.1450.0220.145\pm 0.022
15 14±4plus-or-minus14414\pm 4 0.0532±0.0083plus-or-minus0.05320.00830.0532\pm 0.0083 0.172±0.026plus-or-minus0.1720.0260.172\pm 0.026
17.5 12±3plus-or-minus12312\pm 3 0.0572±0.0083plus-or-minus0.05720.00830.0572\pm 0.0083 0.185±0.026plus-or-minus0.1850.0260.185\pm 0.026
20 7.1±1.1plus-or-minus7.11.17.1\pm 1.1 0.0507±0.0051plus-or-minus0.05070.00510.0507\pm 0.0051 0.164±0.016plus-or-minus0.1640.0160.164\pm 0.016
avg 0.0500±0.0030plus-or-minus0.05000.00300.0500\pm 0.0030 0.160±0.010plus-or-minus0.1600.0100.160\pm 0.010
3C34 W 5 18±7plus-or-minus18718\pm 7 0.0202±0.0041plus-or-minus0.02020.00410.0202\pm 0.0041 0.063±0.013plus-or-minus0.0630.0130.063\pm 0.013
7.5 13±4plus-or-minus13413\pm 4 0.0261±0.0038plus-or-minus0.02610.00380.0261\pm 0.0038 0.081±0.012plus-or-minus0.0810.0120.081\pm 0.012
10 19±69plus-or-minus196919\pm 69 0.0411±0.0754plus-or-minus0.04110.07540.0411\pm 0.0754 0.128±0.234plus-or-minus0.1280.2340.128\pm 0.234
12.5 7.5±1.6plus-or-minus7.51.67.5\pm 1.6 0.0324±0.0037plus-or-minus0.03240.00370.0324\pm 0.0037 0.101±0.011plus-or-minus0.1010.0110.101\pm 0.011
15 6.5±1.0plus-or-minus6.51.06.5\pm 1.0 0.0363±0.0032plus-or-minus0.03630.00320.0363\pm 0.0032 0.113±0.009plus-or-minus0.1130.0090.113\pm 0.009
avg 0.0298±0.0020plus-or-minus0.02980.00200.0298\pm 0.0020 0.093±0.005plus-or-minus0.0930.0050.093\pm 0.005
3C41 N 2.5 29±18plus-or-minus291829\pm 18 0.0165±0.0054plus-or-minus0.01650.00540.0165\pm 0.0054 0.051±0.017plus-or-minus0.0510.0170.051\pm 0.017
5 17±6plus-or-minus17617\pm 6 0.0256±0.0051plus-or-minus0.02560.00510.0256\pm 0.0051 0.079±0.016plus-or-minus0.0790.0160.079\pm 0.016
7.5 8.6±2.1plus-or-minus8.62.18.6\pm 2.1 0.0271±0.0043plus-or-minus0.02710.00430.0271\pm 0.0043 0.084±0.013plus-or-minus0.0840.0130.084\pm 0.013
avg 0.0240±0.0030plus-or-minus0.02400.00300.0240\pm 0.0030 0.073±0.008plus-or-minus0.0730.0080.073\pm 0.008
3C41 S 2.5 33±22plus-or-minus332233\pm 22 0.0206±0.0074plus-or-minus0.02060.00740.0206\pm 0.0074 0.094±0.033plus-or-minus0.0940.0330.094\pm 0.033
5 5.9±1.2plus-or-minus5.91.25.9\pm 1.2 0.0175±0.0028plus-or-minus0.01750.00280.0175\pm 0.0028 0.080±0.011plus-or-minus0.0800.0110.080\pm 0.011
avg 0.0180±0.0030plus-or-minus0.01800.00300.0180\pm 0.0030 0.080±0.010plus-or-minus0.0800.0100.080\pm 0.010
3C44 N 5 18±8plus-or-minus18818\pm 8 0.0220±0.0053plus-or-minus0.02200.00530.0220\pm 0.0053 0.104±0.023plus-or-minus0.1040.0230.104\pm 0.023
10 17±7plus-or-minus17717\pm 7 0.0433±0.0102plus-or-minus0.04330.01020.0433\pm 0.0102 0.204±0.045plus-or-minus0.2040.0450.204\pm 0.045
15 4.2±0.9plus-or-minus4.20.94.2\pm 0.9 0.0337±0.0048plus-or-minus0.03370.00480.0337\pm 0.0048 0.159±0.017plus-or-minus0.1590.0170.159\pm 0.017
20 16±8plus-or-minus16816\pm 8 0.0836±0.0218plus-or-minus0.08360.02180.0836\pm 0.0218 0.394±0.096plus-or-minus0.3940.0960.394\pm 0.096
25 6.5±1.1plus-or-minus6.51.16.5\pm 1.1 0.0666±0.0089plus-or-minus0.06660.00890.0666\pm 0.0089 0.314±0.030plus-or-minus0.3140.0300.314\pm 0.030
avg 0.0360±0.0030plus-or-minus0.03600.00300.0360\pm 0.0030 0.170±0.010plus-or-minus0.1700.0100.170\pm 0.010
3C44 S 5 28±15plus-or-minus281528\pm 15 0.0277±0.0080plus-or-minus0.02770.00800.0277\pm 0.0080 0.131±0.036plus-or-minus0.1310.0360.131\pm 0.036
10 7.6±1.8plus-or-minus7.61.87.6\pm 1.8 0.0290±0.0044plus-or-minus0.02900.00440.0290\pm 0.0044 0.137±0.017plus-or-minus0.1370.0170.137\pm 0.017
15 5.2±0.6plus-or-minus5.20.65.2\pm 0.6 0.0358±0.0041plus-or-minus0.03580.00410.0358\pm 0.0041 0.170±0.011plus-or-minus0.1700.0110.170\pm 0.011
20 3.4±0.3plus-or-minus3.40.33.4\pm 0.3 0.0390±0.0042plus-or-minus0.03900.00420.0390\pm 0.0042 0.185±0.010plus-or-minus0.1850.0100.185\pm 0.010
avg 0.0340±0.0030plus-or-minus0.03400.00300.0340\pm 0.0030 0.170±0.010plus-or-minus0.1700.0100.170\pm 0.010
3C54 N 2.5 140±220plus-or-minus140220140\pm 220 0.0391±0.0317plus-or-minus0.03910.03170.0391\pm 0.0317 0.124±0.100plus-or-minus0.1240.1000.124\pm 0.100
5 16±7plus-or-minus16716\pm 7 0.0267±0.0058plus-or-minus0.02670.00580.0267\pm 0.0058 0.085±0.018plus-or-minus0.0850.0180.085\pm 0.018
7.5 15±6plus-or-minus15615\pm 6 0.0394±0.0084plus-or-minus0.03940.00840.0394\pm 0.0084 0.125±0.027plus-or-minus0.1250.0270.125\pm 0.027
10 23±12plus-or-minus231223\pm 12 0.0646±0.0167plus-or-minus0.06460.01670.0646\pm 0.0167 0.205±0.053plus-or-minus0.2050.0530.205\pm 0.053
12.5 21±10plus-or-minus211021\pm 10 0.0760±0.0185plus-or-minus0.07600.01850.0760\pm 0.0185 0.241±0.059plus-or-minus0.2410.0590.241\pm 0.059
15 15±5plus-or-minus15515\pm 5 0.0775±0.0151plus-or-minus0.07750.01510.0775\pm 0.0151 0.245±0.047plus-or-minus0.2450.0470.245\pm 0.047
17.5 15±6plus-or-minus15615\pm 6 0.0919±0.0182plus-or-minus0.09190.01820.0919\pm 0.0182 0.291±0.057plus-or-minus0.2910.0570.291\pm 0.057
20 7.4±1.7plus-or-minus7.41.77.4\pm 1.7 0.0729±0.0098plus-or-minus0.07290.00980.0729\pm 0.0098 0.231±0.031plus-or-minus0.2310.0310.231\pm 0.031
22.5 6.0±1.2plus-or-minus6.01.26.0\pm 1.2 0.0734±0.0091plus-or-minus0.07340.00910.0734\pm 0.0091 0.233±0.028plus-or-minus0.2330.0280.233\pm 0.028
avg 0.0510±0.0030plus-or-minus0.05100.00300.0510\pm 0.0030 0.160±0.010plus-or-minus0.1600.0100.160\pm 0.010
3C54 S 2.5 34±23plus-or-minus342334\pm 23 0.0232±0.0085plus-or-minus0.02320.00850.0232\pm 0.0085 0.110±0.039plus-or-minus0.1100.0390.110\pm 0.039
5 18±8plus-or-minus18818\pm 8 0.0344±0.0086plus-or-minus0.03440.00860.0344\pm 0.0086 0.163±0.038plus-or-minus0.1630.0380.163\pm 0.038
7.5 9.8±2.6plus-or-minus9.82.69.8\pm 2.6 0.0376±0.0067plus-or-minus0.03760.00670.0376\pm 0.0067 0.178±0.027plus-or-minus0.1780.0270.178\pm 0.027
10 7.6±1.4plus-or-minus7.61.47.6\pm 1.4 0.0442±0.0066plus-or-minus0.04420.00660.0442\pm 0.0066 0.209±0.024plus-or-minus0.2090.0240.209\pm 0.024
12.5 4.9±0.6plus-or-minus4.90.64.9\pm 0.6 0.0442±0.0056plus-or-minus0.04420.00560.0442\pm 0.0056 0.209±0.018plus-or-minus0.2090.0180.209\pm 0.018
15 4.0±0.4plus-or-minus4.00.44.0\pm 0.4 0.0480±0.0060plus-or-minus0.04800.00600.0480\pm 0.0060 0.228±0.019plus-or-minus0.2280.0190.228\pm 0.019
avg 0.0410±0.0030plus-or-minus0.04100.00300.0410\pm 0.0030 0.200±0.010plus-or-minus0.2000.0100.200\pm 0.010
3C114 N 2.5 210±370plus-or-minus210370210\pm 370 0.0463±0.0406plus-or-minus0.04630.04060.0463\pm 0.0406 0.132±0.116plus-or-minus0.1320.1160.132\pm 0.116
5 210±368plus-or-minus210368210\pm 368 0.0926±0.0812plus-or-minus0.09260.08120.0926\pm 0.0812 0.264±0.231plus-or-minus0.2640.2310.264\pm 0.231
7.5 35±22plus-or-minus352235\pm 22 0.0570±0.0178plus-or-minus0.05700.01780.0570\pm 0.0178 0.162±0.051plus-or-minus0.1620.0510.162\pm 0.051
10 7.6±1.4plus-or-minus7.61.47.6\pm 1.4 0.0353±0.0039plus-or-minus0.03530.00390.0353\pm 0.0039 0.100±0.011plus-or-minus0.1000.0110.100\pm 0.011
12.5 5.4±0.9plus-or-minus5.40.95.4\pm 0.9 0.0370±0.0036plus-or-minus0.03700.00360.0370\pm 0.0036 0.105±0.010plus-or-minus0.1050.0100.105\pm 0.010
15 2.5±0.3plus-or-minus2.50.32.5\pm 0.3 0.0304±0.0027plus-or-minus0.03040.00270.0304\pm 0.0027 0.087±0.007plus-or-minus0.0870.0070.087\pm 0.007
17.5 2.7±0.5plus-or-minus2.70.52.7\pm 0.5 0.0370±0.0038plus-or-minus0.03700.00380.0370\pm 0.0038 0.105±0.011plus-or-minus0.1050.0110.105\pm 0.011
20 3.8±0.4plus-or-minus3.80.43.8\pm 0.4 0.0498±0.0037plus-or-minus0.04980.00370.0498\pm 0.0037 0.142±0.010plus-or-minus0.1420.0100.142\pm 0.010
avg 0.0370±0.0010plus-or-minus0.03700.00100.0370\pm 0.0010 0.100±0.004plus-or-minus0.1000.0040.100\pm 0.004
3C114 S 2.5 86±110plus-or-minus8611086\pm 110 0.0296±0.0190plus-or-minus0.02960.01900.0296\pm 0.0190 0.083±0.053plus-or-minus0.0830.0530.083\pm 0.053
5 24±12plus-or-minus241224\pm 12 0.0315±0.0081plus-or-minus0.03150.00810.0315\pm 0.0081 0.088±0.023plus-or-minus0.0880.0230.088\pm 0.023
7.5 14±6plus-or-minus14614\pm 6 0.0364±0.0072plus-or-minus0.03640.00720.0364\pm 0.0072 0.102±0.020plus-or-minus0.1020.0200.102\pm 0.020
10 11±3plus-or-minus11311\pm 3 0.0423±0.0061plus-or-minus0.04230.00610.0423\pm 0.0061 0.118±0.017plus-or-minus0.1180.0170.118\pm 0.017
12.5 21±10plus-or-minus211021\pm 10 0.0740±0.0179plus-or-minus0.07400.01790.0740\pm 0.0179 0.207±0.050plus-or-minus0.2070.0500.207\pm 0.050
15 6.6±1.5plus-or-minus6.61.56.6\pm 1.5 0.0493±0.0056plus-or-minus0.04930.00560.0493\pm 0.0056 0.138±0.016plus-or-minus0.1380.0160.138\pm 0.016
17.5 6.2±1.1plus-or-minus6.21.16.2\pm 1.1 0.0557±0.0050plus-or-minus0.05570.00500.0557\pm 0.0050 0.156±0.014plus-or-minus0.1560.0140.156\pm 0.014
20 6.9±1.3plus-or-minus6.91.36.9\pm 1.3 0.0672±0.0064plus-or-minus0.06720.00640.0672\pm 0.0064 0.188±0.018plus-or-minus0.1880.0180.188\pm 0.018
22.5 4.9±0.6plus-or-minus4.90.64.9\pm 0.6 0.0634±0.0040plus-or-minus0.06340.00400.0634\pm 0.0040 0.178±0.011plus-or-minus0.1780.0110.178\pm 0.011
avg 0.0530±0.0020plus-or-minus0.05300.00200.0530\pm 0.0020 0.150±0.006plus-or-minus0.1500.0060.150\pm 0.006
3C142.1 N 2.5 380±900plus-or-minus380900380\pm 900 0.0306±0.0360plus-or-minus0.03060.03600.0306\pm 0.0360 0.185±0.216plus-or-minus0.1850.2160.185\pm 0.216
5 140±190plus-or-minus140190140\pm 190 0.0368±0.0263plus-or-minus0.03680.02630.0368\pm 0.0263 0.222±0.156plus-or-minus0.2220.1560.222\pm 0.156
7.5 96±96plus-or-minus969696\pm 96 0.0460±0.0239plus-or-minus0.04600.02390.0460\pm 0.0239 0.278±0.139plus-or-minus0.2780.1390.278\pm 0.139
10 18±7plus-or-minus18718\pm 7 0.0267±0.0062plus-or-minus0.02670.00620.0267\pm 0.0062 0.162±0.030plus-or-minus0.1620.0300.162\pm 0.030
12.5 6.5±1.1plus-or-minus6.51.16.5\pm 1.1 0.0200±0.0034plus-or-minus0.02000.00340.0200\pm 0.0034 0.121±0.011plus-or-minus0.1210.0110.121\pm 0.011
avg 0.0220±0.0030plus-or-minus0.02200.00300.0220\pm 0.0030 0.130±0.010plus-or-minus0.1300.0100.130\pm 0.010
3C142.1 S 2.5 14000±330000plus-or-minus1400033000014000\pm 330000 0.1279±1.5354plus-or-minus0.12791.53540.1279\pm 1.5354 0.568±6.814plus-or-minus0.5686.8140.568\pm 6.814
5 14000±330000plus-or-minus1400033000014000\pm 330000 0.2559±3.0707plus-or-minus0.25593.07070.2559\pm 3.0707 1.136±13.628plus-or-minus1.13613.6281.136\pm 13.628
7.5 61±57plus-or-minus615761\pm 57 0.0256±0.0121plus-or-minus0.02560.01210.0256\pm 0.0121 0.114±0.053plus-or-minus0.1140.0530.114\pm 0.053
10 38±24plus-or-minus382438\pm 24 0.0269±0.0088plus-or-minus0.02690.00880.0269\pm 0.0088 0.120±0.038plus-or-minus0.1200.0380.120\pm 0.038
12.5 29±16plus-or-minus291629\pm 16 0.0291±0.0083plus-or-minus0.02910.00830.0291\pm 0.0083 0.129±0.036plus-or-minus0.1290.0360.129\pm 0.036
15 35±21plus-or-minus352135\pm 21 0.0384±0.0120plus-or-minus0.03840.01200.0384\pm 0.0120 0.170±0.051plus-or-minus0.1700.0510.170\pm 0.051
17.5 22±11plus-or-minus221122\pm 11 0.0358±0.0091plus-or-minus0.03580.00910.0358\pm 0.0091 0.159±0.039plus-or-minus0.1590.0390.159\pm 0.039
20 38±24plus-or-minus382438\pm 24 0.0539±0.0176plus-or-minus0.05390.01760.0539\pm 0.0176 0.239±0.076plus-or-minus0.2390.0760.239\pm 0.076
22.5 18±8plus-or-minus18818\pm 8 0.0411±0.0095plus-or-minus0.04110.00950.0411\pm 0.0095 0.183±0.040plus-or-minus0.1830.0400.183\pm 0.040
25 26±14plus-or-minus261426\pm 14 0.0556±0.0153plus-or-minus0.05560.01530.0556\pm 0.0153 0.247±0.065plus-or-minus0.2470.0650.247\pm 0.065
27.5 35±21plus-or-minus352135\pm 21 0.0704±0.0220plus-or-minus0.07040.02200.0704\pm 0.0220 0.312±0.094plus-or-minus0.3120.0940.312\pm 0.094
30 17±7plus-or-minus17717\pm 7 0.0539±0.0122plus-or-minus0.05390.01220.0539\pm 0.0122 0.239±0.051plus-or-minus0.2390.0510.239\pm 0.051
avg 0.0370±0.0030plus-or-minus0.03700.00300.0370\pm 0.0030 0.170±0.010plus-or-minus0.1700.0100.170\pm 0.010
3C169.1 N 2.5 540±1900plus-or-minus5401900540\pm 1900 0.0460±0.0827plus-or-minus0.04600.08270.0460\pm 0.0827 0.108±0.194plus-or-minus0.1080.1940.108\pm 0.194
5 240±570plus-or-minus240570240\pm 570 0.0613±0.0735plus-or-minus0.06130.07350.0613\pm 0.0735 0.144±0.173plus-or-minus0.1440.1730.144\pm 0.173
7.5 34±22plus-or-minus342234\pm 22 0.0345±0.0113plus-or-minus0.03450.01130.0345\pm 0.0113 0.081±0.026plus-or-minus0.0810.0260.081\pm 0.026
10 26±15plus-or-minus261526\pm 15 0.0409±0.0119plus-or-minus0.04090.01190.0409\pm 0.0119 0.096±0.028plus-or-minus0.0960.0280.096\pm 0.028
12.5 4.9±0.8plus-or-minus4.90.84.9\pm 0.8 0.0219±0.0020plus-or-minus0.02190.00200.0219\pm 0.0020 0.051±0.005plus-or-minus0.0510.0050.051\pm 0.005
avg 0.0023±0.0020plus-or-minus0.00230.00200.0023\pm 0.0020 0.053±0.004plus-or-minus0.0530.0040.053\pm 0.004
3C169.1 S 2.5 13000±300000plus-or-minus1300030000013000\pm 300000 0.2368±2.6043plus-or-minus0.23682.60430.2368\pm 2.6043 0.766±8.424plus-or-minus0.7668.4240.766\pm 8.424
5 130±200plus-or-minus130200130\pm 200 0.0474±0.0380plus-or-minus0.04740.03800.0474\pm 0.0380 0.153±0.123plus-or-minus0.1530.1230.153\pm 0.123
7.5 49±48plus-or-minus494849\pm 48 0.0431±0.0210plus-or-minus0.04310.02100.0431\pm 0.0210 0.139±0.068plus-or-minus0.1390.0680.139\pm 0.068
10 52±52plus-or-minus525252\pm 52 0.0592±0.0298plus-or-minus0.05920.02980.0592\pm 0.0298 0.191±0.096plus-or-minus0.1910.0960.191\pm 0.096
12.5 30±20plus-or-minus302030\pm 20 0.0564±0.0190plus-or-minus0.05640.01900.0564\pm 0.0190 0.182±0.061plus-or-minus0.1820.0610.182\pm 0.061
15 14±6plus-or-minus14614\pm 6 0.0466±0.0095plus-or-minus0.04660.00950.0466\pm 0.0095 0.151±0.030plus-or-minus0.1510.0300.151\pm 0.030
17.5 15±6plus-or-minus15615\pm 6 0.0552±0.0115plus-or-minus0.05520.01150.0552\pm 0.0115 0.179±0.037plus-or-minus0.1790.0370.179\pm 0.037
20 11±3plus-or-minus11311\pm 3 0.0541±0.0083plus-or-minus0.05410.00830.0541\pm 0.0083 0.175±0.026plus-or-minus0.1750.0260.175\pm 0.026
22.5 5.0±0.8plus-or-minus5.00.85.0\pm 0.8 0.0410±0.0039plus-or-minus0.04100.00390.0410\pm 0.0039 0.133±0.012plus-or-minus0.1330.0120.133\pm 0.012
25 4.4±1.6plus-or-minus4.41.64.4\pm 1.6 0.0431±0.0082plus-or-minus0.04310.00820.0431\pm 0.0082 0.139±0.026plus-or-minus0.1390.0260.139\pm 0.026
avg 0.0450±0.0030plus-or-minus0.04500.00300.0450\pm 0.0030 0.140±0.010plus-or-minus0.1400.0100.140\pm 0.010
3C172 N 2.5 60±48plus-or-minus604860\pm 48 0.0121±0.0050plus-or-minus0.01210.00500.0121\pm 0.0050 0.050±0.020plus-or-minus0.0500.0200.050\pm 0.020
5 52±46plus-or-minus524652\pm 46 0.0227±0.0101plus-or-minus0.02270.01010.0227\pm 0.0101 0.093±0.041plus-or-minus0.0930.0410.093\pm 0.041
7.5 13±4plus-or-minus13413\pm 4 0.0167±0.0030plus-or-minus0.01670.00300.0167\pm 0.0030 0.069±0.011plus-or-minus0.0690.0110.069\pm 0.011
10 130±240plus-or-minus130240130\pm 240 0.0725±0.0656plus-or-minus0.07250.06560.0725\pm 0.0656 0.297±0.268plus-or-minus0.2970.2680.297\pm 0.268
12.5 18±7plus-or-minus18718\pm 7 0.0336±0.0069plus-or-minus0.03360.00690.0336\pm 0.0069 0.138±0.026plus-or-minus0.1380.0260.138\pm 0.026
15 39±30plus-or-minus393039\pm 30 0.0588±0.0228plus-or-minus0.05880.02280.0588\pm 0.0228 0.241±0.092plus-or-minus0.2410.0920.241\pm 0.092
17.5 39±30plus-or-minus393039\pm 30 0.0686±0.0266plus-or-minus0.06860.02660.0686\pm 0.0266 0.281±0.107plus-or-minus0.2810.1070.281\pm 0.107
20 60±48plus-or-minus604860\pm 48 0.0967±0.0396plus-or-minus0.09670.03960.0967\pm 0.0396 0.396±0.160plus-or-minus0.3960.1600.396\pm 0.160
22.5 32±25plus-or-minus322532\pm 25 0.0796±0.0318plus-or-minus0.07960.03180.0796\pm 0.0318 0.326±0.128plus-or-minus0.3260.1280.326\pm 0.128
25 79±86plus-or-minus798679\pm 86 0.1394±0.0761plus-or-minus0.13940.07610.1394\pm 0.0761 0.572±0.309plus-or-minus0.5720.3090.572\pm 0.309
27.5 32±22plus-or-minus322232\pm 22 0.0973±0.0343plus-or-minus0.09730.03430.0973\pm 0.0343 0.399±0.138plus-or-minus0.3990.1380.399\pm 0.138
30 12±34plus-or-minus123412\pm 34 0.0659±0.0107plus-or-minus0.06590.01070.0659\pm 0.0107 0.270±0.039plus-or-minus0.2700.0390.270\pm 0.039
32.5 5.4±1.1plus-or-minus5.41.15.4\pm 1.1 0.0471±0.0063plus-or-minus0.04710.00630.0471\pm 0.0063 0.193±0.022plus-or-minus0.1930.0220.193\pm 0.022
avg 0.0250±0.0020plus-or-minus0.02500.00200.0250\pm 0.0020 0.100±0.008plus-or-minus0.1000.0080.100\pm 0.008
3C172 S 2.5 440±1500plus-or-minus4401500440\pm 1500 0.0312±0.0539plus-or-minus0.03120.05390.0312\pm 0.0539 0.112±0.193plus-or-minus0.1120.1930.112\pm 0.193
5 13000±270000plus-or-minus1300027000013000\pm 270000 0.3431±3.4312plus-or-minus0.34313.43120.3431\pm 3.4312 1.227±12.273plus-or-minus1.22712.2731.227\pm 12.273
7.5 13000±270000plus-or-minus1300027000013000\pm 270000 0.5147±5.1469plus-or-minus0.51475.14690.5147\pm 5.1469 1.841±18.410plus-or-minus1.84118.4101.841\pm 18.410
10 13000±270000plus-or-minus1300027000013000\pm 270000 0.6862±6.8625plus-or-minus0.68626.86250.6862\pm 6.8625 2.455±24.547plus-or-minus2.45524.5472.455\pm 24.547
12.5 110±180plus-or-minus110180110\pm 180 0.0780±0.0640plus-or-minus0.07800.06400.0780\pm 0.0640 0.279±0.229plus-or-minus0.2790.2290.279\pm 0.229
15 13000±270000plus-or-minus1300027000013000\pm 270000 1.0294±10.2937plus-or-minus1.029410.29371.0294\pm 10.2937 3.682±36.820plus-or-minus3.68236.8203.682\pm 36.820
17.5 210±520plus-or-minus210520210\pm 520 0.1501±0.1879plus-or-minus0.15010.18790.1501\pm 0.1879 0.537±0.672plus-or-minus0.5370.6720.537\pm 0.672
20 13000±270000plus-or-minus1300027000013000\pm 270000 1.3725±13.7250plus-or-minus1.372513.72501.3725\pm 13.7250 4.909±49.093plus-or-minus4.90949.0934.909\pm 49.093
22.5 110±180plus-or-minus110180110\pm 180 0.1404±0.1152plus-or-minus0.14040.11520.1404\pm 0.1152 0.502±0.412plus-or-minus0.5020.4120.502\pm 0.412
25 210±520plus-or-minus210520210\pm 520 0.2145±0.2685plus-or-minus0.21450.26850.2145\pm 0.2685 0.767±0.960plus-or-minus0.7670.9600.767\pm 0.960
27.5 15±5plus-or-minus15515\pm 5 0.0629±0.0113plus-or-minus0.06290.01130.0629\pm 0.0113 0.225±0.040plus-or-minus0.2250.0400.225\pm 0.040
32.5 13±9plus-or-minus13913\pm 9 0.0708±0.0230plus-or-minus0.07080.02300.0708\pm 0.0230 0.253±0.082plus-or-minus0.2530.0820.253\pm 0.082
avg 0.0650±0.0100plus-or-minus0.06500.01000.0650\pm 0.0100 0.230±0.030plus-or-minus0.2300.0300.230\pm 0.030
3C441 N 2.5 26±18plus-or-minus261826\pm 18 0.0128±0.0043plus-or-minus0.01280.00430.0128\pm 0.0043 0.041±0.014plus-or-minus0.0410.0140.041\pm 0.014
5 11±3plus-or-minus11311\pm 3 0.0165±0.0024plus-or-minus0.01650.00240.0165\pm 0.0024 0.052±0.007plus-or-minus0.0520.0070.052\pm 0.007
avg 0.0156±0.0020plus-or-minus0.01560.00200.0156\pm 0.0020 0.050±0.007plus-or-minus0.0500.0070.050\pm 0.007
3C441 S 2.5 1500±9900plus-or-minus150099001500\pm 9900 0.1076±0.3589plus-or-minus0.10760.35890.1076\pm 0.3589 0.464±1.546plus-or-minus0.4641.5460.464\pm 1.546
5 86±100plus-or-minus8610086\pm 100 0.0517±0.0314plus-or-minus0.05170.03140.0517\pm 0.0314 0.223±0.134plus-or-minus0.2230.1340.223\pm 0.134
7.5 150±190plus-or-minus150190150\pm 190 0.1020±0.0652plus-or-minus0.10200.06520.1020\pm 0.0652 0.439±0.279plus-or-minus0.4390.2790.439\pm 0.279
10 34±23plus-or-minus342334\pm 23 0.0646±0.0235plus-or-minus0.06460.02350.0646\pm 0.0235 0.278±0.099plus-or-minus0.2780.0990.278\pm 0.099
12.5 150±190plus-or-minus150190150\pm 190 0.1699±0.1086plus-or-minus0.16990.10860.1699\pm 0.1086 0.732±0.465plus-or-minus0.7320.4650.732\pm 0.465
15 34±24plus-or-minus342434\pm 24 0.0969±0.0352plus-or-minus0.09690.03520.0969\pm 0.0352 0.417±0.148plus-or-minus0.4170.1480.417\pm 0.148
17.5 10±3plus-or-minus10310\pm 3 0.0628±0.0100plus-or-minus0.06280.01000.0628\pm 0.0100 0.271±0.038plus-or-minus0.2710.0380.271\pm 0.038
20 16±5plus-or-minus16516\pm 5 0.0891±0.0177plus-or-minus0.08910.01770.0891\pm 0.0177 0.384±0.070plus-or-minus0.3840.0700.384\pm 0.070
avg 0.0699±0.0080plus-or-minus0.06990.00800.0699\pm 0.0080 0.300±0.030plus-or-minus0.3000.0300.300\pm 0.030
3C469.1 N 2.5 150±160plus-or-minus150160150\pm 160 0.1145±0.0617plus-or-minus0.11450.06170.1145\pm 0.0617 0.456±0.245plus-or-minus0.4560.2450.456\pm 0.245
5 840±3800plus-or-minus8403800840\pm 3800 0.5444±1.2266plus-or-minus0.54441.22660.5444\pm 1.2266 2.173±4.896plus-or-minus2.1734.8962.173\pm 4.896
7.5 9.1±1.9plus-or-minus9.11.99.1\pm 1.9 0.0848±0.0132plus-or-minus0.08480.01320.0848\pm 0.0132 0.339±0.051plus-or-minus0.3390.0510.339\pm 0.051
10 18±6plus-or-minus18618\pm 6 0.1584±0.0341plus-or-minus0.15840.03410.1584\pm 0.0341 0.632±0.134plus-or-minus0.6320.1340.632\pm 0.134
avg 0.0950±0.0120plus-or-minus0.09500.01200.0950\pm 0.0120 0.380±0.050plus-or-minus0.3800.0500.380\pm 0.050
3C469.1 S 2.5 130±200plus-or-minus130200130\pm 200 0.1050±0.0793plus-or-minus0.10500.07930.1050\pm 0.0793 0.383±0.288plus-or-minus0.3830.2880.383\pm 0.288
5 130±210plus-or-minus130210130\pm 210 0.2100±0.1689plus-or-minus0.21000.16890.2100\pm 0.1689 0.766±0.615plus-or-minus0.7660.6150.766\pm 0.615
7.5 13±2plus-or-minus13213\pm 2 0.0985±0.0123plus-or-minus0.09850.01230.0985\pm 0.0123 0.359±0.042plus-or-minus0.3590.0420.359\pm 0.042
10 9.3±2.0plus-or-minus9.32.09.3\pm 2.0 0.1106±0.0148plus-or-minus0.11060.01480.1106\pm 0.0148 0.403±0.051plus-or-minus0.4030.0510.403\pm 0.051
12.5 9.3±2.0plus-or-minus9.32.09.3\pm 2.0 0.1382±0.0185plus-or-minus0.13820.01850.1382\pm 0.0185 0.504±0.063plus-or-minus0.5040.0630.504\pm 0.063
15 11±3plus-or-minus11311\pm 3 0.1800±0.0297plus-or-minus0.18000.02970.1800\pm 0.0297 0.656±0.104plus-or-minus0.6560.1040.656\pm 0.104
17.5 8.4±1.7plus-or-minus8.41.78.4\pm 1.7 0.1838±0.0239plus-or-minus0.18380.02390.1838\pm 0.0239 0.670±0.081plus-or-minus0.6700.0810.670\pm 0.081
avg 0.1200±0.0080plus-or-minus0.12000.00800.1200\pm 0.0080 0.450±0.030plus-or-minus0.4500.0300.450\pm 0.030

Col 1. Source Name. Col 2. Side of the source on which the spectral aging was determined. Col 3. The distance from the hotspot. The estimated error is 0.5 arcsec. Col 4. The estimated break frequency. Col 5. The estimated hot spot advance speed assuming the magnetic field is equal to 0.25 the averaged equipartition value given in Table 2. Col 6. The estimated hot spot advance speed assuming the magnetic field is equal to the averaged equipartition value given in Table 2. The last row for each side gives the weighted mean velocity.

Refer to caption
Figure 44: v/c as a function of core to hot spot distance for b=1. For the new sample of eleven radio galaxies we use the weighted average velocities from Table LABEL:tabposn. The slope is 4.0±1.0×10⁴plus-or-minus4.01.0superscript1044.0\pm 1.0\times 10^{-4} with χ2=929superscript𝜒2929\chi^{2}=929 consistent with the results obtained using method A (Table 6).
Refer to caption
Figure 45: v/c as a function of core to hot spot distance for b=0.25. For the new sample of eleven radio galaxies we use the weighted average velocities from Table LABEL:tabposn. The slope is 1.3±0.2×10⁴plus-or-minus1.30.2superscript1041.3\pm 0.2\times 10^{-4} with χ2=972superscript𝜒2972\chi^{2}=972 consistent with the results obtained using method A (Table 5).
Refer to caption
Figure 46: v/c as a function of redshift for b=1. For the new sample of eleven radio galaxies we use the weighted average velocities from Table LABEL:tabposn. The slope is 0.11±0.03plus-or-minus0.110.030.11\pm 0.03 with χ2=957superscript𝜒2957\chi^{2}=957 consistent with the results obtained using method A (Table 6).
Refer to caption
Figure 47: v/c as a function of redshift for b=0.25. For the new sample of eleven radio galaxies we use the weighted average velocities from Table LABEL:tabposn. The slope is 0.022±0.0045plus-or-minus0.0220.00450.022\pm 0.0045 with χ2=1109superscript𝜒21109\chi^{2}=1109 consistent with the results obtained from the two position method (Table 5).