On the distance and reddening of the starburst galaxy IC1011affiliation: Based on observations collected with the ACS and with the WFPC2 on board of the HST.
Abstract
We present deep and accurate optical photometry of the Local Group starburst galaxy IC10. The photometry is based on two sets of images collected with the Advanced Camera for Surveys and with the Wide Field Planetary Camera 2 on board the Hubble Space Telescope. We provide new estimates of the Red Giant Branch tip (TRGB) magnitude, =, and of the reddening, E(B-V)=, using field stars in the Small Magellanic Cloud (SMC) as a reference. Adopting the SMC and two globulars, Cen and 47 Tuc, as references we estimate the distance modulus to IC10: independent calibrations give weighted average distances of (TRGB) and (RR Lyrae). We also provide a new theoretical calibration for the TRGB luminosity, and using these predictions we find a very similar distance to IC10 ( ). These results suggest that IC10 is a likely member of the M31 subgroup.
1 Introduction
The dwarf galaxy IC10 is a very interesting stellar system in the Local Group. It has been classified as an Ir IV by van den Bergh (1999), but it has also been suggested that it is the only analog of a post-starburst dwarf galaxy in the Local Group (Gil de Paz et al. 2003). This means that IC10 is a very good laboratory to investigate episodic star formation over a broad time interval (Hunter 2001; Demers et al. 2004). Moreover, spectroscopic estimates based on HII regions indicate that the present-day interstellar medium metal abundance is , (Garnett et al. 1990). We cannot exclude the possibility of a range of metallicity in IC10, but comparison with stellar isochrones (Hunter 2001) also indicates a mean metallicity of . This metal content is very similar to that of the Small Magellanic Cloud (SMC; , Zaritsky et al. 1994, based on HII regions; , Romaniello et al. 2008, based on classical Cepheids).
However, IC10 is located at very low Galactic latitude (l=119∘0, b=-3∘3), and is therefore affected by significant foreground extinction. This circumstance has made estimates of both reddening and distance quite difficult and controversial. Distance determinations based on different standard candles cover a wide range, from closer than M31— Mpc based on the Red Giant Branch tip (TRGB, Sakai et al. 1999)—to well outside the Local Group, Mpc based on the luminosity function (LF) of planetary nebulae (Jacoby & Lesser 1981). A similar disparity is found among the reddening determinations, with estimates ranging from based on spectra of HII regions (Richer et al. 2001), to based on classical Cepheids (Sakai et al. 1999). Moreover, a spread in distance and reddening values can be found even when using the same distance indicator and stellar tracer (see Table 1, in Demers et al. 2004). Therefore, we still lack firm constraints on the random and systematic errors affecting these important parameters.
2 Observations and data reduction
Our photometric catalog is based on archival Hubble Space Telescope (HST) data sets collected with both the Advanced Camera for Surveys (ACS, pointings and ) and with the Wide Field Planetary Camera 2 (WFPC2, pointing )111The pointing coordinates (J2000) are: RA=00 20 19, DEC=59 18 24 (, GO–9683, PI: F.E. Bauer); RA=00 20 14, DEC=59 20 23 (, GO–10242, PI: A.A. Cole); RA=00 20 28, DEC=59 18 00 (, GO–6406, PI: D.A. Hunter).. Pointing is located at the galaxy center and consists of six and six -band images of 360 sec each. Pointing is located NW from the galaxy center and includes 32 -band images of 620 sec each and 16 -band images of 595 sec each. Pointing is again located at the galaxy center and includes ten and ten -band images of 1400 sec each. Pointings and (ACS) overlap by about one chip, while pointing (WFPC2) almost entirely overlaps with pointing . We combined the ACS images using an updated version of the MultiDrizzle package (Koekemoer et al. 2002), which provides an automated method for correcting distortion and combining dithered images. The WFPC2 images were prereduced using the HST pipeline. Initial photometry on individual images was performed with DAOPHOT IV, followed by simultaneous photometry over the 80 images with ALLFRAME (Stetson, 1994). We ended up with a catalog including stars with at least one measurement in each of two different bands. The ACS data in the and bands were transformed into the VEGAMAG system following Sirianni et al. (2005). To provide a homogeneous photometric catalog the -band images collected with the ACS were transformed into the -band using local standards. The same approach was adopted to transform the and the images collected with WFPC2 to the corresponding ACS systems. On average the precision of the above transformations is -(ACS)= -0.006 0.049, (ACS)-(WFPC2)= 0.009 0.054, (ACS)-(WFPC2)= 0.003 0.050 mag (Sanna et al. 2008, in preparation). To overcome possible changes in the internal reddening when moving from the center toward the external regions of the galaxy we split the final catalog into two different regions. Region C is located at the galaxy center, while the field lying at a radial distance larger than two arcminutes is our region E. Data plotted in Fig. 1 show that the current photometry ranges from very bright main sequence stars (, -) to faint RG stars (, -) with very good precision.
3 Results and discussion
To estimate the TRGB in IC10 we adopted the approach used in Bono et al. (2008, hereinafter B08). In particular, we selected stars with and . Note that the stellar samples in the central and external regions include, respectively, and stars within one -band magnitude of the tip. This is more than an order of magnitude larger than the number required for a robust detection of the TRGB (Madore & Freedman 1995). The top panels of Fig. 2 show a well defined jump in the star counts for , which we take to mark the position of the TRGB. This identification is supported by the smoothed LF obtained with a Gaussian kernel having a standard deviation equal to the photometric error (Sakai et al. 1996; middle panels). Finally, the bottom panels show the response of the edge detector, a four-point Sobel filter convolved with the smoothed LF. The dashed vertical lines mark our detection of the TRGB at = for the central field (left) and = for the external field (right). The error in these TRGB estimates is given by the bin size adopted in the LF (Fig. 2, top panels).
We adopted empirical calibrators to determine the reddening and the distance to IC10. This approach is minimally affected by uncertainties in the transformation of theoretical predictions into the observational plane. Moreover, it provides robust estimates of relative distances and reddenings. The main drawback is that the empirical calibrators require similar mean metallicities (or at least trustworthy metallicity corrections). To estimate the reddening we used the accurate photometry of the region located around the SMC cluster NGC 346 recently provided by Sabbi et al. (2007). This data set offers several advantages: i) the data were collected with ACS in the same , -bands; ii) the stellar populations in this region span a very broad age range, namely from the few Myrs of NGC 346 to the several Gyrs ( Gyr) of the intermediate-age cluster BS90; iii) the region is characterized by modest reddening (E(B-V)=0.08) and is minimally contaminated by Galactic field stars; iv) the mean metallicity is very similar to the mean metallicity of IC10.
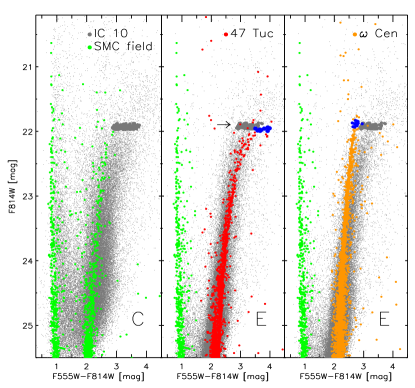
The relative reddening was estimated by moving the young SMC MS until it matched the bluest MS stars in IC10 to account for possible differential reddening. Fortunately enough, the distribution of these stars in the , - CMD is almost vertical and with the RGs they form a “V” shape. Therefore, this approach minimally depends on the adopted distance. We found a relative reddening of F555WF814W= for both the central and the external region of IC10. This indicates that the reddening in the two fields is, within the errors, the same. Using the analytical relation for stellar extinction provided by Cardelli et al. (1989) we found that the selective absorptions in the two ACS filters are: and . If we assume an SMC reddening of E(B-V)=0.08 (Sabbi et al. 2007), this means a mean reddening of E(-)= for IC10, and in turn =0.780.06. The error budget includes generous estimates on the relative reddening (), on the SMC reddening () and on the reddening law (Fitzpatrick 1999). The left panel of Fig. 3 shows the comparison between the SMC (green dots) and IC10 (gray dots) using the above differential reddening and relative distance based on the TRGB (see infra). The new reddening estimate is in very good agreement with the reddening estimates based on spectra of HII regions (E(B-V)=0.77 0.07, Richer et al. 2001), TRGB stars (E(B-V) 0.85, Sakai et al. 1999), carbon stars (E(B-V) 0.79, and a change across the field of 0.38 mag, Demers et al. 2004), and Wolf-Rayet stars (E(B-V)=0.75-0.80, Massey & Armandroff 1995). We do not support a reddening as high as was estimated from classical Cepheid variables.
We also estimated the relative distance between IC10 and the SMC. For the SMC, we adopted the TRGB estimate provided by Cioni et al. (2000), i.e., . With the reddening quoted above for SMC (E(B-V)=0.08), the color-metallicity relation for TRGB stars provided by Bellazzini et al. (2001), and the transformations from the Cousins -band to the ACS VEGAMAG system by Sirianni et al. (2005), we found . Using the above reddening, we found that and the error budget includes the same sources of uncertainty as before, plus an additional uncertainty of mag in the photometric calibration. Therefore, the relative distance is . The arrow plotted in the middle panel of Fig. 3 shows that the magnitudes of TRGB stars in SMC and in IC10 agree within the uncertainties.
To further constrain the relative distance to IC10, we also compared it to the Galactic Globular Cluster (GGC) 47 Tuc. The reason is threefold: i) accurate spectroscopic measurements indicate that its iron abundance is very similar to IC10, i.e., [Fe/H]= (Gratton et al. 2003); ii) it is minimally affected by reddening: (E(B-V)=, Salaris et al. 2007); iii) an accurate estimate of the TRGB has been recently provided by B08. By transforming the Cousins -band into the ACS VEGAMAG system (Sirianni et al. 2005), we found that the TRGB in 47Tuc is located at . The error budget accounts for uncertainties in the reddening, in the TRGB detection and in the photometric transformation. Therefore, the relative distance is . A glance at the data plotted in the middle panel of Fig. 3 shows very good agreement between the magnitudes of TRGB stars in 47Tuc and IC10. Moreover, the RGs in 47Tuc also attain very similar colors to RGs in IC10, thus supporting the reddening (and metallicity) estimate.
We also estimated the relative distance between IC10 and the GGC Cen. Again, the reason is threefold: i) it is the most massive GGC and it hosts a sizable sample of bright RG stars () close to TRGB, so the TRGB detection is particularly robust; ii) accurate distance estimates are available using several different standard candles (Del Principe et al. 2006); iii) an accurate estimate of the TRGB has been recently provided by B08. We found that the TRGB in Cen is located at . The error budget accounts for uncertainties in the reddening (), in the TRGB detection, and in the photometric transformation. Moreover, we also accounted for the difference in metallicity between Cen ([Fe/H], metal-poor peak, Johnson et al. 2008) and IC10, and their uncertainties (B08). The relative distance is then . The right panel of Fig. 3 shows that the magnitudes of TRGB stars in Cen and in IC10 agree quite well. The bright RGs in Cen are, as expected, bluer when compared with RGs in IC10.
To evaluate the true distance to IC10, we used the TRGB calibrations provided by Bellazzini et al. (2004) and Lee et al. (1993). For the SMC, we found a true modulus of = or = ; = is the weighted average. Thus, the true modulus of IC10, based on the TRGB scale of SMC, is = . Using the same TRGB calibrations we found for 47 Tuc a true modulus of = and = (=, weighted average). Thus, the modulus of IC10, based on the TRGB scale of 47 Tuc, is = . Finally, using the same TRGB calibrations the true moduli for Cen are: = and = (=, weighted average). Therefore, the modulus of IC10, based on the TRGB scale of Cen , is = .
On the other hand, if we use the -band Period-Luminosity (PL) relations provided by Del Principe et al. (2006) and Sollima et al. (2008), the true modulus of 47 Tuc based on the variable V9 is and (, weighted average)222We did not estimate the distance to IC10 using the SMC RR Lyrae, since NIR magnitudes for these objects are not available.. Therefore, the modulus of IC10, based on the RR Lyrae scale, is . Using the same -band PL relations, the true modulus of Cen is or (, weighted average). Therefore, the modulus of IC10, based on the RR Lyrae scale to Cen , is . The weighted average true moduli of IC10 agree within 1 and are: (TRGB scale) and (RR Lyrae scale). These estimates agree within 1 with previous distance determinations based on carbon stars (, E(B-V)=0.79, Demers et al. 2004); on optical (, E(B-V)=0.97, Saha et al. 1996) and NIR (, E(B-V)=0.8, Wilson et al. 1996) Cepheid PL relations; and on the TRGB (, E(B-V)=0.95, Vacca et al. 2007). However, we found differences of 0.4–0.5 mag with respect to the moduli estimated from Wolf-Rayet stars (, E(B-V)=0.75–0.80, Massey & Armandroff 1995) and red supergiants (, E(B-V)=, Borissova et al. 2000). This indicates that the quoted distance estimates might be affected by systematic errors.
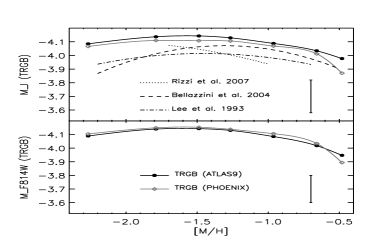
As a final test of the systematic errors that might affect the distance estimates to IC10, we calculated new theoretical TRGB calibrations. We adopted the homogeneous set of cluster isochrones for scaled-solar abundances provided by Pietrinferni et al. (2004); in particular, we adopted isochrones with t=12 Gyrs, mass-loss =0.4, and iron abundances from [M/H] (see the URL http://www.oa-teramo.inaf.it/basti). However, theory was transformed into the observational plane using only scaled-solar atmospheres based on ATLAS9 models (Castelli et al. 2003). We linearly extrapolated the surface gravity by 0.1 dex and the surface temperature by 100 K beyond the available range for the most metal-rich structures. To account for the new electron-conduction opacities the predicted TRGB magnitudes were dimmed by 0.075 mag (Cassisi et al. 2007). Moreover, to account for uncertainties in the color-temperature transformations (Bellazzini 2008) we also adopted scaled-solar atmospheres based on PHOENIX (Brott et al. 2005).
The new ATLAS9 and PHOENIX TRGB calibrations agree well (Fig. 4, bottom panel): over most of the metallicity range differences are much less than 0.1 mag, but they do become perceptibly larger for the most metal-rich structures. The new TRGB calibrations also agree (Fig. 4, top panel), within 1 (see the error bars), with empirical TRGB calibrations (Lee et al. 1993; Bellazzini et al. 2004; Rizzi et al. 2007). Predicted magnitudes are still systematically brighter than observed ones, but the difference is a factor of two smaller than previous TRGB calibrations. The explanation of this mild discrepancy requires new theoretical and empirical investigations. We performed spline fits of the theoretical TRGB luminosities333The predicted TRGB luminosities were estimated for the following metallicities: [M/H]= -2.267, -1.790, -1.488, -1.266, -0.963, -0.659, -0.481. The set of isochrones for [M/H]= -0.481 was specifically computed for this project. The anchor points we adopted for the spline fit are: = -4.085, -4.137, -4.143, -4.129, -4.088, -4.034, -3.977; = -4.066, -4.110, -4.108, -4.106, -4.069, -4.012, -3.870; = -4.089, -4.140, -4.143, -4.130, -4.085, -4.018, -3.947; = -4.104, -4.149, -4.153, -4.138, -4.106, -4.034, -3.894. in both and -band, and from these—by assuming a metal content for IC10 of [M/H]=-0.70—we derived true distance moduli of and , respectively. The error budget includes uncertainties in the theoretical predictions ( mag), the TRGB measurement, and in the metal content ( dex). These estimates are in very good agreement with the above distances based on empirical calibrators, thus further supporting the accuracy of the current theoretical calibrations.
The above distances indicate that IC10 is located, within the errors, at the same distance as M31, which has true moduli based on the TRGB ranging from to (Rizzi et al. 2007), while those based on Cepheids range from (Sakai et al. 2004) to (Vilardell et al. 2007; Tammann et al. 2008). The new distances are also in remarkable agreement with the “rotational parallax” for M33 based on water masers ( vs kpc) by Brunthaler et al. (2005). This indicates that IC10 is at the same distance as M31 and M33, and in turn that it is a likely member of the M31 subgroup.
References
- (1) Bellazzini, M., Ferraro, F. R., Pancino, E. 2001, ApJ, 556, 635
- (2) Bellazzini, M. et al. 2004, A&A, 424, 199
- (3) Bellazzini, M. 2008, MmSAI, 79, 440
- (4) Bono, G. et al. 2008, ApJL, accepted, arXiv0809.0863
- (5) Borissova, J. et al. 2000, A&A, 363, 130
- (6) Brott, I. & Hauschildt, P.H. 2005, ESA Special Publ., 576, 565
- (7) Brunthaler, A. et al. Sci, 307, 1440
- (8) Cardelli, J.A., Clayton, G.C., Mathis, J.S. 1989, ApJ, 345, 245
- (9) Cassisi, S. et al. 2007, ApJ, 661, 1094
- (10) Castelli, F., & Kurucz, R. L. 2003, in IAU Symp. 210, Modelling of Stellar Atmospheres, ed. N.E. Piskunov, W.W. Weiss, D.F. Gray, (San Francisco: ASP), A20
- (11) Cioni, M.-R. L. et al. 2000, A&A, 359, 601
- (12) Del Principe, M., et al. 2006, ApJ, 652, 362 (DP06)
- (13) Demers, S., Battinelli, P., Letarte, B. 2004, A&A, 424, 125
- (14) Fitzpatrick, E. L. 1999, PASP, 111, 63
- (15) Garnett, D. R., 1990, ApJ, 363, 142
- (16) Gil de Paz, A.; Madore, B. F.; Pevunova, O. 2003, ApJS, 147, 29
- (17) Gratton, R. G. et al. 2003, A&A, 408, 529
- (18) Hunter, D. A. 2001, ApJ, 559, 225
- (19) Jacoby, G. H., Lesser, M. P. 1981, AJ, 86, 185
- (20) Johnson, C. I. et al. 2008, ApJ, 681, 1505
- (21) Koekemoer, A. M. et al. 2002, in The 2002 HST Calibration Workshop, ed. S. Arribas, A. Koekemoer, & B. Whitmore (Baltimore: STSCI), 337
- (22) Lee, M. G., Freedman, W. L., Madore, B. F. 1993, ApJ, 417, 553
- (23) Madore, B. F., & Freedman, W. L. 1995, AJ, 109, 1645
- (24) Massey, P., Armandroff, T. E. 1995, AJ, 109, 2470
- (25) Pietrinferni, A. et al. 2004, ApJ, 612, 168
- (26) Richer, M. G. et al. 2001, A&A, 370, 34
- (27) Rizzi, L. et al. 2007, ApJ, 661, 815
- (28) Romaniello, M. et al. 2008, A&A, accepted, arXiv:0807.1196
- (29) Sabbi, E. et al. 2007, AJ, 133, 44
- (30) Saha, A. et al. 1996, AJ, 111, 197
- (31) Sakai, S., Madore, B. F., Freedman, W. L. 1996, ApJ, 461, 713
- (32) Sakai, S., Madore, B. F., Freedman, W. L. 1999, ApJ, 511, 671
- (33) Sakai, S. et al. 2004, ApJ, 608, 42
- (34) Salaris, M. et al. 2007, A&A, 476, 243
- (35) Sirianni, M. et al. 2005, PASP, 117, 1049
- (36) Sollima et al. 2005, MNRAS, 357, 265
- (37) Stetson, P. B. 1994, PASP, 106, 250
- (38) Tammann, G. A. et al. 2008, ApJ, 679, 52
- (39) Vacca, W. D.; Sheehy, C. D., Graham, J. R. 2007, ApJ, 662, 272
- (40) van den Bergh, S. 1999, A&ARv, 9, 273
- (41) Vilardell, F., Jordi, C., Ribas, I. 2007, A&A, 473, 847
- (42) Wilson, C. D., Petitpas, G. 1996, JRASC, 90, 328
- (43) Zaritsky, D., Kennicutt, R. C., Jr., Huchra, J. 1994, ApJ, 420, 87