Redshifted emission lines and radiative recombination continuum from the Wolf-Rayet binary Muscae: evidence for a triplet system?
We present XMM-Newton observations of the WC binary Muscae (WR 48), the second brightest Wolf-Rayet binary in optical wavelengths. The system consists of a short-period (19.1375 days) WC5/WC6 + O6/O7V binary and possibly has an additional O supergiant companion (O9.5/B0Iab) which is optically identified at a separation of mas. Strong emission lines from highly ionized ions of C, O, Ne, Mg, Si, S, Ar, Ca and Fe are detected. The spectra are fitted by a multi-temperature thin-thermal plasma model with an interstellar absorption 2–3 . Lack of nitrogen line indicates that the abundance of carbon is at least an order of magnitude larger than that of nitrogen. A Doppler shift of is detected for the O VIII line, while similar shifts are obtained from the other lines. The reddening strongly suggests that the emission lines originated from the wind-wind shock zone, where the average velocity is . The red-shift motion is inconsistent with a scenario in which the X-rays originate from the wind-wind collision zone in the short-period binary, and would be evidence supporting the widely separated O supergiant as a companion. This may make up the collision zone be lying behind the short-period binary. In addition to the emission lines, we also detected the RRC (radiative recombination continuum) structure from carbon around 0.49 . This implies the existence of additional cooler plasma.
Key Words.:
X-rays: stars – Stars: Wolf-Rayet – binaries: spectroscopic – Stars: winds, outflows – Stars: HD1139041 Introduction
Wolf-Rayet (WR) stars are the evolved descendants of massive O stars, whose optical spectra are characterized by strong helium, carbon, nitrogen and oxygen emission lines. These arise from hot stellar winds with typical terminal velocities of 1000–3000 and mass loss rates of the order of 10-5 M☉ . The visible spectra of WN stars and WC stars are dominated by nitrogen and carbon emission lines, respectively.
Pollock (1987) used the Einstein observatory, which covered the 0.2–4.0 energy band, to discover that several WR+O binary systems tend to be brighter in X-rays than single WR stars. This was confirmed by a ROSAT survey (Pollock 1995). The strong hard X-ray emission from WR binaries can be interpreted to arise from a collision of stellar winds from the WR star and that of the O star (e.g., Koyama et al. 1990). Recently, Schild et al. (2004) discovered the RRC (radiative recombination continuum) structure of carbon in the spectrum of the WC+O binary Velorum, which shows the existence of another cooler component.
Muscae (WR 48, HD 113 904) is known to be a complex system. The history of observations and interpretations are summarized in Hill et al. (2002). Based on its spectrum, this system is known to be a binary or a line-of-sight double, and is the second brightest WR binary in optical wavelengths (Moffat & Seggeniss 1977). Moffat & Seggeniss (1977) showed that the WR star emission lines exhibited radial velocity variations with a period of 18.341 d but the absorption lines from the late O supergiant (O9.5/B0Iab; van der Hucht 2001) seemed to be stationary. This leads to two possible interpretations; one is an extremely large mass ratio, and the other is the hypothesis that the WR component shares its 18.341-d orbit with a third hidden star, and then the O supergiant star is either in a much wider, slower orbit with the other two or is a line-of-sight coincidence. The linear polarization data obtained by St.-Louis et al. (1987) confirmed that the O supergiant does not participate in the short-period orbit. Hartkopf et al. (1999) resolved the O supergiant to be mas away from the short-period binary using speckle interferometry.
Non-thermal emission is detected in radio wavelengths from this system (Leitherer et al. 1997; Chapman et al. 1999). Dougherty & Williams (2000) discussed, in their study of 23 WR stars, the possibility that the non-thermal emission arises not from a wind-wind collision zone in the short-period binary but from that between the supergiant and the short-period binary. The discussion is based on their obtained correlation between orbital period and radio spectral index in WR binaries. The data point for an orbital period of about 18 days and the spectral index of Mus ( 0.4) is offset from the correlation, while if the orbital period is that estimated for the wide binary (at least 130 yr), the data point lies on the correlation. The correlation would be reasonable if we think that detection of radio non-thermal emission is difficult in short-period systems because the wind-collision zone is deep inside the opaque region of the stellar wind from the WR star.
In X-ray wavelengths, the Einstein observatory detected strong X-ray emission with an observed luminosity of erg s-1 in the 0.2–4.0 keV band (Pollock 1987), and the ROSAT observatory detected emission at erg s-1 in the 0.2–2.4 keV band (Pollock et al. 1995). However, despite the past observations, the origin of the X-ray emission is not well understood. The large effective area and the excellent spectral resolution over a broad band of XMM-Newton allows us to measure the detailed structure of atomic lines. We present here XMM-Newton observations of Muscae.
2 Observations and data reduction
XMM-Newton was launched in 1999 December from French Guyana. The observatory consists of three X-ray telescopes and five X-ray instruments: three European Photon Imaging Cameras (EPIC: PN and two identical MOS CCDs), which have high sensitivity up to 10 , and two identical reflection grating spectrometers (RGS), which have excellent energy resolution in the soft X-ray band (0.33–2.5 ).
Muscae was observed by XMM-Newton between 2004 July 20 11:21:43 UT and 2004 July 21 20:36:35 UT, giving 119 692 s of observation time. For the orbital solution of the WC star, we adopted that obtained in Hill et al. (2002):
| (1) |
where the eccentricity is zero and is the number of orbits since the passage on HJD 245 1377.51. Phase 0.0 is defined as the time when the WR star occults its companion. Our observations cover the orbital phase from 0.596 to 0.668, during which the O star was located in front of the WR star. Each phase has errors 0.024 and 0.012. The former corresponds to the uncertainty of the initial epoch, while the latter to the offset of the orbital period.
All the data were analyzed with the 6.0.0 version of the XMM Science Analysis System. The pipeline processing tasks EMCHAIN, EPCHAIN and RGSPROC were executed using the available calibration files, and data were filtered via EVSELECT to select good event patterns. We use all valid event patterns (PATTERN 0–12) for the MOS cameras but use valid PN events with single and double events (PATTERN 0–4). In the energy band below 1.8 , the emission-line peaks of the EPIC spectrum are not consistent with those of the high resolution RGS spectrum. We adopt the RGS spectrum and ignored the EPIC spectrum in this energy band to avoid the statistical dominance by EPIC data.
3 Results
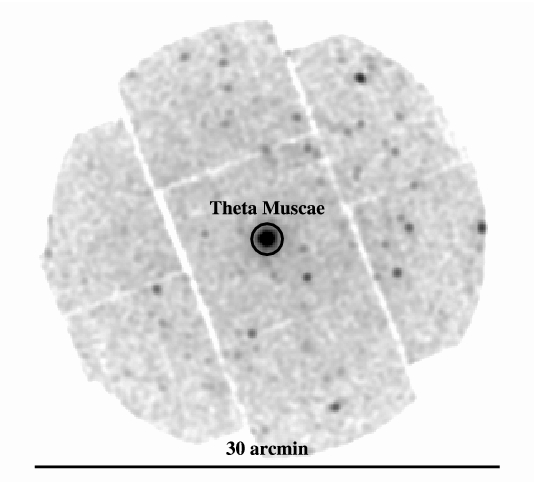
Figure 1 shows the X-ray image taken with MOS 1. Muscae is the dominant X-ray source in the MOS field of view. We derived light curves in the soft band (0.3–2 ) and hard band (2–10 ). The average count rates are 0.13 and counts s-1 respectively. We detected no significant variability.
| Model | wabs * gsmooth * (redge cevmkl) | wabs * gsmooth * (redge 2T vpshock) | |
| Parameter | Best-fit values | Best-fit values | |
| Line of sight absorption (wabs) | |||
| (1021 ) | 2.56 | 2.4 | |
| Doppler broadening (gsmooth) | |||
| 111 is the standard deviation at 6 .The broadening corresponds to a velocity of 1410 in FWHM. () | 11.95 (fixed) | ||
| Index 222This is the power of energy for sigma variation. | 1 (fixed) | ||
| Doppler shift (redshift) | |||
| Redshift ( 10-3) | 2.18 | 2.17 | |
| RRC (redge) | |||
| Threshold energy () | 489.2 | 489.2 | |
| () | 4 | 5 | |
| norm 333Normalization constant of the redge model defined as total photons s-1 in the line.( 10-4) | 1.5 | 1.1 | |
| Thin thermal plasma model | (cevmkl) | (2T vpshock) | |
| – | |||
| () | 9.9 | – | |
| () | – | 0.58 | |
| () | – | 3.6 | |
| Abundance 444The solar abundances are from Anders & Grevesse (1989). For the elements with no emission lines (hydrogen, helium, sodium and aluminum), the solar abundances are kept fixed. The abundance of magnesium and nickel are linked to that of silicon and iron respectively. | |||
| C | 14.8 | 3.5 | |
| N | 0.1 | ||
| O | 1.9 | 0.33 | |
| Ne | 1.8 | 0.47 | |
| Si | 1.0 | 0.31 | |
| S | 2.2 | 0.64 | |
| Ar | 4.5 | 1.1 | |
| Ca | 3.7 | 1.0 | |
| Fe | 0.21 | 0.15 | |
| ( 1011 s cm-3) | – | 4.9 | |
| norm1 555 Normalization constant defined as , where is the emission measure in and is the distance in . In the cevmkl model, emission measure follows a power law in temperature, i.e. the emission measure from electron temperature kT is proportional to . (10-4) | 4.4 | 5.8 | |
| norm2 e ( 10-4) | – | 8.3 | |
| 666The absorption-corrected luminosity (0.3–8.0 keV) was calculated assuming a distance of 2.27 kpc. ( ) | 3.6 1033 | 3.1 1033 | |
| /d.o.f | 762/429 | 605/426 | |
| Ion 777Doppler shifts of the emission lines were measured with a single Gaussian fitting. That of the RRC was picked from the best-fit parameter of the 2T vpshock model in Table 1. | C VI | C VI | O VII | O VIII | Ne IX | Ne X | C RRC |
|---|---|---|---|---|---|---|---|
| 888Theoretical energy of the line center. | 0.3675 | 0.4356 | 0.5739 | 0.6536 | 0.9050 | 1.0218 | 0.4900 |
| 999The center energy of the observed line. | 0.3668 | 0.4344 | 0.5725 | 0.6522 | 0.9022 | 1.0196 | 0.4892 |
| Redshift 101010The redshift defined as . ( 10-3) | 1.9 | 2.8 | 2.5 | 2.1 | 3.1 | 2.2 | 1.6 |
| ( ) | 560 | 830 | 750 | 630 | 930 | 650 | 490 |
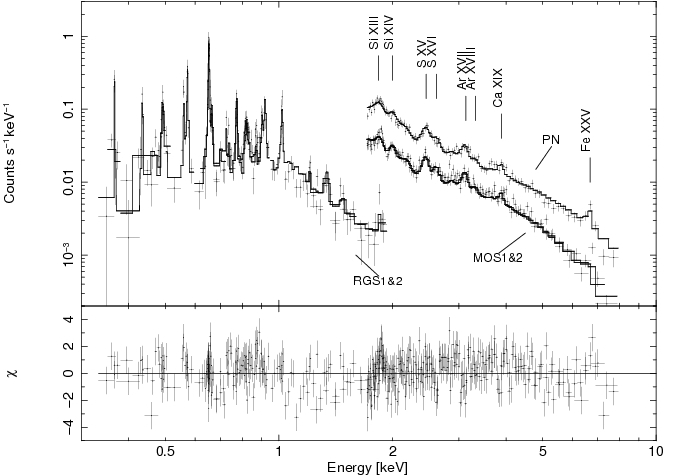
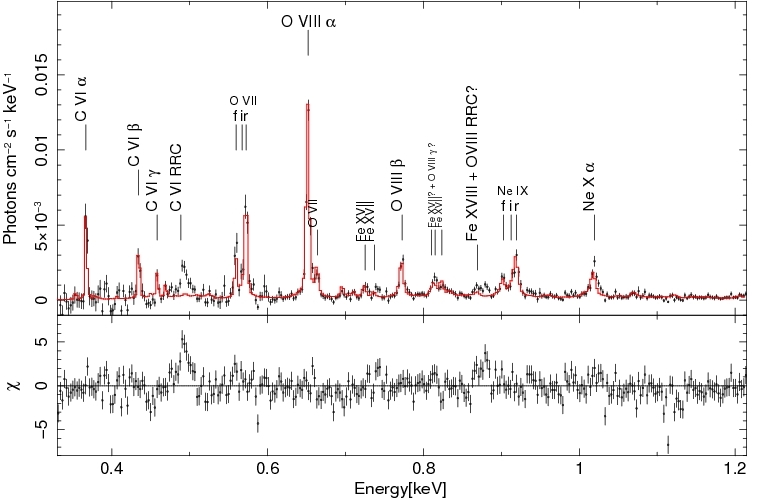
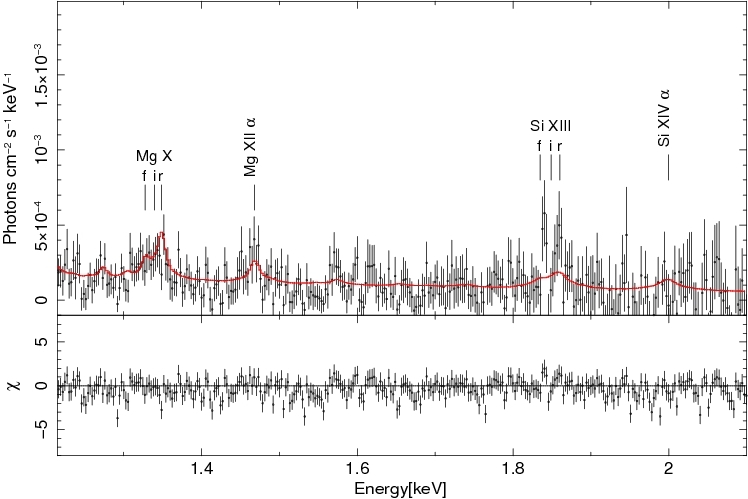
We obtained X-ray spectra from the RGS and EPIC (PN, MOS 1 and 2) data. The broad band spectra are shown in Figure 2 and the enlarged spectrum for the RGS data is shown on a linear scale in Figure 3. Emission lines from helium-like and hydrogen-like ions of various elements (e.g. carbon, oxygen and neon) were detected. Since a single temperature plasma cannot reproduce these emission lines simultaneously, we executed simultaneous fitting of the three datasets (RGS, MOS and PN) with a multi-temperature plasma model with an absorption model (wabs) using XSPEC ver. 12. The multi-temperature model we adopted first is the simple collisional ionization equilibrium (CIE) model (cevmkl), where the emission measures follow a power-law in temperature, i.e, the emission measure from the electron temperature kT is proportional to with an index (Singh et al. 1996). The secondary adopted model is the two temperature plane-parallel shock model (2T vpshock), which does account for non-equilibrium ionization (NEI).
In both fittings, line broadening and shifts were seen. Then we fitted the high-intensity O VIII line around 0.65 keV with a single Gaussian model to investigate the width. The obtained broadening is eV in 1 , which corresponds to a velocity of 1190–1720 in FWHM. With this value, we adopted a Gaussian smoothing (gsmooth) of the multi-temperature models, fixing the ratio eV 0.65 keV and allowing the redshift to be a free parameter.
The above fittings reasonably reproduced the overall spectrum. The solid line in Figure 3 indicates the model for NEI. However, residuals around 0.49 keV were left (see Figure 3) in the RGS band. The excess is identified with the RRC structure of C VI. We then added a recombination edge (redge) model to the above models, and re-fitted the datasets. The results are shown in Table 1. The better fit is obtained with the NEI model. The solid lines in Figure 2 show the best-fit NEI model.
The best-fit NEI model, and also the CIE model, showed that carbon is overabundant by at least an order of magnitude compared to nitrogen in Muscae (see Table 1), indicating that the plasma originates from Wolf-Rayet (WC) stellar winds. The best fit model has an absorption-corrected X-ray luminosity () of erg s-1 (0.3–8.0 keV band) and log of (log ; Nugis & Lammers 2000), which is slightly larger than the known correlation for O+O and WN+O binaries (Berghoefer et al. 1997; Oskinova 2005). The absorption of cm-2 is consistent, within a factor of 1.5, to the interstellar absorption derived from mag and the correlation in Predehl & Schmitt (1995). The red-shift is 2.2 , which corresponds to 650 km s-1. Independently, we further fitted each emission line with a single Gaussian model, and obtained a similar red-shift 2 (see Table 2).
The RRC structure of carbon we detected is the second example among WR massive binaries, with the first case being the spectrum of Velorum (Schild et al. 2004). The fitting of the RRC structure in Muscae needed a plasma temperature of 4.7 (3.3–6.2) eV, which is similar to but about 1.3 times higher than that of Velorum. The cool plasma component which makes up the RRC structures may be common in WR binaries. Interestingly, the best-fit value of the RRC indicated a red-shift of 2.5, which is similar to that obtained in lines, although the error is large.
We further analyzed the emission lines around 0.56 keV and 0.9 keV, which are the helium-like triplets of oxygen and neon, respectively. The intensity ratio of forbidden lines (HE6) to resonance lines (HE4) indicates that the lines originate from a thin-thermal plasma whose density is less than (Porquet et al. 2001), which favors the NEI model.
4 Discussion
The X-ray spectra from the massive binaries WR140 (Pollock et al. 2005), Velorum (Schild et al. 2004), WR25 (Raassen et al. 2003), V444 Cygnus (Maeda et al. 1999) are all strong in hard X-rays with high temperature components of several keV. The hot component of Muscae also strongly suggests that X-rays originate from wind-wind collisions. The absorption-corrected X-ray luminosity of Muscae is 3.1 1033 erg s-1, which is similar to those of the other massive binaries (WR140, 2.0 1034 erg s-1; Velorum, 8.4 1032 erg s-1; WR25, 1.3 1034 erg s-1; V444 Cygnus, 1.4 1033 erg s-1 ).
High dispersion spectra of the massive binaries have been obtained for WR140 (Pollock et al. 2005), Velorum (Henley et al. 2005), and Muscae (this study). Significant Doppler shifts are only reported by Pollock et al. (2005) for WR140 at the pre-periastron phase when one side of the bow-shock zone approaches toward the line of sight. They detected a significant blue shift of 600 . No detection of the Doppler shift at post-periastron was interpreted to result from the bow-shock zone being aligned perpendicular to the line of sight. No detection from Velorum is also attributed to a similar situation or to a wide open angle of the bow-shock zone.
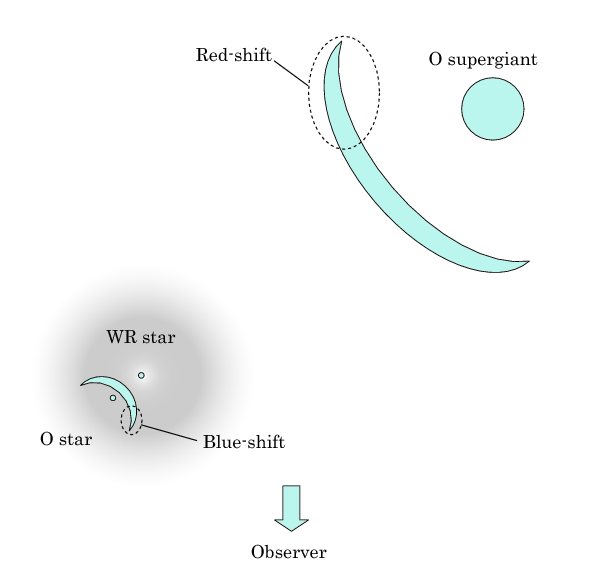
Our detection of the Doppler-shift in the emission lines is the second example among the massive binaries. The red-shift in the emission lines strongly suggests that one side of the bow-shock zone is receding along the line of sight, indicating that the primary WR star is in front. However, this geometry is inconsistent with the orbital solution for the short-period binary in Hill et al. (2002) in which the O star is likely in front. Instead, if the O supergiant separated by 46 mas from the short-period binary is a companion of this system and located behind the primary WR star, as shown in Figure 4, the wind-wind collision zone could be receding.
This idea that the wind-wind collision zone is between the short-period binary and the O supergiant is the same as that of Dougherty & Williams (2000). By assuming that the distance to Muscae is 2.27 kpc, the projection of 46 mas corresponds to 100 AU. It is well known that X-rays from massive binaries suffer absorption from the WR wind if the WR star is in front (e.g., Maeda et al. 1999). An X-ray emitting region widely extended over 100 AU should avoid the absorption in the Muscae system. This interpretation strongly suggests that the astrometric O supergiant is a companion to the system. The wind from the spectroscopic O star companion should be much weaker than that from the optically identified O supergiant.
Another interesting possibility was obtained from the RRC structure. Table 2 shows that the RRC may be red-shifted with a similar velocity to the emission lines. If this is true, the RRC may originate from ions that escape from the bow-shock layer through diffusion or convection processes, and exchange electrons in the following less-ionized winds. Follow-up observations with much deeper exposure are necessary to test this idea since we need to restrict the Doppler shift of the RRC structure more tightly.
5 Summary
The XMM-Newton spectra of Muscae show He- and H-like emission lines from various elements as well as the RRCs from carbon. The results of our study are as follows:
-
A.
The He-like and H-like emission can be reproduced by a multi-temperature plasma model. A better fit was obtained for the NEI case (vpshock) rather than the collisional equilibrium (cevmkl) model. The high temperature component of the NEI model is as high as 3 keV. The high temperature component indicates the existence of plasma heating by a wind-wind collision shock.
-
B.
We detected RRC structure which implies the existence of a cooler component of around .
-
C.
The abundance of carbon is at least one order of magnitude higher than that of nitrogen. The over-abundance indicates that the Wolf-Rayet (WC) stellar winds dominate the X-ray emitting gas.
-
D.
The emission lines from carbon, oxygen, neon and silicon and possibly the RRC from carbon show red-shifts of with broadenings of in FWHM. The red-shift would be evidence supporting the widely separated O supergiant as a companion with which the collision zone could be formed, lying behind the short-period binary. The wind from the O star in the short-period binary should be much weaker than that from the O supergiant in the wide binary.
Acknowledgements.
We thank A.Yamamoto for analysis and technical support. We thank C.Baluta for English correction. T.Tsujimoto gave us valuable comments on the chemical evolution of massive stars. Y. T. and Y. M. acknowledge support from the Grants-in-Aid for Scientific Research (numbers 20540237 and 20041010) by the Ministry of Education, Culture, Sports, Science and Technology.References
- Anders & Grevesse (1989) Anders, E., & Grevesse, N. 1989, Geochim. Cosmochim. Acta., 53,197
- Berghoefer et al. (1997) Berghoefer, T. W., Schmitt, J. H. M. M., Danner, R., & Cassinelli, J. P. 1997, A&A, 322, 167
- Chapman et al. (1999) Chapman, J. M., Leitherer, C., Koribalski, B., Bouter, R., & Storey, M. 1999, ApJ, 518, 890
- Dougherty & Williams (2000) Dougherty, S. M., & Williams, P. M. 2000, MNRAS, 319, 1005
- Hartkopf et al. (1999) Hartkopf, W. I., Mason, B. D., Gies, D. R., Ten Brummelaar, T., McAlister, H. A., Moffat, A. F. J., Shara, M. M., & Wallace, D. J. 1999, AJ, 118, 509
- Henley et al. (2005) Henley, D. B., Stevens, I. R., & Pittard, J. M. 2005, MNRAS, 356, 1308
- Hill et al. (2002) Hill, G. M., Moffat, A. F. J., St-Louis, N. 2002, MNRAS, 335, 1096
- Koyama et al. (1990) Koyama, K., Kawada, M., Takano, S., & Ikeuchi, S. 1990, PASJ, 42, L1
- Leitherer et al. (1997) Leitherer, C., Chapman, J. M., & Koribalski, B. 1997, ApJ, 481, 898
- Maeda et al. (1999) Maeda, Y., Koyama, K., Yokogawa, J., et al. 1999, ApJ, 510, 967
- Moffat & Seggeniss (1977) Moffat, A. F. J., & Seggewiss, W. 1977, A&A, 54, 607
- Nugis & Lammers (2000) Nugis, T., & Lamers, H. J. G. L. M. 2000, A&A, 360, 227
- Oskinova (2005) Oskinova, L. M. 2005, MNRAS, 361, 679
- Pollock (1987) Pollock, A. M. T. 1987, ApJ, 320, 283
- Pollock (1995) Pollock, A. M. T. 1995, IAUS, 165, 429
- Pollock et al. (1995) Pollock, A. M. T., Haberl, F., Corcoran, M. F. 1995,
- Pollock et al. (2005) Pollock, A. M. T., Corcoran, M. F., Stevens, I. R., & Williams, P. M. 2005, ApJ, 629, 482 IAUS, 163, 512
- Porquet et al. (2001) Porquet, D., Mewe, R., Dubau, J., Raassen, A. J. J., & Kaastra, J. S. 2001, A&A, 376, 1113
- Predehl & Schmitt (1995) Predehl & Schmitt 1995,A&A, 293, 889
- Raassen et al. (2003) Raassen, A. J. J., van der Hucht, K. A., Mewe, R., Antokhin, I. I., Rauw, G., Vreux, J.-M., Schmutz, W., Güdel, M. 2003, A&A, 402, 653
- Schild et al. (2004) Schild, H., Güdel, M., Mewe, R.,et al. 2004, A&A, 422, 177
- Singh et al. (1996) Singh, K. P., White, N. E., Drake, S. A. 1996, ApJ, 456, 766
- Stevens et al. (1996) Stevens, I. R., Corcoran, M. F., Willis, A. J., et al. 1996, MNRAS, 283, 589
- St.-Louis et al. (1987) St.-Louis, N., Drissen, L., Moffat, A. F. J., Bastien, P., & Tapia, S. 1987, ApJ, 322, 870
- van der Hucht (2001) van der Hucht, K. A. 2001, NewAR, 45, 135 (VIIth WR Catalogue)