Synthesis, structural and transport properties of the hole-doped Superconductor Pr1-xSrxFeAsO
Abstract
Superconductivity was achieved in PrFeAsO by partially substituting Pr3+ with Sr2+. The electrical transport properties and structure of this new superconductor Pr1-xSrxFeAsO at different doping levels (x = 0.05 0.25) were investigated systematically. It was found that the lattice constants (-axis and -axis) increase monotonously with Sr or hole concentration. The superconducting transition temperature at about 16.3 K (95% ) was observed around the doping level of 0.20 0.25. A detailed investigation was carried out in the sample with doping level of x = 0.25. The domination of hole-like charge carriers in this material was confirmed by Hall effect measurements. The magnetoresistance (MR) behavior can be well described by a simple two-band model. The upper critical field of the sample with = 16.3 K (x = 0.25) was estimated to be beyond 45 Tesla. Our results suggest that the hole-doped samples may have higher upper critical fields comparing to the electron-doped ones, due to the higher quasi-particle density of states at the Fermi level.
pacs:
74.10.+v, 74.25.Fy, 74.62.Dh, 74.25.DwI Introduction
The discovery of superconductivity at 26 K in FeAs-based layered quaternary compound LaFeAsO1-xFx has attracted great interests in the fields of condensed matter physics and material sciences.Kamihara2008 ; WenAdvMat2008 The family of the FeAs-based superconductors has been extended rapidly and it can be divided into three categories. The first category has the general formula of REFeAsO where RE stands for the rare earth elements and is abbreviated as the FeAs-1111 phase.Rainer The second class is formulated as (Ba, Sr)1-xKxFe2As2 which is denoted as FeAs-122 for simplicity.Rotter ; CWCh The third type LixFeAs has an infinite layered structure (denoted as FeAs- 111).LiFeAs ; LiFeAsChu ; LiFeAsUK As for the FeAs-1111 phase, most of the discovered superconductors are characterized as electron doped ones and the superconducting transition temperature has been quickly raised to = 55 56 K via replacing lanthanum with other rare earth elements.XHCh ; NLW ; Pr52K ; RenZA55K ; CP ; WangC About the hole-doped side, however, since the first hole-doped superconductor La1-xSrxFeAsO with 25 K was discovered,WenEPL ; LaSr2 only the Nd-based system Nd1-xSrxFeAsO with = 13.5 K was reported.NdSr Obviously, there is an extensive space to explore more superconductors in the hole-doped side based on the FeAs-1111 phase and to further extend the family of the FeAs-based superconductors. And it is also significant to investigate the basic physical properties of the hole-doped system based on the FeAs-1111 phase.
In this paper we report a new route to easily synthesize the hole-doped superconductors based on the FeAs-1111 phase, Sr doped Pr1-xSrxFeAsO, with the maximum superconducting transition temperature of 16.3 K. We carried out a systematic study on the evolution of the superconductivity and the lattice constants with the content of Sr or hole concentration in the system of Pr1-xSrxFeAsO. We found that the -axis and -axis lattice constants increase monotonously with doped concentration of Sr or hole numbers. The physical properties of a selected sample with x = 0.25 were investigated in depth. The conducting charge carriers in this sample were characterized to be hole type by the Hall effect measurements. And it is found that the MR data show a good two-band behavior. We also estimated the upper critical field of the same sample based on the Ginzburg-Landau theory as well as the Werthamer-Helfand-Hohenberg (WHH) formula.WHH It is suggested that the upper critical fields in the hole-doped samples may be higher than that in the electron-doped ones.
II Experimental Details
The Pr1-xSrxFeAsO samples were prepared using a two-step solid state reaction method. In the first step, PrAs and SrAs were prepared by reacting Pr flakes (purity 99.99%), Sr flakes (purity 99.9%) and As grains (purity 99.99%) at 500 oC for 8 hours and then 700 oC for 16 hours. They were sealed in an evacuated quartz tube when reacting. Then the resultant precursors were thoroughly grounded together with Fe powder (purity 99.95%) and Fe2O3 powder (purity 99.5%) in stoichiometry as given by the formula Pr1-xSrxFeAsO. All the weighing and mixing procedures were performed in a glove box with a protective argon atmosphere. Then the mixtures were pressed into pellets and sealed in a quartz tube with an atmosphere of 20% Ar. The materials were heated up to 1150 oC with a rate of 120 oC/hr and maintained for 60 hours. Then a cooling procedure was followed. It is important to note that the use of SrAs as the starting material, instead of using SrCO3 or SrO, is very essential to synthesize the high quality samples, and to much suppress the secondary impurity phases. This new route makes our hole-doped samples easily reproduced.
The X-ray diffraction (XRD) measurements of our samples were carried out by a - MXP18A-HF equipment with - scan. The dc magnetization measurements were done with a superconducting quantum interference device (Quantum Design, SQUID, MPMS7) and the ac susceptibility of the samples were measured on the Maglab-12T (Oxford) with an ac field of 0.1 Oe and a frequency of 333 Hz. The resistance and Hall effect measurements were done using a six-probe technique on the Quantum Design instrument physical property measurement system (PPMS) with magnetic fields up to 9 T. The temperature stabilization was better than 0.1% and the resolution of the voltmeter was better than 10 nV.
III Experimental data and discussion
III.1 Resistive and diamagnetic transition
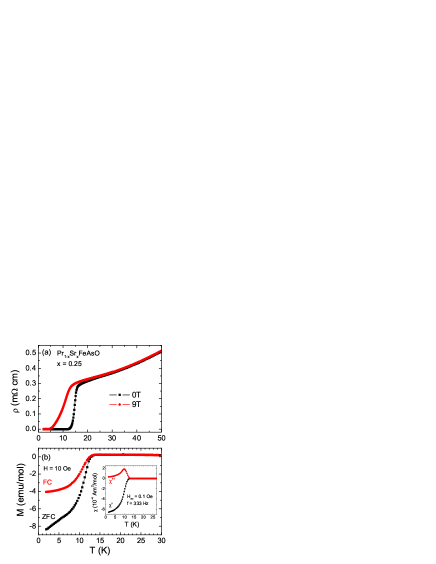
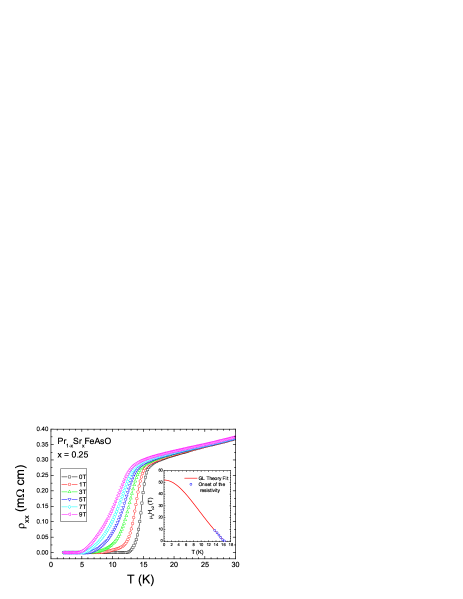
In Fig.1 (a) we present a typical set of resistive data for the sample Pr1-xSrxFeAsO with x = 0.25 under 0 T and 9 T near the superconducting transition. One can see that the resistivity transition at zero field is rather sharp indicating the quite high quality of our sample, and the onset transition temperature is about 16.3 K taking a criterion of 95% . A magnetic field of 9 T only depresses the onset transition temperature about 2.5 K but makes the superconducting transition broader. The former behavior may indicate a rather high critical field in our sample, while the latter reflected the weak link between the grains.XYZ Fig.1 (b) shows the zero field cooled and also the field cooled dc magnetization of the same sample at 10 Oe. And the diamagnetic transition measured with ac susceptibility technique is shown in the inset of Fig.1 (b). A rough estimate from the diamagnetic signal shows that the superconducting volume fraction of the present sample is beyond 50%, confirming the bulk superconductivity in our samples. The onset critical temperature by magnetic measurements is roughly corresponding to the zero resistivity temperature.
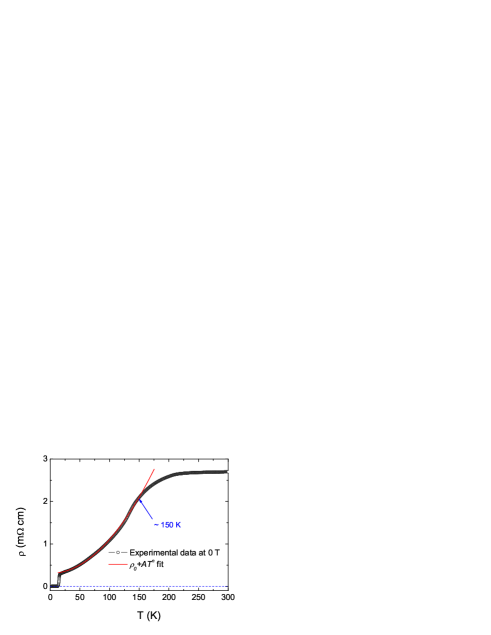
Shown in Fig. 2 is the temperature dependence of resistivity under zero field up to 300 K for the same sample as shown in Fig. 1. The resistivity data in the normal state were fitted using the formula
| (1) |
as we had done in the F-doped LaFeAsO system.XYZ As represented by the red solid line in Fig. 2, the data below about 150 K can be roughly fitted with the fitting parameters m cm and n = 2.000. The fine quadratic dependent behavior of the resistivity, which is consistent with the prediction of the Fermi-liquid theory, may suggest a rather strong scattering between electrons in the present system in the low temperature region. In high temperature region above about 150 K, however, a flattening of resistivity was observed clearly. The similar behavior has been observed in other hole-doped FeAs-1111 systems La1-xSrxFeAsO and Nd1-xSrxFeAsO,WenEPL ; LaSr2 ; NdSr and also in the FeAs-122 system (Ba, Sr)1-xKxFe2As2.Rotter We have pointed out that this behavior may be a common feature of the hole-doped FeAs-based superconductorsLaSr2 .
III.2 Doping dependence of lattice constants and superconducting properties
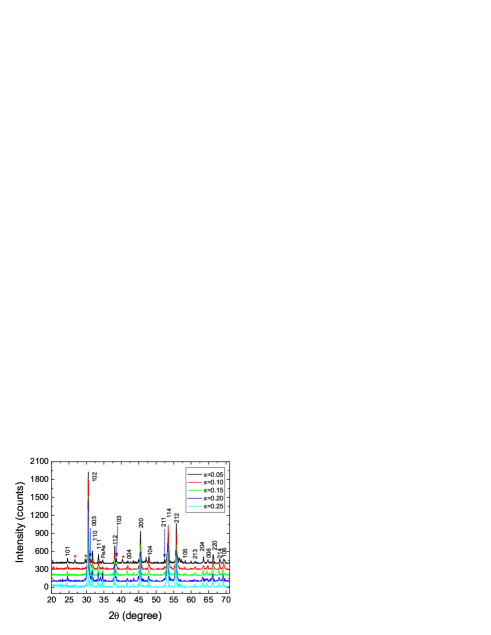
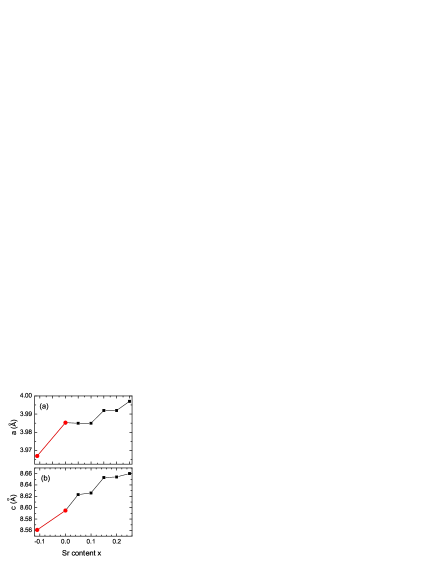
The XRD patterns for the samples with the nominal doping levels of 0.05 0.25 are shown in Fig. 3. Some small peaks from small amount of FeAs impurity phase which were denoted by red asterisk can still be seen, and the sample with x = 0.05 has a bit more impurity phase FeAs than other samples. However, it is clear that all the main peaks can be indexed to the FeAs-1111 phase with the tetragonal ZrCuSiAs-type structure. By having a closer scrutiny one can find that the diffraction peaks shift slightly to the low-angle side when more strontium are doped into the samples, suggesting an expanding effect of the lattice constants. The similar behavior has been observed in the Sr-doped LaFeAsO system previously.LaSr2 By using the software of Powder-XDongC , we took a general fit to the XRD data of each sample and determined the lattice constants. The doping dependence of the lattice constants calculated from the XRD data, along with the data of the undoped and 11% F-doped PrFeAsO samplesPr52K , are presented in Fig. 4. It is clear that both the -axis and -axis lattice constants expand monotonously from 11% F-doped PrFeAsO to the Sr-doped samples. This indicates that the strontium atoms go into the crystal lattice of the PrFeAsO system because the radii of Sr2+ (1.12 ) is larger than that of Pr3+ (1.01 ). It is worth noting that the extent of the lattice expanding is appreciably smaller than that in the Sr-doped LaFeAsO system, where the maximum onset transition temperature can be as high as 26 K.WenEPL ; LaSr2 In some cases, we see a slight drop of resistivity at temperatures as high as 28 K. So we believe that a further increase in is possible if more strontium can be chemically doped into this system, like in the case of Nd1-xSrxFeAsO.NdSr
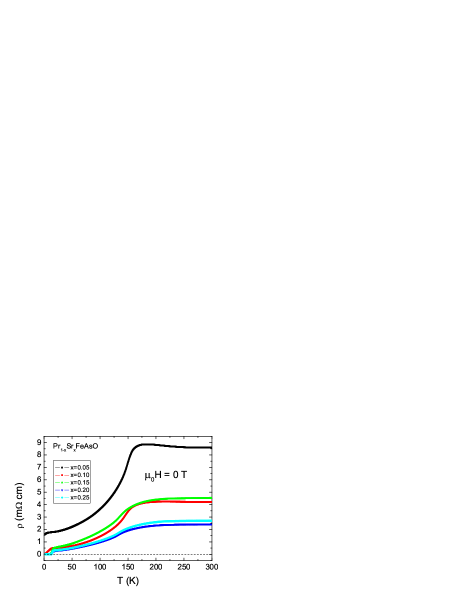
In Fig. 5 we show the resistivity data of our samples made at various nominal doping levels of Sr ranging from x = 0.05 to 0.25. A clear but rounded resistivity anomaly can be seen around 155175 K when the doping level is 5%. And a tiny resistivity drop at about 6 K which may be induced by the antiferromagnetic ordering of Pr3+ ions or superconductivity can be observed. At this time it is difficult to discriminate between the two scenarios since the magnitude of the resistivity drop is quite small. At the doping levels of 0.10 0.25, resistivity anomaly in high temperature regime is suppressed gradually and it eventually evolves into a flattening behavior at high doping levels. Also the magnitude of resistivity reduces obviously compared with the sample with 5% doping, suggesting that more and more conducting charge carriers were introduced into the samples. At the same time, the superconductivity emerges with doping and becomes optimal with an onset transition temperature of 16.3 K when the doping level is x = 0.20 0.25. It is worth noting that the resistivity at high temperatures at a high doping level of holes behaves in a different way compared with that in the electron-doped samplesPr52K ; SDW ; YJia where the resistivity anomaly is suppressed completely and the resistivity always presents a metallic behavior in that regime. While in the hole-doped samples, the resistivity anomaly is smeared much slower.WenEPL ; LaSr2 ; NdSr In the Nd1-xSrxFeAsO system,NdSr for example, it is found that the structural transition from tetragonal to orthorhombic occurs even in the sample with superconductivity. Doping more holes may lead to stronger suppression to the structural transition as well as the SDW order, this may leave a potential space to increase the superconducting transition temperature in the hole-doped FeAs-1111 phase.
III.3 Hall effect
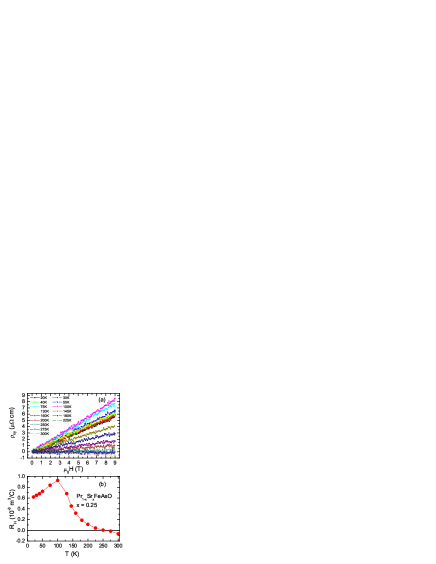
It is known that for a conventional metal with Fermi liquid feature, the Hall coefficient is almost independent of temperature. However, this situation is changed for a multiband materialHY or a sample with non-Fermi liquid behavior, such as the cuprate superconductors.Ong To get more information about the conducting carriers, we measured the Hall effect of the sample with x = 0.25 (the same one as shown in Fig. 1). Fig. 6(a) shows the magnetic field dependence of Hall resistivity () at different temperatures. In the experiment was taken as = [(+H) - (-H)]/2 at each point to eliminate the effect of the misaligned Hall electrodes. It is clear that all curves in Fig. 6(a) have good linearity versus the magnetic field. Moreover, is positive at all temperatures below 250 K giving a positive Hall coefficient , which actually indicates that hole type charge carriers dominate the conduction in the present sample.
The temperature dependence of is shown in Fig. 6(b). Very similar to that observed in La1-xSrxFeAsO samples,WenEPL ; LaSr2 the Hall coefficient reveals a huge hump in the intermediate temperature regime and the value of decreases down to zero at about 250 K, then it becomes slightly negative above that temperature. Here we employ a simple two-band scenario with different types of carriers to interpret this behavior. We have known that for a two-band system in the low-field limit, the Hall coefficient can be written as
| (2) |
where (i = 1, 2) is the conductance for different types of charge carriers in different bands, and represents the Hall coefficient for each type of carriers separately with the concentration of the charge carriers for the different bands. We attribute the strong temperature dependence of in the present system to the complicated variation of the conductance with temperature, which reflects mainly the temperature dependent behavior of the scattering relaxation time. And the sign-changing effect of may indicate the presence of two different types of charge carriers (electron and hole type) in the present system. The conductance of electron-like and hole-like carriers may vary differently with temperature, and the electron-like carriers become dominant when the temperature is higher than about 250 K.
This simple two-band model is consistent with the MR data (will be addressed in the next section). However, if there are two types of carriers in two bands, we may expect to be quadratic in magnetic field. The linear behavior in the curve shown in Fig. 6(a) seems to be not agree with this scenario. So further measurements with higher magnetic fields are required.
III.4 Magnetoresistance
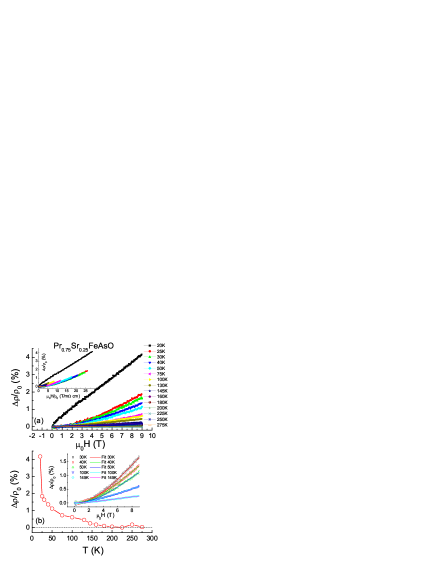
Magnetoresistance is a very powerful tool to investigate the electronic scattering process and the information about the Fermi surface.LiQ ; HY Field dependence of MR, for the sample with x = 0.25 at different temperatures is shown in the main frame of Fig. 7(a). Here MR was expressed as , where and represent the longitudinal resistivity at a magnetic field H and that at zero field, respectively. One can see that the curve obtained at 20 K reveals a rather different feature compared with the data at temperatures above 25 K. Also the magnitude of MR (obtained at 9 T) at 20 K reached 2 times of that at 25 K giving a sharp drop in the curve when increasing the temperature as revealed in the main frame of Fig. 7. We attribute this behavior to the presence of fluctuant superconductivity in the low temperature region (16.3 K-20 K). At temperatures higher than 150 K, the value of MR vanishes to zero gradually.
As for the case in the moderate temperature region, the curve reveals a clear nonlinear behavior. In the inset of Fig. 7(b) we present the data at five typical temperatures in this region. These data were then fitted based on a simple two-band model which gave the following formula
| (3) |
with and the fitting parameters which were related to the conductances and mobilities for the charge carriers in two bands. The fitting results were shown by the solid lines in the inset of Fig. 7(b). It is clear that Eq. 3 can describe our data quite well. This argument can be further confirmed by seeing about the situation of the so-called Kohler plot. The semiclassical transport theory has predicted that the Kohler rule, which can be written as
| (4) |
will be held if only one isotropic relaxation time is present in a single-band solid-state system.KL Eq. (4) means that the vs curves for different temperatures should be scaled to a universal curve if the Kohler rule is obeyed. The scaling based on the Kohler plot for the present sample is revealed in the inset of Fig. 7(a). An obvious violation of the Kohler rule can be seen on this plot. We attribute this behavior to the presence of a multi-band effect in the present system.
Actually, theoretical researches and angle-resolved photoemission spectroscopic (ARPES) studies have shown a rather complicated Fermi surface and energy-band structure in the FeAs-based superconductors. Our data from measuring the Hall effect and MR are consistent with these conclusions.
III.5 Upper critical field
Finally, we attempted to estimate the upper critical field of the sample with x = 0.25 from the resistivity data. Temperature dependence of resistivity under different magnetic fields is shown in the main frame of Fig. 8. Similar to that found in the F-doped LaFeAsO polycrystalline samples,XYZ ; WangNL2 the onset transition point, which reflects mainly the upper critical field in the configuration of Hab-plane, shifts more slowly than the zero resistivity point to low temperatures under fields. We take a criterion of 95% to determine the onset transition points under different fields, which are presented by the blue open circles in the inset of Fig. 6. From these data we can roughly estimate the upper critical field of this sample based on the Ginzburg-Landau (GL) theory. The following equation have been extract from the GL theory and used successfully on other samples:XYZ ; WangNL2 ; NTS
| (5) |
where is the reduced temperature and is the upper critical field at zero temperature. Taking = 16.3 K and as the adjustable parameter, the measured data in the inset of Fig. 8 were then fitted using Eq. 5. One can see a quite good fit in the inset of Fig. 8 as revealed by the red solid line. The zero temperature upper critical field was determined to be 52 T from the fitting process. Actually one can also determine the slope of near , which is found to be about -4.0 T/K in the present sample. By using the WHH formulaWHH the value of zero temperature upper critical field can be estimated through:
| (6) |
Taking = 16.3 K, we get T. Regarding the relatively low value of =16.3 K in the present sample, this value of upper critical field is actually quite high. The slope of in the hole-doped sample is clearly larger than that in the electron-doped samples. In the hole-doped La1-xSrxFeAsO superconducting samples, we also found much larger when comparing it with the F-doped LaFeAsO sample.XYZ ; WangNL2 This may be understood as due to the higher quasiparticle density of states (DOS) near the Fermi level in the hole-doped samples. In a dirty type-II superconductor, it was predictedJaffePRB1989 that with the normal state specific heat coefficient which is proportional to the DOS at . It is thus reasonable to ascribe the higher value of to higher DOS in the hole-doped samples. Theoretical calculations do show that the DOS in the hole-doped side is larger than that in the electron-doped samples.SinghPRB ; LuZY The measurements on lower critical fieldsRenC and specific heatMuG in Ba0.6K0.4Fe2As2 reveal that the superfluid density and the normal state DOS is about 5 to 10 times larger than that in the F-doped REFeAsO system. If the normal state DOS is really larger in the hole-doped systems, higher upper critical fields may be achieved in the hole-doped FeAs-1111 samples provided that the superconducting transition temperature can be improved to the same scale.
IV Concluding remarks
In summary, bulk superconductivity was achieved by substituting Pr3+ with Sr2+ in PrFeAsO system. A systematic evolution of superconductivity and the lattice constants with doping in hole doped Pr1-xSrxFeAsO was discovered. By doping more Sr into the parent phase PrFeAsO, the anomaly of resistivity at about 165 K is suppressed gradually and the superconductivity eventually sets in. The -axis and -axis lattice constants increase monotonously with Sr concentration. The maximum superconducting transition temperature = 16.3 K is found to appear around the nominal doping level x = 0.20 0.25. The positive Hall coefficient in a wide temperature range suggests that the hole type charge carriers dominate the conduction in this system. The strong temperature dependence and sign-changing effect of were attributed to a multi-band effect and have been interpreted based on a simple two-band model with different types of charge carriers. This argument was further confirmed by the nonlinear field dependence of MR and the violation of the Kohler rule. Interestingly, the slope of the upper critical magnetic field vs. temperature near seems to be much higher than that of the electron-doped samples. This is attributed to the higher DOS in the hole-doped samples than in the electron-doped ones. This may provide a new way to enhance the upper critical field in the hole-doped FeAs-1111 superconductors.
Acknowledgements.
We acknowledge the help of XRD experiments from L. H. Yang and H. Chen. This work is supported by the Natural Science Foundation of China, the Ministry of Science and Technology of China (973 project: 2006CB01000, 2006CB921802), the Knowledge Innovation Project of Chinese Academy of Sciences (ITSNEM).References
- (1) Y. Kamihara, T. Watanabe, M. Hirano, and H. Hosono, J. Am. Chem. Soc. 130, 3296 (2008).
- (2) Hai-Hu Wen, Advanced Materials 20, 3764-3769 (2008).
- (3) Rainer Pottgen, and Dirk Johrendt, arXiv: Condat/0807.2138. Z. Naturforsch. 63b, 1135-1148 (2008).
- (4) M. Rotter, M. Tegel, and D. Johrendt, Phys. Rev. Lett. 101, 107006 (2008).
- (5) K. Sasmal, B. Lv, B. Lorenz, A. M. Guloy, F. Chen, Y. Y. Xue, and C. W. Chu, Phys. Rev. Lett. 101, 107007 (2008).
- (6) X. C. Wang, Q. Q. Liu, Y. X. Lv, W. B. Gao, L. X. Yang, R. C. Yu, F. Y. Li, and C. Q. Jin, arXiv: Condat/0806.4688.
- (7) Joshua H. Tapp, Zhongjia Tang, Bing Lv, Kalyan Sasmal, Bernd Lorenz, Paul C.W. Chu, and Arnold M. Guloy, Phys. Rev. B 78, 060505(R) (2008).
- (8) Michael J. Pitcher, Dinah R. Parker, Paul Adamson, Sebastian J. C. Herkelrath, Andrew T. Boothroyd, and Simon J. Clarke, arXiv: Condat/0807.2228.
- (9) X. H. Chen, T. Wu, G. Wu, R. H. Liu, H. Chen, and D. F. Fang, Nature 453,761-762 (2008).
- (10) G. F. Chen, Z. Li, D. Wu, G. Li, W. Z. Hu, J. Dong, P. Zheng, J. L. Luo, and N. L. Wang, Phys. Rev. Lett. 100, 247002 (2008).
- (11) Zhi-An Ren, Jie Yang, Wei Lu, Wei Yi, Guang-Can Che, Xiao-Li Dong, Li-Ling Sun, and Zhong-Xian Zhao, Materials Research Innovations 12, 105-106, (2008).
- (12) Z. A. Ren, W. Lu, J. Yang, W. Yi, X. L. Shen, Z. C. Li, G. C. Che, X. L. Dong, L. L. Sun, F. Zhou, and Z. X. Zhao, Chin. Phys. Lett. 25, 2215 (2008).
- (13) Peng Cheng, Lei Fang, Huan Yang, Xiyu Zhu, Gang Mu, Huiqian Luo, Zhaosheng Wang, and Hai-Hu Wen, Science in China G, 51(6), 719-722 (2008).
- (14) Cao Wang, Linjun Li, Shun Chi, Zengwei Zhu, Zhi Ren, Yuke Li, Yuetao Wang, Xiao Lin, Yongkang Luo, Shuai Jiang, Xiangfan Xu, Guanghan Cao, and Zhu’an Xu, Europhys. Lett. 83, 67006 (2008).
- (15) H. H. Wen, G. Mu, L. Fang, H. Yang, and X. Y. Zhu, Europhys. Lett. 82, 17009 (2008).
- (16) Gang Mu, Lei Fang, Huan Yang, Xiyu Zhu, Peng Cheng, and Hai-Hu Wen, J. Phys. Soc. Jpn. Suppl. 77, 15-18 (2008).
- (17) Karolina Kasperkiewicz, Jan-Willem G. Bos, Andrew N. Fitch, Kosmas Prassides, and Serena Margadonna, arXiv:cond-mat/0809.1755. Chem. Commun. in press.
- (18) N. R. Werthamer, E. Helfand and P. C. Hohenberg, Phys. Rev. 147, 295 (1966).
- (19) Xiyu Zhu, Huan Yang, Lei Fang, Gang Mu, and Hai-Hu Wen, Supercond. Sci. Technol. 21, 105001 (2008).
- (20) C. Dong, J. Appl. Cryst. 32, 838-838 (1999).
- (21) J. Dong, H. J. Zhang, G. Xu, Z. Li, G. Li, W. Z. Hu, D. Wu, G. F. Chen, X. Dai, J. L. Luo, Z. Fang, and N. L. Wang, Europhys. Lett. 83, 27006 (2008).
- (22) Ying Jia, Peng Cheng, Lei Fang, Huiqian Luo, Huan Yang, Cong Ren, Lei Shan, Changzhi Gu, and Hai-Hu Wen, Appl. Phys. Lett. 93, 032503 (2008).
- (23) H. Yang, Y. Liu, C. G. Zhuang, J. R. Shi, Y. G. Yao, S. Massidda, M. Monni, Y. Jia, X. X. Xi, Q. Li, Z. K. Liu, Q. R. Feng, H. H. Wen, Phys. Rev. Lett. 101, 067001 (2008).
- (24) T. R. Chien, D. A. Brawner, Z. Z. Wang, and N. P. Ong, Phys. Rev. B, 43, 6242-6245 (1991).
- (25) Q. Li, B. T. Liu, Y. F. Hu, J. Chen, H. Gao, L. Shan, H. H. Wen, A. V. Pogrebnyakov, J. M. Redwing, and X. X. Xi, Phys. Rev. Lett. 96, 167003 (2006).
- (26) J. M. Ziman, Electrons and Phonons, Classics Series (Oxford University Press, New York, 2001).
- (27) G. F. Chen, Z. Li, G. Li, J. Zhou, D. Wu, J. Dong, W. Z. Hu, P. Zheng, Z. J. Chen, H. Q. Yuan, J. Singleton, J. L. Luo, and N. L. Wang, Phys. Rev. Lett. 101, 057007 (2008).
- (28) L. Fang, Y. Wang, P. Y. Zou, L. Tang, Z. Xu, H. Chen, C. Dong, L. Shan, and H. H. Wen, Phys. Rev. B 72, 014534 (2005).
- (29) J. E. Jaffe, Phys. Rev. B 40, 2558 (1989).
- (30) D. J. Singh, Phys. Rev. B 78, 094511 (2008).
- (31) Fengjie Ma, Zhong-Yi Lu, and Tao Xiang, arXiv:cond-mat/0806.3526.
- (32) Cong Ren, Zhao-sheng Wang, Hui-qian Luo, Huan Yang, Lei Shan, Hai-Hu Wen, arXiv:cond-mat/0808.0805.
- (33) Gang Mu, Huiqian Luo, Zhaosheng Wang, Lei Shan, Cong Ren, and Hai-Hu Wen, arXiv:cond-mat/0808.2941.