“Normal” FR II Radio Galaxies as a Probe of the Nature of X-Shaped Radio Sources
Abstract
We present a multiwavelength radio study of a sample of nearby Fanaroff-Riley class II (FR II) radio galaxies, matched with the sample of known X-shaped radio sources in size, morphological properties and redshift, using new Giant Metrewave Radio Telescope (GMRT) data and archival data from the Very Large Array (VLA). Our principal aim in this paper is to provide a control sample for earlier studies of samples of ‘X-shaped’ radio sources, which have similar luminosities and small-scale radio structures to our targets but exhibit large-scale extensions to their lobes that more typical FR II sources lack; earlier spectral work with the GMRT has suggested that these ‘wings’ sometimes have flat spectral indices at low frequencies, in contrast to expectations from models in which the wings are formed hydrodynamically or by jet reorientation. In our new observations we find that almost all of our target FR II radio galaxies show standard spectral steepening as a function of distance from the hotspot at the low frequencies (610 MHz and 240 MHz) provided by the GMRT data, even when transverse extensions to the lobes are present. However, one source, 3C 321, has a low-surface-brightness extension to one lobe that shows a flatter spectral index than the high-surface-brightness hotspotslobes, as found in X-shaped sources.
keywords:
galaxies: active – galaxies: formation – radio continuum: galaxies1 Introduction
A small but significant fraction of low-luminosity radio galaxies have a pair of large low-surface-brightness lobes oriented at an angle to the high-surface-brightness ‘active’ radio lobes, giving the total source an ‘X’ shape. This peculiar and small subclass of extragalactic radio sources is commonly referred to as X-shaped, or ‘winged’ sources. Typically, both sets of lobes are symmetrically aligned through the centre of the associated elliptical host galaxy and are approximately equal in linear extent. Merritt & Ekers (2002) noted that the majority of these sources are of Fanaroff-Riley type II (FR II) (Fanaroff & Riley, 1974) and the rest are either FR Is or have an intermediate classification.
Several authors have attempted to explain the unusual structure in X-shaped sources. One proposal is that these objects are produced by a central engine that has been reoriented, perhaps due to a minor merger (Merritt & Ekers 2002; Dennett-Thorpe et al. 2002; Gopal-Krishna, Biermann & Wiita 2003). Alternatively, they may also result from two pairs of jets, which are associated with a pair of unresolved AGNs (Lal & Rao 2005, 2007), although this model does not as yet explain (i) why is there always only one pair of hotspots and (ii) why, when a jet is observed, is it always in the same pair of lobes? Additional models for the morphologies of the X-shaped sources include a hydrodynamic origin (Leahy & Williams 1984; Worrall, Birkinshaw & Cameron 1995; Capetti et al. 2002; Kraft et al. 2005) while some authors have suggested a conical precession of the jet axis (Rees 1978; Parma, Ekers & Fanti 1985; Mack et al. 1994). See Lal & Rao (2007) and Cheung (2007) for more detailed discussion of the competing models.
| RA | Dec | Observing | Bandwidth | Centre | Calibrator | tintegration | |||
|---|---|---|---|---|---|---|---|---|---|
| date | Nominal Effective | frequency | flux | phase | (on-source) | ||||
| (J2000) | ———- 610 MHz / 240 MHz ———- | density | (hour) | ||||||
| 3C 033 | 01:08:50.5 | 13:18:31 | 16 Jun 2005 | 16 / 8 | 14.25 / 6.750 | 606.25 / 237.69 | 3C 048 | 3C 48 | 3.51 |
| 3C 098 | 03:58:54.4 | 10:26:03 | 16 Jun 2005 | 16 / 8 | 14.25 / 6.750 | 606.25 / 240.56 | 3C 147 | 0521166 | 3.58 |
| 3C 285 | 13:21:17.8 | 42:35:15 | 16 Jun 2005 | 16 / 8 | 14.25 / 6.750 | 606.25 / 240.06 | 3C 147 | 3C 286 | 2.72 |
| 3C 321 | 15:31:43.4 | 24:04:19 | 30 May 2005 | 16 / 8 | 14.25 / 6.750 | 606.25 / 240.19 | 3C 048 | 1419064 | 3.58 |
| 3C 382 | 18:35:02.1 | 32:41:50 | 16 Jun 2005 | 16 / 8 | 14.25 / 6.750 | 606.25 / 236.44 | 3C 147 | 1829487 | 2.85 |
| 3C 390.3 | 18:42:09.0 | 79:46:17 | 29 May 2005 | 16 / 6 | 14.25 / 4.375 | 606.25 / 240.12 | 3C 048 | 1459716 | 4.12 |
| 3C 388 | 18:44:02.4 | 45:33:30 | 29 May 2005 | 16 / 6 | 14.25 / 4.375 | 606.25 / 237.19 | 3C 147 | 1459716 | 3.73 |
| 3C 452 | 22:45:48.8 | 39:41:16 | 30 May 2005 | 16 / 8 | 14.25 / 6.750 | 606.25 / 240.06 | 3C 048 | 2350646 | 4.47 |
Spectral studies of the lobes of X-shaped sources provide a crucial test of the different models for these objects. In either the hydrodynamic, reorientation or precession models, the ‘wings’ – which never show evidence for compact jet-related or hotspot structures in the radio – would be expected to contain older plasma than the lobes that do show hotspots and jets, assumed to be the currently active lobes. In standard synchrotron ageing models (e.g. Jaffe & Perola 1973) this would give rise to steeper radio spectra. In early work in this area, Dennett-Thorpe et al. (2002) showed that there was no evidence for spectral ageing at high frequencies in the wings of two well-studied X-shaped sources, 3C 223.1 and 3C 403. More recently Lal & Rao (2007) showed that even at low frequencies a significant fraction of a sample of X-shaped sources had wings with flatter, or at least comparable, spectral indices to those in the brighter ‘active lobes’. This motivated their suggestion that these sources could be powered by a pair of associated, unresolved AGN. Another possibility is simply that our current understanding of spectral ageing in radio lobes, particularly at low frequencies, is incorrect.
In this paper we present Giant Metrewave Radio Telescope (GMRT) and Very Large Array (VLA) observations of a control sample of low-redshift normal FR II radio galaxies. These objects lack the twin extended wings that are characteristic of the X-shaped sources, though many of them have low-luminosity transverse extensions of the lobes on smaller scales. Using observations carried out in the same manner as those of Lal & Rao (2007), we are able to investigate whether standard spectral ageing models provide an adequate description of these normal FR II sources, and to discuss the implications of our results for models of X-shaped sources.
Throughout the paper we define the spectral index in the sense that .
2 Sample
Our sample (Table 1) is selected on the basis of similarity with known X-shaped sources and consists of all nearby () normal FR II sources from the 3CRR catalogue. These sources have radio luminosities similar to that of the X-shaped sources, which lie close to the FR I/FR II divide. We impose an angular size cutoff (based on high-frequency radio maps) on the target sample to exclude the giant radio galaxies and ensure that our sample sources are of similar angular size to typical X-shaped sources. In addition, many of the sources show diffuse, low-surface-brightness transverse extensions of the lobes close to the core, implying that the sample sources could be similar to known X-shaped sources but with the wings being shorter either as a result of projection or (in hydrodynamical models) because they have not yet grown to lengths comparable to those of the active lobes.
3 GMRT Observations
| 178 MHz | 240 MHz | 408 MHz | 610 MHz | 750 MHz | 1400 MHz | 2695 MHz | 4850 MHz | |
|---|---|---|---|---|---|---|---|---|
| 3C 33 | 59.302.97a | 44.97 0.12 | 29.60 5.44b | 23.84 0.09 | 20.001.00c | 12.82 1.92d | 7.92 0.40c | 5.04 0.76c |
| 3C 98 | 51.452.57a | 32.27 0.09 | 24.20 4.63b | 19.82 0.03 | 16.000.80c | 9.90 0.50c | 7.01 0.35c | 4.97 0.25c |
| 3C 285 | 11.401.71c | 8.64 0.06 | 4.44 0.01 | 3.140.17a | 2.16 0.32d | 1.23 0.06c | 0.58 0.09d | |
| 3C 321 | 14.721.47a | 11.71 0.07 | 8.64 0.71c | 6.81 0.03 | 5.900.29c | 3.57 0.08a | 2.05 0.04a | 1.21 0.12c |
| 3C 382 | 21.93 0.05 | 14.70 0.74e | 11.10 0.02 | 9.290.50a | 5.60 0.84c | 3.49 0.17c | 2.20 0.07a | |
| 3C 390.3 | 52.704.20c | 41.05 0.14 | 19.04 0.07 | 17.600.90c | 11.26 0.58a | 6.76 0.34c | 4.48 0.22c | |
| 3C 388 | 26.811.34a | 20.60 0.16 | 14.42 0.29f | 11.14 0.10 | 9.800.50c | 5.74 0.24a | 3.14 0.05c | 1.76 0.09c |
| 3C 452 | 59.302.97a | 48.02 0.04 | 32.67 2.87c | 21.73 0.02 | 19.320.44a | 10.54 0.27a | 5.93 0.08a | 3.24 0.32c |
We adopted an observing strategy nearly identical to our earlier observations for X-shaped radio sources (Lal & Rao, 2007). The key difference was that we observed two sources in each full synthesis observing run, typically of 10 h, as against one source during our earlier observations. The 240 MHz and 610 MHz feeds of GMRT are coaxial feeds and therefore it was possible to perform simultaneous dual frequency observations at these two frequencies; accordingly we observed all the FR II sources in our sample at these two frequencies, using the GMRT in the standard spectral line mode with a spectral resolution of 125 kHz (program ID 08MHa01). The primary beams are 108 arcmin and 43 arcmin at 240 MHz and 610 MHz, respectively. Table 1 gives the details of the observations.
The GMRT has a hybrid configuration (Swarup et al., 1991) with 14 of its 30 antennas located in a central compact array with size 1.1 km and the remaining antennas distributed in a roughly ‘Y’ shaped configuration, giving a maximum baseline length of 25 km. The baselines obtained from antennas in the central square are similar in length to the VLA -array configuration, while the baselines between the arm antennas are comparable in length to the VLA -array configuration. The maximum and minimum baseline lengths for the VLA -array configuration, and for the VLA -array configuration are 1.03 km and 0.035 km, and 11.4 km and 0.21 km, respectively without foreshortening. The typical maximum and minimum baseline lengths for the GMRT during observations were 17.6 km and 0.12 km, and the actual maximum and minimum baseline lengths without foreshortening are 26.0 km and 0.1 km. Hence, a single observation with the GMRT samples the () plane adequately on both short and long baselines, and provides good angular resolution of 5 arcsec and 12 arcsec at 610 MHz and 240 MHz, respectively. The array can map detailed source structure with reasonably good sensitivity.
4 GMRT Data Reduction
The visibility data were converted to FITS and analyzed using aips in the standard way. The flux density calibrators 3C 48, 3C 147 and 3C 286 were observed, depending on their availability, at the beginning or at the end, both as amplitude calibrators and to estimate and correct for the bandpass shape. For the flux-density scale we used an extension of the Baars et al. (1977) scale to low frequencies, using the coefficients in the aips task ‘SETJY’. Secondary phase calibrators were observed at intervals of 30 min. The error in the estimated flux density, both due to calibration and systematic errors, is 5 per cent. As is standard at these low frequencies, the data suffered from scintillations and intermittent radio frequency interference (RFI). In addition to normal editing of the data, we identified and flagged time ranges affected by scintillation and channels affected by RFI, after which the central channels were averaged using the aips task ‘SPLAT’ to reduce the data volume. To avoid bandwidth smearing, the effective band at 240 MHz and 610 MHz was reduced to 6 channels and 3 channels, respectively.
We used the aips task ‘IMAGR’ to map the full field at both frequencies, using 49 facets spread across a 1.8 field at 240 MHz and 9 facets covering slightly less than a 0.7 field at 610 MHz. To obtain high-resolution images that were also sensitive to extended structure, we employed the SDI CLEANing algorithm (Steer, Dewdney & Ito, 2003). We used uniform weighting and the 3D option for -term correction throughout our analysis. The presence of a large number of point sources in the field allowed us to do phase self-calibration to improve the image. After two or three cycles of phase self-calibration, a final self-calibration of both amplitude and phase was made and a final image was produced. At each iteration of self-calibration, the Fourier transform of the image and the visibilities were compared to check for improvement in the source model. The final images were stitched together using the aips task ‘FLATN’ and corrected for the primary beam of the GMRT antennas.
5 VLA data
To complement our GMRT observations we obtained VLA images at 1.4 GHz to 1.5 GHz. The majority of these were taken from the online 3CRR Atlas111Available at http://www.jb.man.ac.uk/atlas/ . which provides well-calibrated, well-sampled images for most of our targets. However, superior maps were available to us for two objects, 3C 285 (the images of (Hardcastle et al., 2007)) and 3C 321 (image from Evans et al. 2008). For 3C 98 the 3CRR Atlas provides only a 5 GHz image; we extracted data from the VLA archive in B, C and D configurations (observing IDs and dates are respectively AB403 on 1986 Jul 17, AB403 on 1986 Oct 29 and AR440 on 2000 Sep 09) and reduced them in aips in the standard way to make a map suitable for our analysis. The VLA maps had a resolution of 4 arcsec for all our target sources, which is comparable to the GMRT resolution at 610 MHz.
6 Results
The radio images, shown in Figs. 2 to 9, have good () coverage, angular resolutions of 4 arcsec, 5 arcsec and 13 arcsec, and rms noise in the maps in the range 0.02 to 0.7 mJy beam-1, 0.2 to 2.1 mJy beam-1 and 1.5–13.9 mJy beam-1 at 1.41.5 GHz, 610 MHz and 240 MHz, respectively. The dynamic ranges in the maps are in the range 400–7000, 300–4400 and 300 to 3300 at 1.4 to 1.5 GHz, 610 MHz and 240 MHz, respectively. Consequently, in the vicinity of strong sources, the local noise was sometimes higher than the noise in empty regions. The selection of contours shown in the figures is based on the rms noise in the immediate vicinity of the source, with the first contour level being 3 to 5 times this rms noise. In addition, the peak surface brightness in the full field of view is sometimes higher than the peak surface brightness mentioned in each panel, which corresponds to the region of the figure displayed.
To make further comparisons of the morphology and flux densities, the final calibrated () data at 610 MHz were mapped using a () range of 0 to 22 k, which is similar to that of the 240 MHz data, and then restored using a restoring beam corresponding to that of the 240 MHz map. The resolution of archive VLA 1.4 to 1.5 GHz maps was slightly better than the resolution of GMRT 610 MHz maps. Therefore each of the VLA 1.4 to 1.5 GHz maps was matched with the resolution of the corresponding 610 MHz map using aips task ‘CONVL’. The VLA contour maps matched to the resolution of 610 MHz, the 610 MHz contour maps, the 610 MHz contour maps matched to the resolution of 240 MHz, and the 240 MHz contour maps for all the observed sources are shown in Figs. 2 to 9. The sequence of maps is ordered in right ascension. The ellipse in the box in the lower left-hand corner of each map shows the shape of the synthesized beam (FWHM). All positions are given in J2000 coordinates.
6.1 Radio morphology and low frequency radio spectra
The observations described allow us to investigate in detail the morphologies and spectral index distributions of all sources. The restored and matched maps at the three frequencies were used further for the spectral analysis for each of these sources. We determine the spectral index distribution using the standard direct method of determining the spectral index between maps and at two frequencies and , where the spectral index is given by the ratio of and .
 |
| Flux density | Spectral index | ||||||||||
|---|---|---|---|---|---|---|---|---|---|---|---|
| (high resolution) | (low resolution) | (high resolution) | (low resolution) | ||||||||
| 1.5 GHz 610 MHz | 610 MHz 240 MHz | ||||||||||
| (mJy) | (mJy) | (real) | (conservative) | (real) | (conservative) | ||||||
| 3C 33 | North lobe | (A) | 2187.2 | 3444.9 | 4246.6 | 6161.2 | 0.50 0.01 | 0.61 0.51 | 0.37 0.01 | 0.48 0.25 | |
| South lobe | (E) | 6127.5 | 12047.0 | 11874.0 | 16775.0 | 0.75 0.01 | 0.79 0.30 | 0.40 0.01 | 0.46 0.41 | ||
| North Left wing | (C) | 19.9 | 33.0 | 229.6 | 565.3† | 0.56 0.08 | 0.80 0.24 | 0.97 0.19‡ | |||
| South Left wing | (D) | 30.2 | 69.8 | 372.3 | 165.3† | 0.93 0.04 | 0.89 0.38 | 0.87 0.20‡ | |||
| 3C 98 | North lobe | (A) | 399.3 | 804.5 | 3522.5 | 4914.8 | 0.77 0.01 | 0.76 0.08 | 0.36 0.01 | 0.40 0.14 | |
| South lobe | (E) | 275.7 | 517.1 | 2440.9 | 3038.1 | 0.82 0.01 | 0.77 0.10 | 0.27 0.01 | 0.37 0.14 | ||
| North Left wing | (C) | 153.3 | 302.2 | 0.75 0.01 | 0.75 0.12 | ||||||
| Bottom Left wing | (D) | 24.5 | 58.7 | 0.97 0.01 | 1.05 0.20 | ||||||
| Top Right wing | (B) | 28.7 | 77.1 | 1.09 0.01 | 1.14 0.11 | ||||||
| 3C 285 | East lobe | (A) | 114.6 | 217.8 | 724.3 | 1360.3 | 0.70 0.01 | 0.78 0.08 | 0.68 0.01 | 0.69 0.07 | |
| West lobe | (E) | 83.0 | 188.7 | 451.6 | 807.9 | 0.90 0.01 | 0.88 0.12 | 0.63 0.01 | 0.64 0.06 | ||
| North Left wing | (C) | 41.1 | 100.3 | 402.3 | 816.3 | 0.98 0.01 | 1.02 0.23 | 0.76 0.01 | 0.80 0.17 | ||
| South Left wing | (F) | 48.6 | 120.7 | 1.00 0.01 | 1.03 0.24 | ||||||
| North Right wing | (D) | 46.4 | 105.0 | 0.89 0.01 | 0.90 0.13 | ||||||
| South Right wing | (B) | 31.6 | 84.4 | 1.08 0.01 | 1.06 0.11 | 0.67 0.01 | 0.65 0.16 | ||||
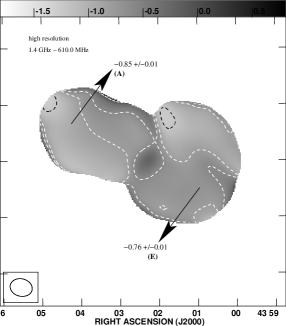
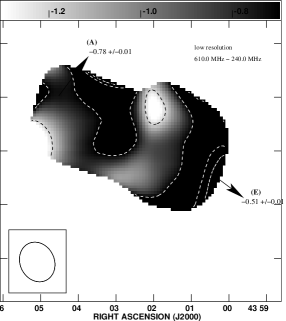
| 3C 321 | North-West lobe | (A) | 310.4 | 704.4 | 588.3 | 881.6 | 0.89 0.01 | 0.87 0.90 | 0.44 0.03 | 0.69 0.29 | |
| South-East lobe | (E) | 1855.9 | 4091.2 | 2955.3 | 4034.8 | 0.86 0.01 | 0.85 0.51 | 0.34 0.03 | 0.65 0.31 | ||
| North wing | (C) | 24.5 | 32.1 | 17.2 | 53.9† | 0.30 0.03 | 0.31 0.30 | 1.22 0.21‡ | |||
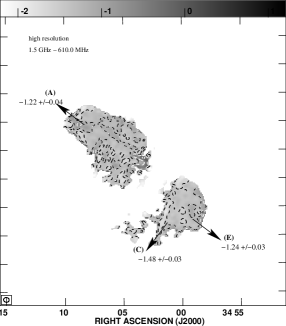
| 3C 382 | South-West lobe | (E) | 90.5 | 276.1 | 1811.3 | 3537.0 | 1.24 0.03 | 1.32 0.12 | 0.72 0.01 | 0.77 0.15 | |
| North-East lobe | (A) | 381.0 | 1142.0 | 1829.6 | 3789.0 | 1.22 0.04 | 1.19 0.17 | 0.79 0.01 | 0.82 0.23 | ||
| South-East wing | (C) | 12.8 | 47.2 | 186.3 | 434.7 | 1.48 0.01 | 1.45 0.18 | 0.91 0.01 | 0.89 0.21 | ||
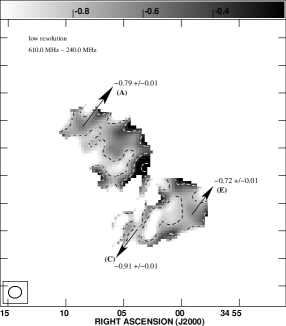
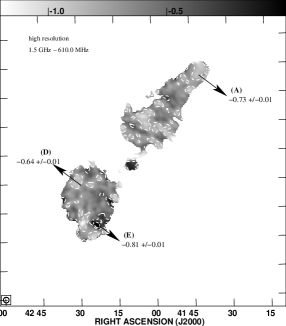
| 3C 390.3 | North-West lobe | (A) | 534.8 | 1040.5 | 791.8 | 1382.5 | 0.73 0.01 | 0.80 0.07 | 0.60 0.01 | 0.84 0.50 | |
| South-East lobe | (E) | 1803.0 | 3744.5 | 2468.7 | 4942.1 | 0.81 0.01 | 0.81 0.14 | 0.75 0.01 | 0.90 0.30 | ||
| South Left wing | (D) | 56.2 | 100.9 | 102.1 | 242.7 | 0.64 0.01 | 0.70 0.13 | 0.93 0.02 | 0.90 0.18 | ||
| 3C 388 | North-East lobe | (A) | 545.0 | 1118.2 | 1538.8 | 3173.5 | 0.85 0.01 | 0.90 0.12 | 0.78 0.01 | 0.81 0.18 | |
| South-West lobe | (E) | 428.7 | 815.0 | 2213.6 | 3552.5 | 0.76 0.01 | 0.72 0.08 | 0.51 0.01 | 0.56 0.20 | ||
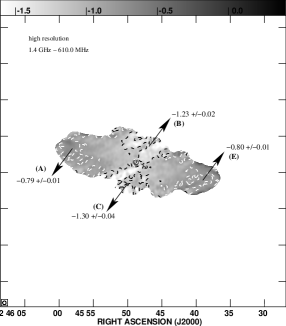
| 3C 452 | East lobe | (A) | 263.5 | 512.7 | 1988.5 | 4106.4 | 0.79 0.01 | 0.77 0.07 | 0.78 0.01 | 0.79 0.13 | |
| West lobe | (E) | 234.5 | 460.2 | 2470.1 | 4555.2 | 0.80 0.01 | 0.76 0.06 | 0.66 0.01 | 0.72 0.13 | ||
| North wing | (B) | 18.8 | 53.1 | 586.4 | 1353.6 | 1.23 0.02 | 1.25 0.18 | 0.90 0.02 | 0.96 0.13 | ||
| South wing | (C) | 8.6 | 25.9 | 201.6 | 598.2 | 1.30 0.04 | 1.22 0.17 | 1.17 0.02 | 1.17 0.20 | ||
The flux densities at 240 MHz and 610 MHz plotted in Fig. 1 are calculated using the images shown in Figs. 2 to 9 (upper left and upper middle panels, and lower left and lower middle panels), which are matched to the same resolution, and these values are tabulated in Table 2. The flux densities tabulated in Table 3 correspond to the regions marked on Figs. 2 to 9. Our regions are representative of the spectral indices of the radio hotspots and lobes and the faint diffuse features, and are integrated using the aips task ‘IMEAN’ over an appropriate region (a circular region of 5 pixels radius centred at the position of the tail of the arrows plotted on the maps). The regions used are at least four times the beam size to reduce statistical errors, and each of the regions is well within the contour level corresponding to three times the local r.m.s. noise. In addition, we show spectral results based on two error estimates; (i) the estimates based on the noise at a source-free location using a similar-sized circular region, and (ii) conservative estimates of errors on the flux densities at each location, which were determined from the fluctuations in the region being averaged. The former is generally much smaller than the latter (see the figure captions and Table 3 ). These error bars, both on spectral indices and flux densities, do not change significantly when we increase or decrease the size of the circles, and they also do not change significantly if we change slightly the position of the circular region.
We have also examined the possibility that (i) the different () coverages, (ii) the negative depression seen around some sources due to undersampling or inadequate deconvolution, and (iii) the image misalignments at two frequencies could produce some systematic errors. Possibility (i) seems unlikely since the GMRT has good () coverage, and sources are only 3 arcmin to 4 arcmin across and are much smaller than the fringe spacing of the shortest baseline lengths, 35 arcmin (100 wavelengths) at 610 MHz and 100 arcmin (35 wavelengths) at 240 MHz. Nevertheless, we investigated this possibility by Fourier transforming some of the 240 MHz CLEAN maps, sampling them with the () coverage of 610 MHz and re-imaging the resulting visibility data sets. The resultant map showed no systematic differences from the original 240 MHz map and the r.m.s. difference in the two maps was less than 4 per cent, corresponding to an r.m.s. error in the spectral index of 0.05. Furthermore, the 240 MHz map of 3C 388 (Fig. 8) shows marginal evidence that this image contains a negative depression around it. In general a negative depression/bowl of this type is due either to inadequate () coverage at short baseline lengths or to inadequate CLEANing. The former is unlikely as explained above, while the CLEANing in our imaging is deep precisely so as to avoid such deconvolution errors. Comparisons of the expected integrated flux density, the total CLEANed flux density and the flux density measured on short baselines suggest that any discrepancy is at most 10 per cent for 3C 388. In any case, we quantify the errors that would be introduced due to possible negative depression for this source below. Both these possibilities, (i) and (ii) are unlikely in case of VLA 1.4 to 1.5 GHz images; this is because of very high sensitivity images with very high signal-to-noise ratio. As for possibility (iii), in the low resolution GMRT images at 240 MHz and 610 MHz, we not only registered the target source, but also registered the positions of at least five field sources around the radio source which were seen in both maps. We estimate that the two GMRT images are typically aligned to better than 1.6 arcsec. In a similar manner, for the high-resolution 1.4 to 1.5 GHz VLA images and the 610 MHz GMRT images, where we could register only the target source, we estimate that the two images are typically aligned to better than 0.6 arcsec. Therefore, we feel confident that our spectral index maps of the sources account well for all possible sources of systematic error.
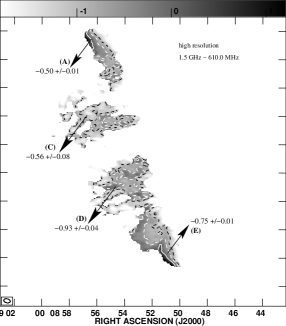
The high-frequency radio structures of the sources in our sample are discussed in numerous papers published in the literature; see e.g. Leahy & Perley (1991, 1995); Leahy et al. (1997); Hardcastle et al. (2007); Evans et al. (2008) for a detailed account of radio morphologies. Since we do not detect any new or remarkable features that need to be reported (morphologically, these sources appear very similar at low and high frequencies, as discussed by Blundell 2008), we present here mainly the spectral results. Analysis of the spectra, shown in Figs. 2 to 9 (upper right and lower right panels), in different regions of each of these objects shows strong variation across the sources. The lighter regions represent relatively steep spectra as compared to the darker regions which represent flat spectra. Although the full range of spectral index is large, we have shown only a small range for clarity in each case. In all our sample sources, we find that in the hotspots/lobes there is monotonic steepening of the radio spectrum from the lobes to the low surface brightness features, a classical spectral signature seen in almost all normal FR II radio galaxies at higher frequencies (Alexander, 1987). Our spectral index measurements across several representative regions within the source are labelled in each spectral index map from Figs. 2 to 9 (upper right and lower right panel maps) and the corresponding flux density values are tabulated in Table 3. In the following subsections we describe the spectral structure of radio sources measured by GMRT for possible features not seen in our 240 MHz radio maps, and comment on any unusual spectral features seen.
3C 33 (z = 0.060)
 |
 |
 |
 |
 |
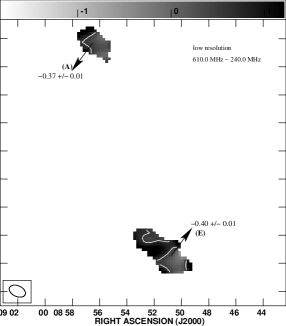 |
The core has a spectral index of 0.00 0.06 between 1.5 GHz and 610 MHz. The 240 MHz map is dynamic range limited, so that we detect only the north and the south hotspots at this frequency.
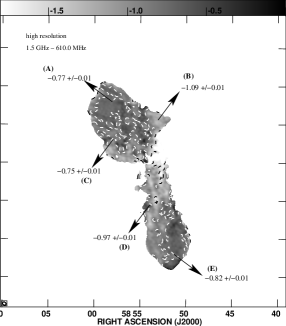
3C 98 (z = 0.031)
 |
 |
 |
 |
 |
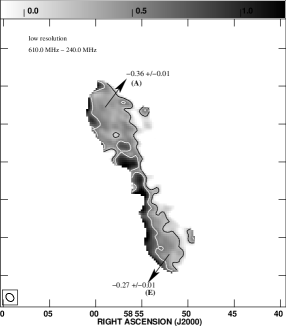 |
The core has a spectral index of 0.69 0.01 between 1.5 GHz and 610 MHz. The spectral index is 0.38 0.03 between 610 MHz and 240 MHz at the location of the core.
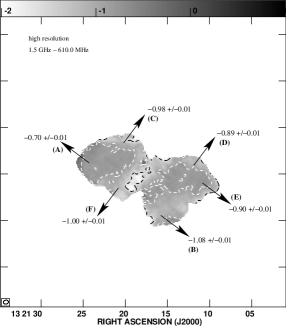
3C 285 (z = 0.079)
 |
 |
 |
 |
 |
 |
The core is relatively steep-spectrum as compared to the two hotspots and has a spectral index of 1.02 0.01 between 1.5 GHz and 610 MHz. Faint features to the North-West of the East lobe and the South-East of the West lobe in the 610 MHz maps are artefacts due to dynamic-range limitations of the data. Though the core is not detected in the 240 MHz maps, the spectral index is 0.80 0.02 at the location of the core between 610 MHz and 240 MHz.
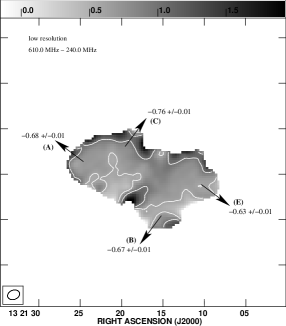
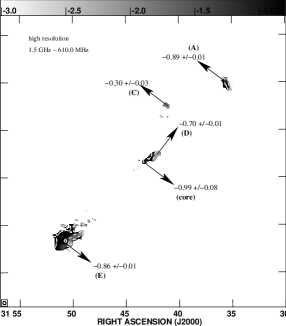
3C 321 (z = 0.100)
 |
 |
 |
 |
 |
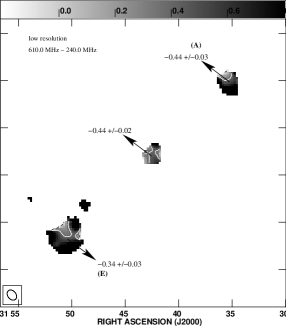 |
The core has a spectral index of 0.99 0.08 between 1.5 GHz and 610 MHz and 0.44 0.02 between 610 MHz and 240 MHz.
This source shows unusual jet radio morphology, which has been suggested to be due to an interaction with the companion galaxy (Evans et al. 2008). The low-surface-brightness feature emanating from the core towards the north surprisingly has an unusual flat spectral index of 0.30 0.03 between 1.5 GHz and 610 MHz. Although this faint feature is undetected in our 240 MHz map, the spectral index between 610 MHz and 240 MHz should be flatter than 1.22 0.21.
3C 382 (z = 0.058)
 |
 |
 |
 |
 |
 |
The core has a spectral index of 0.16 0.01 between 1.5 GHz and 610 MHz. Although, it is not detected in the 240 MHz map, the spectral index is 0.24 0.02 at the location of core between 610 MHz and 240 MHz.
3C 390.3 (z = 0.056)
 |
 |
 |
 |
 |
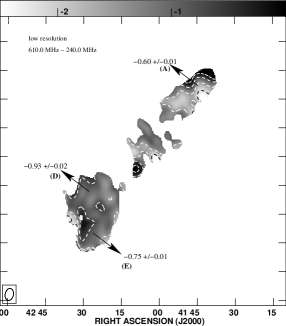 |
Most of the faint features show a steep spectral index, but the faint feature to the north-east has a slightly flat spectral index of 0.64 0.01 between 1.5 GHz and 610 MHz. The core has a spectral index of 0.79 0.01 between 1.5 GHz and 610 MHz. Although the core is unclear in the 240 MHz map, the spectral index is 0.19 0.02 at the location of the core between 610 MHz and 240 MHz.
3C 388 (z = 0.092)
 |
 |
 |
 |
 |
 |
This is the smallest angular sized source in our sample (1 arcmin across) and hence we detect only the two lobes.
3C 452 (z = 0.081)
 |
 |
 |
 |
 |
 |
Although the core is unclear in all our maps, the spectral index is 0.08 0.01, 0.61 0.02 at the location of the core between 1.4 GHz and 610 MHz, and 610 MHz and 240 MHz, respectively.
7 Discussion
The low frequency radio maps presented above show morphologies that are similar to the morphologies at high frequencies (cf. Blundell 2008). Our spectral index mapping and measurement show that in general in these normal FR II radio galaxies we do not find any evidence that low-surface-brightness features have flatter spectral indices than the high-surface-brightness active lobes; this is true even of the weak ‘wings’ seen in sources like 3C 285, 3C 382 and 3C 452, and contrasts with the population of X-shaped sources studied by Lal & Rao (2007).
The one exception to this trend is 3C 321, where a low-surface-brightness feature, very similar to one ‘wing’ of known X-shaped sources, shows a flat spectral index between 610 MHz and 1.5 GHz as compared to the high-surface-brightness lobes. By definition, true X-shaped sources show two symmetrical wings and the wings are of similar angular size to the ‘active’ lobes; marginal differences between two axes, e.g., in 3C 192 and 3C 403, may be due to projection effects. In 3C 321, the ‘wing’ is somewhat smaller than the active lobes, but again this is possibly due to projection. The absence of a corresponding wing on the southern lobe is however harder to account for: from the 1.4 GHz data we estimate that any non-detected wing on this side must be at least 25 times fainter than the detected feature.
If the ‘wing’ of 3C 321’s northern lobe is indeed identical to the ‘wings’ seen in X-shaped radio sources, then its flat spectral index suggests that it may have something in common with the class of X-shaped sources, discussed by Lal & Rao (2007), in which the spectral index of the wing is flatter than that of the active lobe. In this case the Lal & Rao (2007) model, in which the active galaxy consists of two pairs of jets that are associated with two unresolved AGNs, may be a possible model for 3C 321 as well. Consistent with this scenario, Evans et al. (2008) noted that the host galaxy of 3C 321 and the companion galaxy are in the process of merging, and each hosts an AGN that is luminous in the X-ray. However, the two AGNs in this system are resolved in the radio, and only one (the one hosted by the larger galaxy) has a radio detection, implying a current jet; in addition, the one-sided nature of the wing in 3C 321 is hard to explain in this model. Other explanations are possible for the wing. Evans et al. (2008) have shown that the inner radio morphology of the source is atypical for an FR II radio source; a small-scale jet emerges from the nucleus of its host galaxy, produces a knot of radio emission that lies immediately to the south (in projection) of a smaller companion galaxy, and then flares and bends into a diffuse structure towards the north (Evans et al., 2008). Thus it is possible that the peculiar small-scale structure is in some way related to the large-scale wing (although Evans et al. argue that the small-scale disruption of the jet is a transient phenomenon and cannot have been going on for long enough to produce the observed wing). Although the environment of the merging host galaxy is complex and might be expected to produce disrupted lobe structures by purely hydrodynamical processes, this – as with the X-shaped sources – does not in itself explain the anomalously flat spectra found in our analysis.
8 Conclusions
We have presented results from a GMRT and VLA study of a sample of eight nearby FR II radio galaxies that are qualitatively matched with the sample of known X-shaped radio sources in size, morphological properties and redshift. The radio measurements presented here represent most of the database that we require for rigorously testing and understanding the formation models of X-shaped radio sources. Our conclusions from our new observations can be summarised as follows:
-
1.
The radio morphologies of the sample sources at low radio frequencies are largely identical to the morphologies seen at high frequencies using the VLA.
-
2.
In almost all our sample sources we find that in the hotspots and lobes there is monotonic steepening of the radio spectrum from the hotspots to the low surface brightness features, a classical spectral signature seen in almost all normal FR II radio galaxies.
-
3.
The spectral results for FR II radio sources are largely consistent with the spectral results of active lobes in X-shaped radio sources; therefore there is something ‘special’ about the wings of X-shaped sources, in the sense that they do not simply behave like the low-surface-brightness regions of more typical FR II sources.
-
4.
For the hydrodynamic model (Leahy & Williams 1984; Worrall, Birkinshaw & Cameron 1995; Capetti et al. 2002; Kraft et al. 2005) to remain viable in the light of this result, the spectral flattening in the wings must be produced by some other process, such as reacceleration at internal shocks. Detection of shock features in the wings might support the hydrodynamic model. The hydrodynamic model is also faced with the problem of the rotational symmetry of X-shaped radio galaxies (Rottmann, 2001).
-
5.
Since the low surface brightness feature in 3C 321, a classical FR II radio source, also shows unusual spectral behaviour, similar to the spectral behaviour seen in wings in some of the X-shaped sources, it seems that 3C 321 may have some similarity to X-shaped sources.
-
6.
This similarity raises the possibility that 3C 321 consists of two pairs of jets, which are associated with two AGNs, a possible formation model for known X-shaped sources (Lal & Rao, 2007), but this model has some difficulties; there is no completely satisfactory explanation for the ‘wing’ of 3C 321.
Acknowledgments
DVL is grateful to A.P. Rao for discussions and several useful comments. DVL also thanks A.L. Roy for carefully reading the manuscript and for helpful discussions and suggestions. MJH thanks the Royal Society for a research fellowship. We thank the anonymous referee for helpful comments which improved the paper. We also thank the staff of the GMRT who have made these observations possible. GMRT is run by the National Centre for Radio Astrophysics of the Tata Institute of Fundamental Research. The National Radio Astronomy Observatory is a facility of the National Science Foundation operated under cooperative agreement by Associated Universities, Inc. This research has made use of the NASA/IPAC Extragalactic Database, which is operated by the Jet Propulsion Laboratory, Caltech, under contract with the NASA, and NASA’s Astrophysics Data System.
References
- Alexander (1987) Alexander, P., 1987, MNRAS, 225, 27
- Baars et al. (1977) Baars, J.W.M., Genzel, R., Pauliny-Toth, I.I.K., Witzel, A., 1977, A&A, 61, 99
- Becker, White & Edwards (1991) Becker, R.H., White, R.L., Edwards, A.L., 1991, ApJS, 75, 1
- Becker, White & Helfand (1995) Becker, R.H., White, R.L., Helfand, D.J., 1995, ApJ, 450, 559
- Blundell (2008) Blundell, K.M., 2008, arXiv, 0803.0639
- Capetti et al. (2002) Capetti, A., Zamfir, S., Rossi, P., Bodo, G., Zanni, C., Massaglia, S., 2002, A&A, 394, 39
- Cheung (2007) Cheung, C.C., 2007, AJ, 133, 2097
- Colla et al. (1998) Colla, G., Fanti, C., Fanti, R., Gioia, I., Lari, C., Lequeux, J., Lucas, R., Ulrich, M. H., 1975, A&AS, 20, 1
- Dennett-Thorpe et al. (2002) Dennett-Thorpe, J., Scheuer, P.A.G., Laing, R.A., Bridle, A.H., Pooley, G.G., Reich, W., 2002, MNRAS, 330, 609
- Ekers (1969) Ekers, J.A., 1969, AuJPA, 7, 3
- Evans et al. (2008) Evans, D.A., Fong, W.-F., Hardcastle, M.J., Kraft, R.P., Lee, J.C., Worrall, D.M., Birkinshaw, M., Croston, J.H., Muxlow, T.W.B., 2008, ApJ, in press.
- Fanaroff & Riley (1974) Fanaroff, B.L., Riley J.M., 1974, MNRAS, 167, 31P
- Ficarra, Grueff & Tomassetti (1985) Ficarra, A., Grueff, G., Tomassetti, G., 1985, A&AS, 59, 255
- Gopal-Krishna, Biermann & Wiita (2003) Gopal-Krishna, Biermann, P.L., Wiita, P.J., 2003, ApJL, 594, 103
- Hardcastle et al. (1997) Hardcastle, M.J., Alexander, P., Pooley, G.G., Riley, J.M., 1997, MNRAS, 288, 859
- Hardcastle et al. (2002) Hardcastle, M.J., Worrall, D.M., Birkinshaw, M., Laing, R.A., Bridle, A.H., 2002, MNRAS, 334, 182
- Hardcastle et al. (2004) Hardcastle, M.J., Harris, D.E., Worrall, D.M., Birkinshaw, M., 2004, MNRAS, 612, 729
- Hardcastle, Evans & Croston (2007) Hardcastle, M.J., Evans, D.A., Croston, J.H., 2007, MNRAS, 376, 1849
- Hardcastle, Croston & Kraft (2007) Hardcastle, M.J., Croston, J.H., Kraft, R.P., 2007, MNRAS, 669, 893
- Hardcastle et al. (2007) Hardcastle, M.J., Kraft, R.P., Worrall, D.M., Croston, J.H., Evans, D.A., Birkinshaw, M., Murray, S.S., 2007, ApJ, 662, 166
- Högbom (1979) Högbom, J.A., 1979, A&AS, 36, 173
- Jaffe & Perola (1973) Jaffe W.J., Perola G.C., 1973, A&A, 26, 423
- Kaiser & Alexander (1997) Kaiser, C.R., Alexander, P., 1997, MNRAS, 286, 215
- Kaiser & Alexander (1999) Kaiser, C.R., Alexander, P., 1999, MNRAS, 305, 707
- Kellermann, Pauliny-Toth & Williams (1969) Kellermann K.I., Pauliny-Toth, I.I.K., Williams, P.J.S, 1969, ApJ, 157, 1
- Kraft et al. (2005) Kraft, R.P., Hardcastle, M.J., Worrall, D.M., Murray, S.S., 2005, ApJ, 622, 149
- Krause (2007) Krause, M., 2007, New Astronomy Reviews, 51, 174
- Krause (2005) Krause, M., 2005, A&A, 431, 45
- Kuhr et al. (1981) Kuhr, H., Witzel, A., Pauliny-Toth, I.I.K., Nauber, U. 1981, A&AS, 45, 367
- Laing & Peacock (1980) Laing, R.A., Peacock, J.A., 1980, MNRAS, 190, 903
- Lal & Rao (2007) Lal, D.V., Rao, A.P., 2007, MNRAS, 374, 1084
- Lal & Rao (2005) Lal, D.V., Rao, A.P., 2005, MNRAS, 356, 232
- Leahy & Parma (1992) Leahy, J.P., Parma, P., 1992 in Roland, J., Sol, H., Pelletier, G, eds, Extragalactic Radio Sources. From Beams to Jets, Cambridge University Press, p. 307
- Leahy & Williams (1984) Leahy, J.P., Williams, A.G., 1984, MNRAS, 210, 929
- Leahy & Perley (1991) Leahy, J.P., Perley, R.A., 1991 AJ, 102, 537
- Leahy & Perley (1995) Leahy, J.P., Perley, R.A., 1995 MNRAS, 277, 1097
- Leahy et al. (1997) Leahy, J.P., Black, A.R.S., Dennett-Thorpe, J., Hardcastle, M.J., Komissarov, S., Perley, R.A., Riley, J.M., Scheuer, P A.G., 1997, MNRAS, 291, 20
- Mack et al. (1994) Mack, K.-H., Gregorini, L., Parma, P., Klein, U., 1994, A&AS, 103, 157
- Merritt (2004) Merritt, D., 2004, in Coevolution of black holes and Galaxies, Ho., L.C., Ed. (Cambridge Univ Press)
- Merritt & Ekers (2002) Merritt, D., Ekers, R.D., 2002, Sci, 297, 1310
- Parma, Ekers & Fanti (1985) Parma, P., Ekers, R.D., Fanti, R., 1985, A&AS, 59, 511
- Rees (1978) Rees, M.J., 1978, Nat, 275, 516
- Rottmann (2001) Rottmann, H., 2001, PhD thesis, Rheinischen Friedrich-Wilhelms-Univesität Bonn
- Steer, Dewdney & Ito (2003) Steer, D., Dewdney, P., Ito, M., 2003, Sci, 300, 1263
- Swarup et al. (1991) Swarup, G., Ananthakrishnan, S., Kapahi, V.K., Rao, A.P., Subrahmanya, C.R., Kulkarni, V.K., 1991, Cu. Sc., 60, 95
- White & Becker (1992) White, R.L., Becker, R.H., 1992, ApJS, 79, 331
- Worrall, Birkinshaw & Cameron (1995) Worrall, D.M., Birkinshaw, M., Cameron, R.A., 1995, ApJ, 449, 93