DARK MATTER IN THE GALAXY CLUSTER CL J1226+3332 AT
Abstract
We present a weak-lensing analysis of the galaxy cluster CL J1226+3332 at using Hubble Space Telescope Advanced Camera for Surveys images. The cluster is the hottest (keV), most X-ray luminous system at known to date. The relaxed X-ray morphology, as well as its high temperature, is unusual at such a high redshift. Our mass reconstruction shows that on a large scale the dark matter distribution is consistent with a relaxed system with no significant substructures. However, on a small scale the cluster core is resolved into two mass clumps highly correlated with the cluster galaxy distribution. The dominant mass clump lies close to the brightest cluster galaxy whereas the other less massive clump is located ( kpc) to the southwest. Although this secondary mass clump does not show an excess in the X-ray surface brightness, the gas temperature of the region is much higher ( keV) than those of the rest. We propose a scenario in which the less massive system has already passed through the main cluster and the X-ray gas has been stripped during this passage. The elongation of the X-ray peak toward the southwestern mass clump is also supportive of this possibility. We measure significant tangential shears out to the field boundary ( Mpc), which are well described by an Navarro-Frenk-White profile with a concentration parameter of and a scale length of ( kpc) with d.o.f=1.11. Within the spherical volume Mpc, the total mass of the cluster becomes . Our weak-lensing analysis confirms that CL1226+3332 is indeed the most massive cluster known to date at .
1 INTRODUCTION
In the hierarchical structure formation paradigm with cold dark matter (CDM), galaxy clusters grow through multiple mergers between groups and smaller clusters of galaxies. Accordingly, on average galaxy clusters found at higher redshifts should be less massive and more irregular. Despite many unresolved issues in detail on how these structures grow over time, because cluster assembly on a large scale is governed by CDM only subject to gravity, it is possible to quantitatively predict a cluster mass function for a given cosmology at a specific epoch through either analytic approaches or numerical simulations. Therefore, comparison of cluster mass functions today and at high redshift has been a powerful tool in constraining cosmological parameters.
Although large samples of high-redshift clusters have been compiled in the past decade through extensive surveys, the principal ambiguity yet to be resolved is how to relate the measured cluster properties to the mass of the system in a quantitatively robust way. This issue becomes more important for the most massive clusters at high redshifts (). The statistics of these rare systems are extremely sensitive to the matter content () of the universe and its fluctuation (). A historic example is MS1054-0321 (hereafter MS1054), the hottest cluster in the Einstein Medium Sensitivity Survey (EMSS) at . The mere existence of such a massive cluster is thought to be problematic in the universe and has been frequently used as an argument for low values (Bahcall & Fan 1998; Donahue et al. 1998; Jeltema et al. 2001). It is interesting to note, however, that the intracluster medium (ICM) temperature of MS1054 has been debated (Donahue et al. 1998; Jeltema et al. 2001; Joy et al. 2001; Vikhlinin et al. 2002; Tozzi et al. 2003; Gioia et al. 2004; Jee et al. 2005b; Branchesi et al. 2007) and this challenges the mass estimate based on X-ray observations alone. Moreover, the complicated substructures of MS1054 ubiquitously present in optical, X-ray, and weak-lensing observations make the validity of the hydrostatic equilibrium assumption (commonly questioned even for a relaxed system) more open to doubts. However, weak-lensing analyses, which do not depend on the dynamical state of the cluster, from Hubble Space Telescope (HST) Wide Field Planetary Camera 2 (WFPC2) (Hoekstra et al. 2000) and Advanced Camera for Surveys (ACS) (Jee et al. 2005b) show that MS1054 is indeed a massive system at .
Presumably, the galaxy cluster CL J1226.9+3332 (hereafter CL1226) at is much more massive than MS1054. The recent measurements of the X-ray temperature keV and the total X-ray luminosity () of the cluster by Maughan et al. (2007) show that the cluster is the hottest, most luminous system at known to date. These X-ray properties suggest that CL1226 might be perhaps the most massive structure as well; the detailed 3-dimensional mass structure analysis of Maughan et al. (2007) derives an enclosed mass . The relaxed X-ray morphology of the cluster is also remarkable; the cluster’s X-ray surface brightness distribution is symmetric with a single X-ray peak in spatial agreement with the brightest cluster galaxies. This is in stark contrast with the X-ray images of CL0152-0152 (hereafter CL0152; Maughan et al. 2003) and MS1054 (Jeltema et al. 2001). These two high-redshift clusters at a similar redshift of show multiple peaks in their X-ray images indicative of their active stage of formation. Within the hierarchical structure formation paradigm, a virialized structure like CL1226 with such a high mass is extremely rare at , when the age of the universe is less than half its current value.
In this paper, we present a weak-lensing study of CL1226 with HST/ACS images. By analyzing weak distortions of background galaxies behind the cluster, we aim to address the following issues. First, we will examine how the lensing mass compares the X-ray value. Although the analysis of Maughan et al. (2007) using both and XMM- data was careful and certainly more sophisticated than the common isothermal model approach, the X-ray method is by nature still dependent on the validity of the hydrostatic equilibrium assumption. Because the relaxed X-ray morphology of the system supports this hypothesis, it provides an interesting opportunity to compare weak-lensing and X-ray estimates on a fair basis. In addition, Maughan et al. (2007) found that their X-ray mass is % lower than the predicted (Vikhlinin et al. 2006) and (Kravtsov et al. 2006) relation. If the cause of this departure is an on-going merger activity as suggested by Maughan et al. (2007), our weak-lensing mass estimate should improve the cluster’s scaling relation. Second, we will investigate if our two-dimensional mass reconstruction uncovers any substructure not observed in X-rays. In Jee et al. (2005a; 2005b), we witnessed that the weak-lensing mass in CL0152 and MS1054 traces the cluster galaxy distribution very closely whereas the X-ray maps often do not always show the same details. Therefore, it is probable that the weak-lensing analysis of CL1226 might reveal some significant substructures that have not been detected by X-rays. In particular, Maughan et al. (2007) noted that the ICM temperature of the region to the southwest of the X-ray peak is much higher (keV) than the average value ( keV). Although this hot region is correlated with the cluster galaxy distribution, the structure does not stand out in X-ray surface brightness. Perhaps either the mass associated with this galaxy group is not significant enough to produce X-ray overdensity, or the X-ray gas has been stripped in a previous pass-through. Our weak-lensing measurement of the mass of this substructure will allow us to address this question.
Throughout the paper, we use a cosmology. All the quoted uncertainties are at the 1- (68%) level.
2 OBSERVATIONS
2.1 Data Reduction and Object Detection
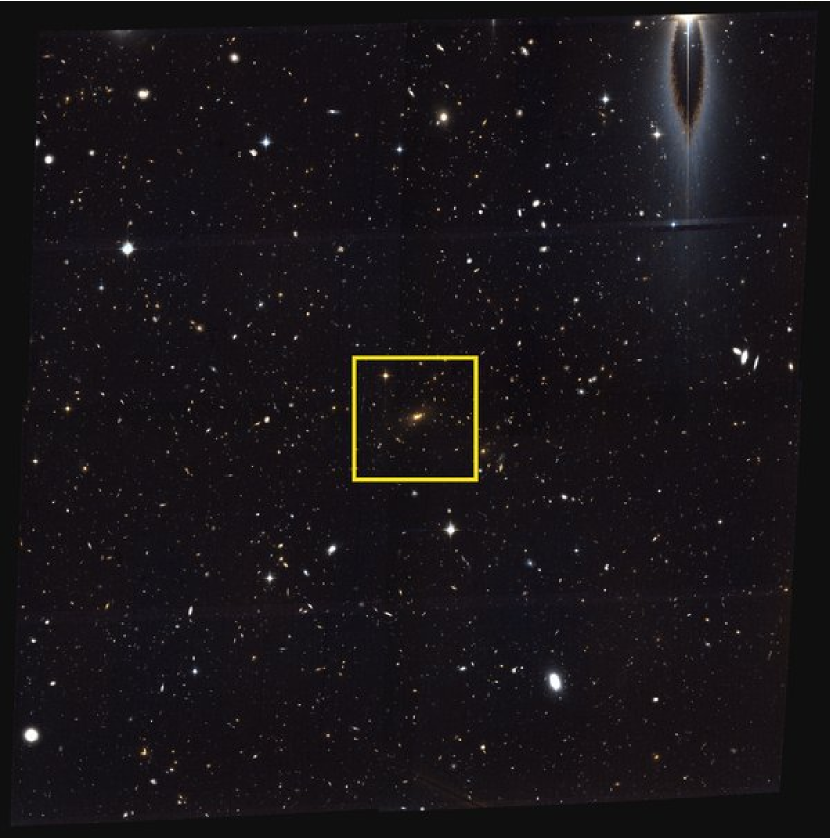
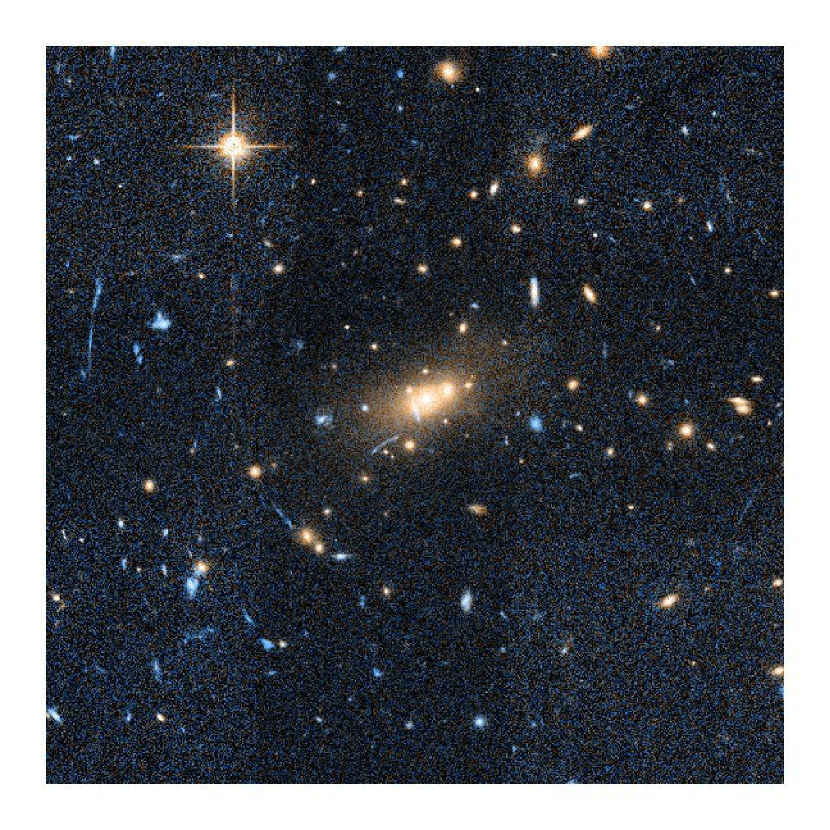
CL1226 was observed with the Wide Field Camera (WFC) of ACS during April 2004 (PROP ID:9033, PI:Harald Ebeling). The cluster was imaged in F606W and F814W (hereafter and , respectively) in a 22 mosaic pattern covering with integrated exposure per pointing of s. We used CALACS (Hack et al. 2003) to perform low level CCD processing and APSIS (Blakeslee et al. 2003) to create final mosaic images. A Lanczos3 kernel (windowed sinc function) with a 0.05 output scale was chosen for drizzling (Fruchter and Hook 2002). This combination of drizzling parameters has been extensively tested in our previous weak-lensing analyses (e.g., Jee et al. 2005a), and provides relatively sharp point spread functions (PSF) with small noise correlations between pixels. The pseudo-color composite of the cluster image is shown in Figure 1. We use the and images to represent the blue and red intensities, respectively, whereas the mean of the two images is used for the green intensity. Figure 1a displays the entire field of the cluster. Approximately, north is up and east is left. The “feather-like” feature near the northwestern corner is attributed to the internal reflection of bright stellar light. The central region marked with a yellow square is magnified in Figure 1b. The cluster red-sequence galaxies are easily identified by their distinct colors. We also observe many blue strongly lensed arc candidates.
We created a separate detection image by weight-averaging the two passband images with their inverse variance maps and SExtractor (Bertin & Arnouts 1996) was run in dual-image mode; objects were detected by searching for at least 5 contiguous pixels above 1.5 times sky rms values in the detection image while photometry is performed on each passband image. We set CLEAN=Y with CLEAN_PARAM=1.2 to let spurious detections around the brightest objects be automatically removed. By visual inspection we identified additional 736 objects that should not be used for weak-lensing. They include stars, diffraction spikes, merged/fragmented objects, missed cosmic rays, stray light near very bright objects, etc. The final catalog contains a total of 11910 objects.
2.2 Source Galaxy Selection
We base our source galaxy selection on the objects’ colors and magnitudes, assuming that a significant fraction of background galaxies are faint () and bluer () than the red-sequence of the cluster. This is a common approach in weak-lensing analyses when limited HST colors are available. Although complementary ground-based observations help us to obtain good photometric redshifts for bright objects [e.g., COSMOS (Scoville et al. 2006) or AEGIS (Davis et al. 2007)], most lensing signals (especially for high-redshift clusters such as CL1226) come from a very faint population, for which it is difficult to obtain reliable, HST PSF-matched colors from the ground.
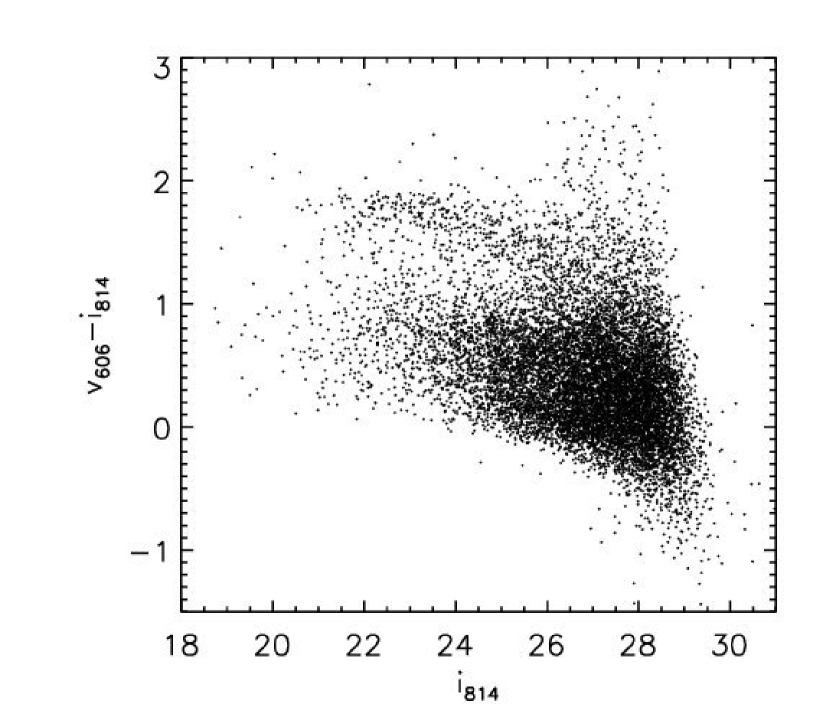
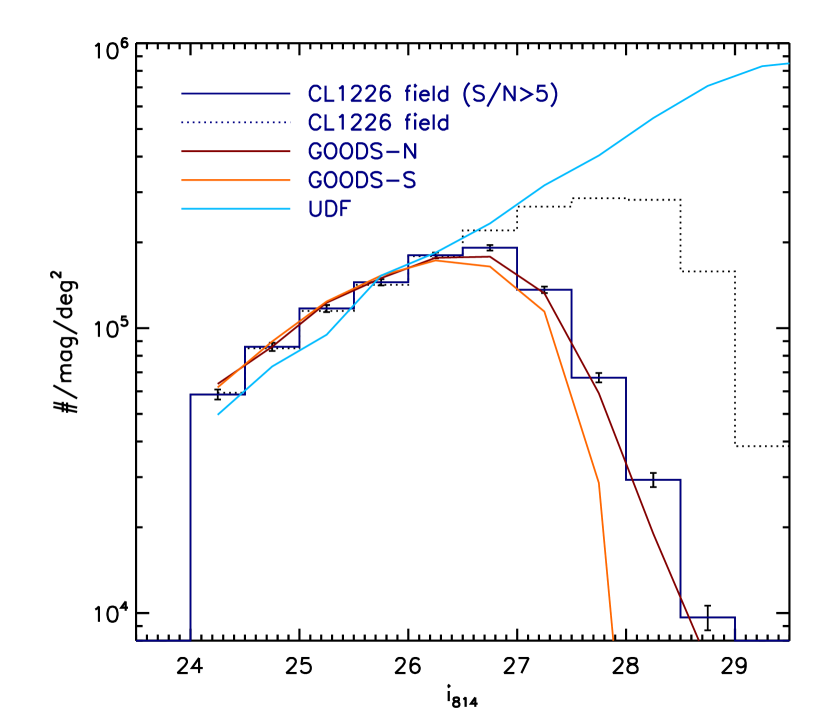
We show the versus color magnitude diagram of CL1226 in Figure 3; we use SExtractor’s MAG_AUTO and MAG_ISO values for magnitudes and colors, respectively. The redshifted 4000 Å break of galaxies at is nicely straddled by the and filters. This makes the cluster galaxies clearly visible at . down to . We define our source population as the and galaxies with ellipticity errors less than 0.2 in one of the two filters (see §2.3 for details on the ellipticity measurement). The resulting number density is (a total of 4745 objects). Considering the high-redshift of the cluster, we suspect that a non-negligible fraction of the cluster members might be bluer than the cluster red-sequence (Butcher & Oemler 1984). Therefore, it is important to estimate how much our source catalog might contain blue cluster members despite the clear presence of the red-sequence. For control fields, we use the Great Observatories Origins Deep Survey (GOODS; Giavalisco et al. 2004) ACS images and the Ultra Deep Field (UDF; Beckwith 2003) ACS images. Because of the large field, the GOODS data serves as a fair comparison sample whereas the UDF data provides good statistics of faint galaxies beyond the detection limit of our cluster observation. The F775W filter (hereafter ) is used in both GOODS and UDF observations instead of the filter. Hence, we transformed colors to colors to maintain the consistency. After selecting galaxies with the same selection criteria ( and ), we compared the magnitude distribution of these surveys with that of the cluster observation (Figure 4). The comparison shows no indication of excess in the cluster field due to the potential blue cluster member contamination. This result is consistent with our results in Jee et al. (2005a; 2005b), where we also examined the possible impact of the blue cluster member contamination to the source catalogs for weak-lensing analyses of the two clusters.
Ellis et al. (2006) studied the color magnitude relation of CL1226 and reported that a low fraction (%) of the 27 spectroscopically confirmed members possess E or S0 early-type morphologies while some galaxies with late-type morphology lie on the color-magnitude relation defined by the early-type galaxies (four galaxies within 0.1 mag in the color magnitude relation). Because the study is based on a small number of bright cluster members (), it is difficult to apply the result to faint magnitudes. Our analysis above shows that the fraction of the blue cluster members is negligibly small at least for the population selected by the ( and ) criteria.
Now with the source catalog at hand, we need to estimate the redshift distribution in order to put our subsequent lensing analyses on the proper scale. We utilize the publicly available photometric redshift catalog of the UDF (Coe et al. 2006). The UDF covers a small area (though twice as large as the Hubble Deep Field), but thanks to the unprecedented depth of HST-based observations in the , , , , , and filters, it provides high-fidelity photometric redshifts for the galaxies beyond the limiting magnitudes of the CL1226 data. To account for different depth between the cluster field and UDF, we estimate the redshift distribution per each magnitude bin and correct for the difference in the normalized number density. The resulting mean redshift of the source population is determined to be . Of course, this value should not be confused with the effective redshift of the source population because objects at redshifts smaller than the cluster redshift dilute the signal. In fact, in weak-lensing studies this lensing efficiency is expressed in terms of :
| (1) |
where and are the angular diameter distance from the observer to the source and from the lens to the source, respectively. We obtain for the given cosmology, which corresponds to . Another important quantity that affects our subsequent lensing analysis is the width of the redshift distribution, which is often expressed in terms of . Seitz & Schneider (1997) found that under a single redshift source plane assumption the measured shear is overestimated by
| (2) |
For the current source population, we obtain and therefore the measured shear is overestimated by . This correction becomes increasingly important with lens redshift and should be included in high-redshift cluster lensing analyses.
2.3 PSF Modeling and Ellipticity Measurements
Weak-lensing measures a subtle distortion of background galaxy images and therefore it is important to remove any instrumental effect, which can mimic gravitational lensing signals. When geometric distortion and image registration are done carefully, the most important remaining task is PSF modeling. Because anisotropic PSF can induce a false lensing signal and the impact becomes greater for fainter galaxies, which contain more signal, a great amount of efforts and time is invested on studying the PSF of any instrument before a signal is extracted.
Although the ACS PSF is far smaller than what one can achieve from the ground, it still measurably affects the shapes of objects whose sizes at the surface brightness limit are comparable to the PSF. This places great importance on deep imaging (larger size at low surface brightness) and good understanding of the PSF variations. It has been known that ACS PSFs vary in a complex way with time and position (Krist 2003; Jee et al. 2005a; Sirianni et al. 2005). In Jee et al. (2007b), we presented a principal component analysis of the ACS PSF and made the ACS PSF library publicly available based on archival ACS images of stellar fields. In this work, we use the PSF library of Jee et al. (2007b) to model the PSF variation in the CL1226 field. Those who are interested in the method in detail are referred to the paper. Below we briefly describe the procedure and the result specific for our cluster analysis.
We first derive a PSF model for an individual exposure and then shift/rotate the model PSFs with respect to the final mosaic image in a similar way to our image registration procedure. In each exposure, there are typically 8-15 high S/N stars available, which can be used to find the best-matching template from the library. The final PSFs are the results of stacking all the contributing PSFs. In Figure 5 we show the comparison of the observed PSFs with the modeled ones (similar results are obtained for the PSFs). The PSF model () obtained in this way closely resembles the observed pattern (). The versus plot (right) shows that both the centroid and the dispersion of the observed points (diamond) are significantly improved in the residuals (‘+’ symbol). The centroid and dispersion of the residuals are and , respectively.
We determine object ellipticities by fitting a PSF-convolved elliptical Gaussian to the images. In theory, this is equivalent to the method proposed by Bernstein & Jarvis (2002) although the implementation is different. Instead of fitting an elliptical Gaussian to an object, they shear the object progressively until it fits a Gaussian. This scheme is conveniently implemented by first decomposing galaxy shapes with shapelets (Bernstein & Jarvis 2002; Refregier 2003) and then by applying shear operators to the shapelet coefficients until the object’s quadrupole moments disappear. We adopt the method in our previous analysis (Jee et al. 2005a; 2005b; 2006). We noted in Jee et al. (2007a) however that directly fitting an elliptical Gaussian to the pixelized object reduces aliasing compared to the shapelet formalism, particularly when the object has extended features. The issue was important in Jee et al. (2007a) because the lens was a low-redshift strong-lensing cluster. The ellipticities of the strongly lensed arc(let)s were substantially underestimated if the shapelet formalism is employed. Although the CL1226 cluster images do not show such a large number of arc(let)s, we use the same pipeline of Jee et al. (2007a) in the current analysis. Fitting a PSF-convolved elliptical Gaussian to pixelated images is more numerically stable for faint objects, and also provides straight-forward error estimates in the results. Because we have two passband images available, the finalcombined ellipticities of objects are given as weighted averages.
Figure 6 displays the ellipticity distribution of non-stellar objects in the cluster field. We only include the objects with a S/N or greater at least in one passband. The ellipticity distribution of the 111 represents a half light radius. objects is slightly affected after PSF correction (Figure 6a) whereas the change is significant for smaller () objects (Figure 6b). Note that much of the useful lensing signal comes from this “small” galaxy population (only slightly larger than the instrument PSFs ) for high-redshift clusters. This illustrates that that, even if ACS PSFs are small, one must carefully account for their effects to maximize the full resolving power of ACS.
A potentially important factor in determining object shapes in addition to the PSF correction discussed above is the charge transfer efficiency (CTE) degradation of ACS. Riess and Mack (2004) reported strong evidence for photometric losses in the parallel direction for ACS. Rhodes et al. (2007) studied the CTE-induced charge elongation in the context of weak-lensing studies and established an empirical prescription, where the strength of the elongation is proportional to 1) the distance from the read-out register, 2) the observation time, and 3) the inverse of the S/N of objects. When we assume that equation 10 of Rhodes et al. (2007) is also applicable to the current data, we obtain for the faintest object that is also farthest from the read-out register; on average however for all sources throughout the entire field the required correction is . Hence, the CTE-induced elongation is much smaller than the weak-lensing signal of the cluster and the statistical noise (object ellipticity dispersion) to the extent that the effect can be safely ignored in our subsequent analysis. Heymans et al. (2008) obtained a similar result in their weak-lensing study of the Abell 901/902 supercluster whose ACS data were taken about 1 year after CL1226 was observed. We are also investigating the CTE-induced elongation issue independently by analyzing cosmic-rays. Because cosmic-rays are not affected by the instrument PSF, their study enables us to nicely separate the PSF effect from the CTE degradation effect. Our preliminary result is consistent with that of Rhodes et al. (2007) in the sense that the required correction is negligibly small for the current observation. We will present our result of the CTE-induced elongation study elsewhere along with our future publication of the weak-lensing analysis of the cluster XMMU J2235.3-2557 (M. Jee et al. in preparation), whose ACS data were taken in the 2005-2006 years and thus are potentially subject to greater bias due to the CTE degradation.
3 WEAK-LENSING ANALYSIS
3.1 Two-Dimensional Mass Reconstruction
One of the easiest ways to visually identify the presence of a lensing signal is to plot a smoothed two-dimensional distribution of the source galaxies’ ellipticity. Massive clusters shear shapes of background galaxies in such a way that they appear on average tangentially aligned toward the center of the clusters. In Figure 7 we present this so-called “whisker” plot obtained by smoothing the source galaxy ellipticity map with a FWHM= Gaussian kernel. As in the case of Figure 5, the length and the orientation of the sticks represent the magnitude and the direction of the weighted mean ellipticity, respectively. An ellipticity with a magnitude of is shown at the top with a circle for comparison. The tangential alignment around the center of the cluster (the location of the BCG) is clear.
Many algorithms exist for the conversion of this ellipticity map to the mass density map of the cluster. Due to its simplicity, the classic method of Kaiser & Squires (1993; hereafter KS93) or the real-space version (Fischer & Tyson 1997) still is widely used. The KS93 method is based on the notion that the measured shear is related to the dimensionless mass density by the following convolution:
| (3) |
where is the complex conjugate of the convolution kernel . The method assumes that the shear is directly measurable whereas in fact it is the reduced shear that we can measure directly. Obviously, in the region where is small, the assumption is valid. However, near cluster centers, is often much greater than , and this leads to overestimation of . In addition, it is not straightforward to incorporate measurement errors (i.e., ellipticity errors and shear uncertainties) or priors in the KS93 scheme. Because measured shears in cluster outskirts have much lower significance, the algorithm frequently produces various noise peaks when the smoothing scheme is optimized to reveal significant structures in the cluster center.
These pitfalls are overcome in the new methods such as Marshall et al. (2002) and Seitz et al. (1998), where individual galaxy shapes (not averaged shears) are used and the resulting mass map is regularized. In the current paper, we used the mass reconstruction code of Jee et al. (2007a), who modified the method of Seitz et al. (1998) so that strong-lensing constraints are incorporated. For the current mass reconstruction of CL1226, however, we turned off the strong-lensing capability of the software and utilized only the weak-lensing data.
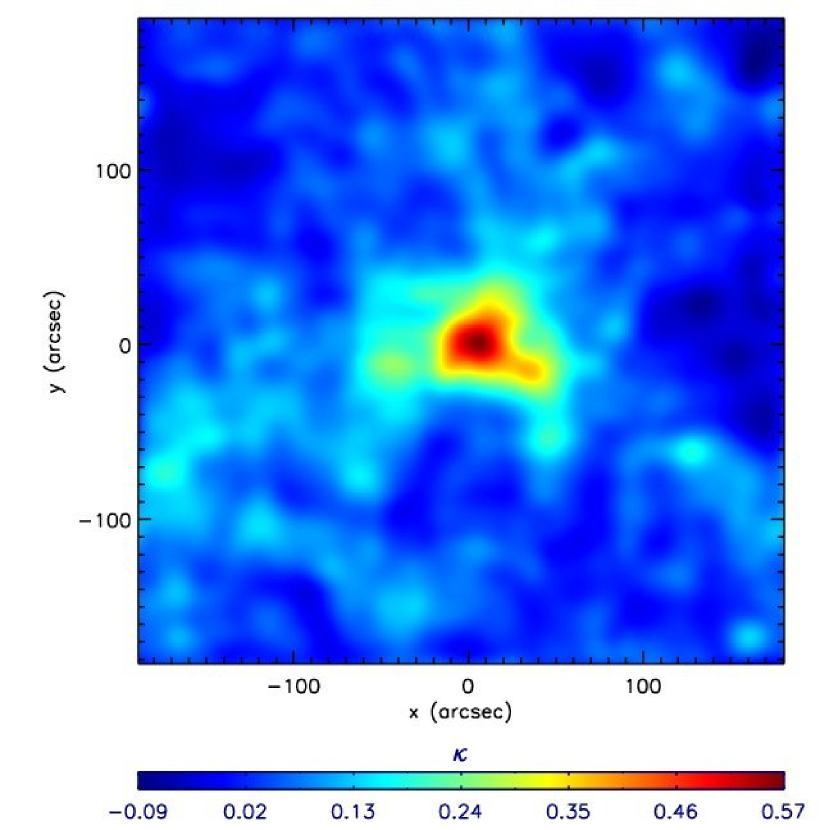
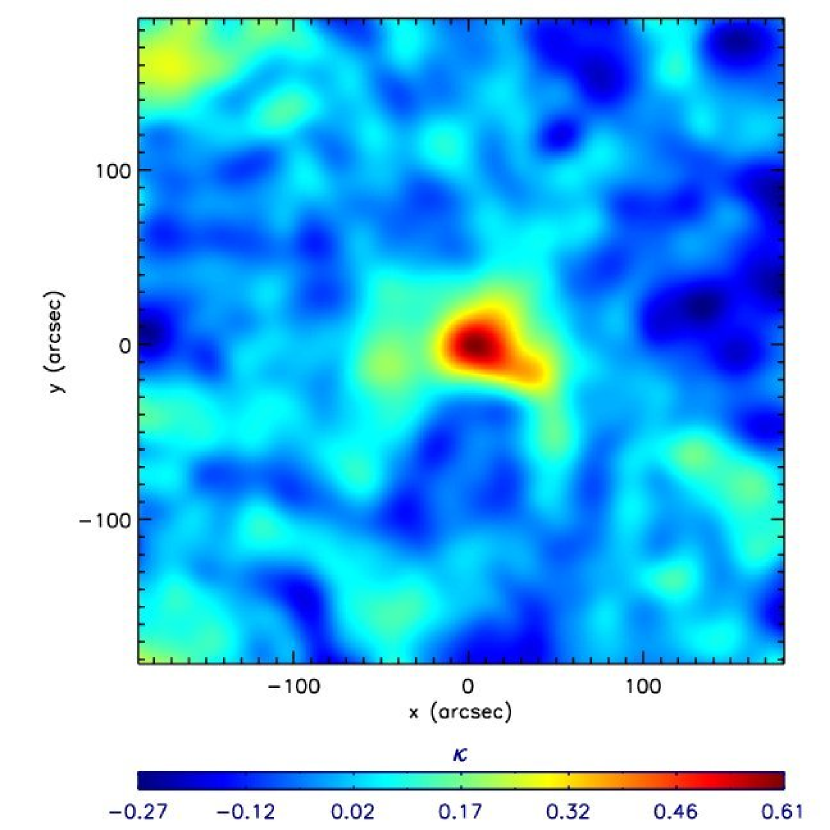
We present our maximum-entropy mass reconstruction of CL1226 in the left panel of Figure 8. For comparison, we also display the result obtained by the conventional KS93 algorithm in the right panel. For the KS93 method we choose a smoothing scale of FWHM. The regularization parameter of Jee et al. (2007a) was adjusted in such a way that the result matches the resolution of the KS93 version at . Both mass reconstructions clearly reveal the strong dark matter concentration in the cluster center. However, in the relatively low region the KS93 algorithm produces many spurious substructures, most of which do not stand out in the maximum-entropy reconstruction. It is certain that both the inadequate (too small kernel) smoothing and the approximation of the KS93 algorithm are the causes of the artifacts. Therefore, our interpretation hereafter is based on the result from our maximum-entropy reconstruction.
On a large scale the field shows that the cluster does not possess any significant substructure. This relaxed appearance is also indicated by the X-ray emission from the cluster (Maughan et al. 2007). However, this symmetric mass distribution is somewhat unusual for a cluster at such a high redshift. In our current hierarchical structure formation paradigm, relaxed clusters are thought to be rare at , when the universe is at less than half its current age. Our previous weak-lensing analysis of CL0152 and MS1054 (both at ) revealed significant substructures composed of several mass clumps suggestive of the active formation of the systems.
On a small scale, however, our mass reconstruction resolves the core into two mass clumps, which are separated by (Figure 9a). Comparing the projected masses within , we estimate that the mass ratio of the two substructures is approximately 3:2. The more massive mass clump [] is located near the brightest cluster galaxy, which is also close to the center of the X-ray peak (Figure 9b). The less massive structure [] to the southwest is however not detected in the X-ray surface brightness although we note that the contours near the X-ray peak are slightly elongated toward this secondary mass clump. Because the mass of this structure is significant and comparable to that of the western mass peak (the most massive among the three) of MS1054, the apparent absence of the gas overdensity associated with the structure is counter-intuitive. The weak-lensing mass structure is nevertheless highly consistent with the cluster red-sequence distribution. We display the number density contours of the cluster red-sequence in Figure 9c. The secondary mass clump is in good spatial agreement with the cluster red-sequence. Interestingly, Maughan et al. (2007) found that the gas temperature of the region is much higher ( keV) than those of the rest [see Figure 9d where we overplot the mass contours on top of the temperature map of Maughan et al. (2007)]. They suggested that this temperature structure might relate to the possible on-going merger indicated by the cluster galaxy distribution and we agree. Our detailed discussion on the comparison between the mass, X-ray intensity, gas temperature, and galaxy distributions is deferred to §4.2.
3.2 Tangential Shear, Cosmic Shear Effect and Mass Estimation
In addition to the two-dimensional mass reconstruction discussed previously, tangential shear is also a useful measure of total lensing mass. By taking azimuthal averages, one can lower the effect of shot noise and more easily determine the presence of the lensing than in the two-dimensional analysis particularly when the signal is weak. Therefore, many authors prefer to use tangential shear profiles in the estimation of cluster masses assuming an azimuthal symmetry. In the current paper, we present the tangential shear profile of CL1226 first, and then estimate the mass based on the profile. Finally, we also compute the mass using the two-dimensional mass map and compare the results.
Tangential shear is defined as
| (4) |
where is the position angle of the object with respect to the lens center, and is a reduced shear ; true shears and are related to the lensing potential by and . If no lensing is present, the reduced tangential shear must be consistent with zero. The filled circles in Figure 10 show the reduced tangential shears of CL1226 centered on the BCG. The lensing signal from the cluster is clear out to the field limit; we note that at we cannot complete a circle. The observed reduced shears at decrease monotonically with radius. This is in accordance with the mass map of the cluster discussed in § 3.1, which shows no major asymmetric substructures outside the main clump. The diamond symbols represent our measurement of tangential shear when the background galaxies are rotated by 45. This test shows that the B-mode signal is consistent with zero as expected.
The error bars in Figure 10 include only the statistical uncertainties determined by the finite number of source galaxies in each radial bin. Hoekstra (2003) demonstrated that background structures (cosmic shear effects) are important sources of uncertainties and need to be considered in cluster mass estimation. Following the formalism of Hoekstra (2003), we evaluated the background structure effect on the uncertainties in the tangential shear measurements. The solid line in Figure 11 displays the predicted errors for the redshift distribution of the source population in the current cosmology. For comparison, we approximately reproduce here the prediction of Hoekstra (2003) for their sample (, dashed). Note that the cosmic shear effect is substantially (%) higher in our sample because the mean redshift of our source population is also significantly higher (). However, in the region, where we measure our tangential shears for CL1226, the errors induced by the cosmic shear are still lower than the statistical errors (‘+’ symbol) and thus the effect is minor in our cluster mass estimation Nevertheless, in the following analysis, we include this cosmic shear effect in the quoted errors.
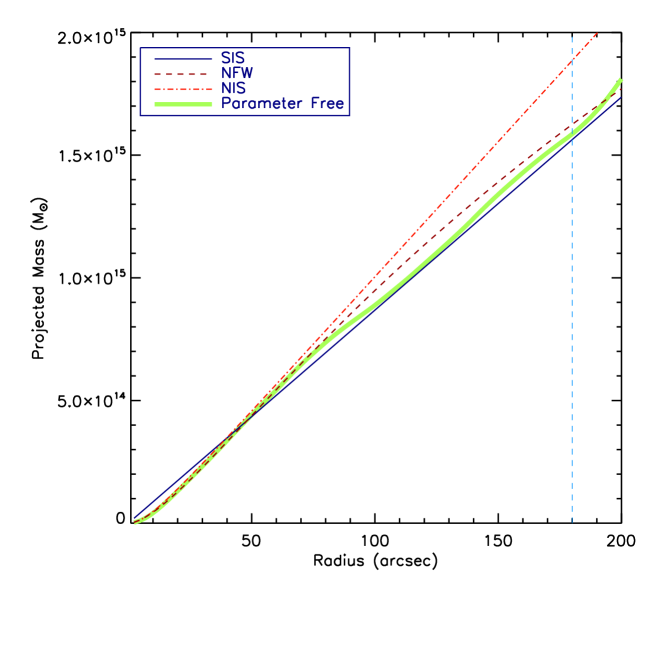
We characterize the reduced tangential shears with three parametric models: singular isothermal sphere (SIS), Navarro-Frenk-White (NFW; Navarro et al. 1997), and non-singular isothermal sphere (NIS). In these parametric fits, we use all the data points in Figure 10 unlike the cases of Jee et al. (2005a; 2005b), where we excluded a few tangential shear values near the cluster core to avoid the possible effects of the apparent substructure and blue cluster galaxy contamination. In the current cluster, however, both effects appear to be minor and smaller than the statistical uncertainties. The SIS fit results in the Einstein radius of the cluster (d.o.f=3.61) With (§2.2), the implied velocity dispersion is . Assuming energy equi-partition between gas and dark matter, we can also convert this velocity dispersion to the lower limit of the gas temperature keV. Although the SIS model is in general a good description of cluster mass profiles at small radii, numerical simulations show that the mass density of relaxed clusters at large radii should drop faster than . Also, near the cluster core it is believed that the density profile is less steep than . Therefore, modified density profiles such as an NFW model are a preferred choice over the traditional SIS in the description of cluster mass profiles. For the NFW fit, we obtain ( kpc) and (d.o.f=1.11). The comparison of the reduced values and the best-fit results in Figure 10 show that the cluster’s reduced tangential shear is better described by this NFW model. The large reduced value of the SIS fitting is mainly due to the fact that the observed tangential shear does not rise as steeply as the SIS prediction at . If we assume a non-singular core instead [NIS; i.e., ], the discrepancy is substantially reduced, and we obtain ( kpc) and with /d.o.f=0.77.
We compare the projected mass profiles estimated from these results in Figure 12. Also plotted is the result based on the two-dimensional mass map of the cluster, for which we lifted the mass-sheet degeneracy by constraining to be the same as the value given by the NFW result. The discrepancy from difference approaches is small over the entire range of the radii shown here except for the NIS model, which, although similar to the other results at small radii (), gives substantially higher masses at large radii (e.g., higher at ). Because the behavior of the NIS model at large radii is unrealistic (despite its smallest goodness-of-fit value), we do not consider the result as representative of the overall cluster mass profile. Error bars are omitted to avoid clutter in Figure 12. For the SIS result, the mass uncertainties are % (after we rescale with the reduced value) over the entire range. The uncertainty in the NFW mass non-uniformly increases with radii: approximately 5%, 10%, and 15% of the total mass at , and .
4 DISCUSSION
4.1 Comparison with Other Studies
The X-ray temperature of CL1226 was first measured by Cagnoni et al. (2001) based on short exposure ( ks) data. They obtained an X-ray temperature of keV, a index of , and a core radius of . With an isothermal model assumption, their measurement gives a projected (within a cylindrical volume) mass of , which is consistent with our result. Joy et al. (2001) used Sunyaev-Zeldovich effect (SZE) observations and determined the mass of the cluster to be with a SZE temperature of keV. This SZE result is also in accordance with our lensing estimate. With XMM-Newton observations, Maughan et al. (2004) derived a virial mass of within Mpc. Our NFW fitting results gives Mpc and , which are in excellent agreement with the result of Maughan et al. (2004). Maughan et al. (2007) refined their early study of CL1226 by using both deep XMM-Newton and Chandra observations. From the comprehensive analysis of the cluster’s three-dimensional gas and temperature structure, they obtained Mpc and . The new mass is, however, % lower than our lensing estimate . This mass discrepancy is interesting because Maughan et al. (2007) noted that their mass is % below the relation (Vikhlinin et al. 2006) and also the relation (Kravtsov et al. 2006). They suggested the possibility that the on-going merger indicated by their temperature map may lead to the underestimation of the total mass with X-ray methods. Our mass reconstruction resolves the cluster core substructure and supports the merger scenario. If the merger is indeed responsible for the underestimation from the X-ray analysis, the apparent improvement in the relation with the lensing estimate highlights the merits of gravitational lensing for mass estimation, which does not depend on the dynamical state of the system.
4.2 Stage of the Merger in the Core of CL1226
Galaxy cluster cores frequently possess merging signatures despite their relaxed morphology on a large scale. Even the Coma Cluster, long regarded as the archetype of relaxed clusters, has been found to be composed of many interesting substructures by X-ray and optical observations (e.g., Biviano et al. 1996). Several lines of evidence strongly suggest that the cluster CL1226 is also undergoing an active merger in the cluster core. First, the cluster galaxy distribution is bimodal in the core; the dominant number density peak is close to the X-ray center and the other overdensity is seen to the southwest. Second, the X-ray temperature map shows that the ICM near this southwestern number density peak is significantly higher ( keV) than in the neighboring region. Although this high-temperature region does not stand out in the X-ray surface brightness map, which reveals only a single peak in spatial agreement with the dominant galaxy number density peak, a scrutiny of both the and the images shows that the contours near the X-ray peak is slightly elongated toward the high-temperature region. Third, our weak-lensing analysis confirms that a substantial mass is associated with this southwestern galaxy number density peak. Therefore, it is plausible that the hydrodynamic interaction between the two substructures is responsible for the high temperature ( keV) feature.
It is puzzling that the southwestern weak-lensing mass clump is not detected in the X-ray surface brightness. As mentioned in §3.1, the mass of this substructure is comparable to that of the western weak-lensing mass peak of MS1054, which is the most massive of the three dominant peaks of the cluster and has its own distinct X-ray peak. As a possible cause, we suggest the possibility that the substructure has passed through the other more massive structure from the eastern side. If it is a slow encounter, the gas of the system could be severely stripped during this penetration. A shock, on the other hand, can propagate ahead of the gas core and leave trails of hot temperature as observed in the current case. Of course, the collisionless galaxies and dark matter of the system are expected to survive the core passthrough as observed unlike the gas system. A famous example is the “bullet” cluster 1E0657-56 at (Clowe et al. 2006; Bradac et al. 2006).
We noticed a very similar case in our weak-lensing and X-ray study of MS1054 (Jee et al. 2005b). The eastern substructure of MS1054, whose presence is clear both in the cluster galaxy and dark matter distribution, is conspicuously absent in the X-ray observations. Moreover, the MS1054 temperature map of Jee et al. (2005b) shows that the gas in the region of the eastern halo is notably higher ( keV) than the average temperature ( keV). Hence in Jee et al. (2005b) we proposed that the cluster galaxies now observed in the eastern mass clumps might have passed through the central mass clump from the southwest. Intriguingly, a significant fraction of the star forming galaxies (four out of the five brightest IR galaxies) are found to exist near the eastern mass clump of MS1054 (Bai et al. 2007). The result can be interpreted as indicating a recent star formation triggered by this hypothesized merger. Although we have not performed a parallel study for the star-formation properties of the CL1226 galaxies yet, the existing features in the X-ray surface brightness, gas temperature, mass, and galaxy distribution is suggestive of the similar merger scenario.
Is the above post-merger picture the unique scenario that explains the observed features? If the peculiar temperature structure of CL1226 were absent or we can attribute it to something else, one can also consider the possibility that the secondary mass clump might not be massive enough to produce X-ray emission, but still detected in weak-lensing simply because it forms a line-of-sight superposition with the already massive dark matter halo of the primary cluster. Obviously, in this hypothesized configuration the background density can boost the lensing signal even if the mass of the southwestern clump by itself is not significant. To explore this possibility quantitatively, we estimated the expected X-ray temperature of the secondary clump for this scenario in the following way. First, we created a new radial density profile of the main cluster from the mass map by excluding the azimuthal range that contains the southewestern substructure. Second, we subtracted this new radial density profile from the original mass map. Finally, we measured the mass of the secondary clump from this subtracted mass map. Of course, this procedure overestimates the contribution (i.e., boosting effect) of the primary cluster because, even if we avoided the southwestern region in the creation of the new radial profile, the value in the other azimuthal range is still the sum of the two subclusters. Hence, here we assume an extreme case, where the primary cluster is dominant in mass. Then, within ( kpc), the total projected mass of the secondary cluster would be . Assuming isothermality with , this mass is translated into keV. Given the depth ( ks for each detector) of the observation, a subcluster with this cool core would have been easily identified in the image of CL1226 (Maughan et al. 2007). Even for the relatively shallow data ( ks when the two datasets ObsID 3180 and 5014 are combined), we predict counts within a aperture, which would give a significance of . Therefore, even if we disregard the temperature structure, we are not likely to be observing a very low mass cluster whose lensing efficiency is enhanced due to the primary cluster halo.
5 SUMMARY AND CONCLUSIONS
We have presented a weak-lensing study of the galaxy cluster CL1226 at . The cluster is a very interesting, rare system because, despite its high redshift, it has a relaxed morphology in X-ray surface brightness and an unusually high gas temperature. Our HST/ACS-based weak-lensing analysis of the cluster provides the dark matter distribution in unprecedented detail and allows us to measure the mass profiles out to the virial radius of the cluster.
Our two-dimensional mass reconstruction shows that on large scales the dark matter distribution is consistent with a relaxed system with no significant substructures. However, viewed in detail, the cluster core is resolved into two mass clumps. This bimodality of the core mass structure is also seen in the cluster galaxy distribution. The dominant mass clump lies close to the BCG whereas the other less massive one is located to the southwest. This secondary mass clump does not stand out in the X-ray surface brightness although the temperature of the region is much higher than in the rest of the cluster. When the significant mass associated with the substructure is considered, the absence of the corresponding X-ray excess in the region is puzzling. Therefore, we propose that we may be observing the system after the less massive subcluster passed through the main cluster. It is possible that the X-ray gas of the less massive system might have been stripped due to the ram pressure. The slight elongation of the X-ray peak toward the southwestern mass clump is also supportive of this scenario. These features are similar to the ones that we observed in MS1054, another massive galaxy cluster at , where we proposed a similar possibility.
We measure significant shear signals out to the field boundary (), which indicates that the cluster is indeed massive as already implied by its high X-ray temperature. Fitting an NFW profile to the reduced tangential shears gives Mpc and , where the error bars include both statistical and cosmic-shear induced systematic uncertainties. Although the predicted velocity dispersion and X-ray temperature from the lensing result are consistent with previous work, our cluster mass is % higher than the recent XMM- and analysis of Maughan et al. (2007), who interestingly pointed out that their mass estimate is % below the and scaling relations. If the on-going merger is indeed the cause of the underestimation of the total mass with the X-ray method (Maughan et al. 2007), the apparent improvement in the relation with the lensing estimate highlights the advantages of gravitational lensing for mass estimation, which does not depend on the dynamical state of the system.
Our weak-lensing study confirms that CL1226 is indeed the most massive cluster at known to date. In the hierarchical structure formation paradigm, a CL1226-like cluster is extremely rare at . Because the abundance of such a massive system is sensitive to the matter density () and its fluctuation (), the current result and future lensing measurements of other high-redshift massive clusters [e.g., XMMU J2235.3-2557 at (Mullis et al. 2005) and XCS J2215.9-1738 at (Stanford et al. 2006; Hilton et al. 2007) ] will provide useful constraints on the normalization of the power spectrum.
M. James Jee acknowledges support for the current research from the TABASGO foundation presented in the form of the Large Synoptic Survey Telescope Cosmology Fellowship. We thank Ben Maughan for allowing us to use his X-ray temperature map of CL1226.
References
- Bahcall & Fan (1998) Bahcall, N. A. & Fan, X. 1998, ApJ, 504, 1
- Bai et al. (2007) Bai, L., et al. 2007, ApJ, 664, 181
- Beckwith, Somerville, & Stiavelli (2003) Beckwith, S., Somerville, R., Stiavelli M., 2003, STScI Newsletter vol 20 issue 04
- Blakeslee et al. (2003) Blakeslee, J. P., Anderson, K. R., Meurer, G. R., Benítez, N., & Magee, D. 2003, ASP Conf. Ser. 295: Astronomical Data Analysis Software and Systems XII, 12, 257
- Bernstein & Jarvis (2002) Bernstein, G. M. & Jarvis, M. 2002, AJ, 123, 583
- Bertin & Arnouts (1996) Bertin, E., & Arnouts, S. 1996, A&AS, 117, 393
- Biviano et al. (1996) Biviano, A., Durret, F., Gerbal, D., Le Fevre, O., Lobo, C., Mazure, A., & Slezak, E. 1996, A&A, 311, 95
- Bradač et al. (2006) Bradač, M., et al. 2006, ApJ, 652, 937
- Branchesi et al. (2007) Branchesi, M., Gioia, I. M., Fanti, C., & Fanti, R. 2007, A&A, 472, 727
- Butcher & Oemler (1984) Butcher, H., & Oemler, A., Jr. 1984, ApJ, 285, 426
- Cagnoni et al. (2001) Cagnoni, I., Elvis, M., Kim, D.-W., Mazzotta, P., Huang, J.-S., & Celotti, A. 2001, ApJ, 560, 86
- Clowe et al. (2006) Clowe, D., Bradač, M., Gonzalez, A. H., Markevitch, M., Randall, S. W., Jones, C., & Zaritsky, D. 2006, ApJ, 648, L109
- Coe et al. (2006) Coe, D., Benítez, N., Sánchez, S. F., Jee, M., Bouwens, R., & Ford, H. 2006, AJ, 132, 926
- Davis et al. (2007) Davis, M., et al. 2007, ApJ, 660, L1
- Donahue et al. (1998) Donahue, M., Voit, G. M., Gioia, I., Lupino, G., Hughes, J. P., & Stocke, J. T. 1998, ApJ, 502, 550
- Ellis et al. (2006) Ellis, S. C., Jones, L. R., Donovan, D., Ebeling, H., & Khosroshahi, H. G. 2006, MNRAS, 368, 769
- Fischer & Tyson (1997) Fischer, P., & Tyson, J. A. 1997, AJ, 114, 14
- Fruchter & Hook (2002) Fruchter, A. S., & Hook, R. N. 2002, PASP, 114, 144
- Gao et al. (2007) Gao, L., Navarro, J. F., Cole, S., Frenk, C., White, S. D. M., Springel, V., Jenkins, A., & Neto, A. F. 2007, ArXiv e-prints, 711, arXiv:0711.0746
- Giavalisco et al. (2004) Giavalisco, M., et al. 2004, ApJ, 600, L93
- Gioia et al. (2004) Gioia, I. M., Braito, V., Branchesi, M., Della Ceca, R., Maccacaro, T., & Tran, K.-V. 2004, A&A, 419, 517
- Hack et al. (2003) Hack, W., Busko, I., & Jedrzejewski, R. 2003, ASP Conf. Ser. 295: Astronomical Data Analysis Software and Systems XII, 295, 453
- Hoekstra, Franx, & Kuijken (2000) Hoekstra, H., Franx, M., & Kuijken, K. 2000,ApJ, 532, 88
- Hoekstra (2003) Hoekstra, H. 2003, MNRAS, 339, 1155
- Jee et al. (2005a) Jee, M. J., White, R. L., Benítez, N., Ford, H. C., Blakeslee, J. P., Rosati, P., Demarco, R., & Illingworth, G. D. 2005a, ApJ, 618, 46
- Jee et al. (2005b) Jee, M. J., White, R. L., Ford, H. C., Blakeslee, J. P., Illingworth, G. D., Coe, D. A., & Tran, K.-V. H. 2005b, ApJ, 634, 813
- Jee et al. (2006) Jee, M. J., White, R. L., Ford, H. C., Illingworth, G. D., Blakeslee, J. P., Holden, B., & Mei, S. 2006, ApJ, 642, 720
- Jee et al. (2007a) Jee, M. J., et al. 2007a, ApJ, 661, 728
- Jee et al. (2007b) Jee, M. J., Blakeslee, J. P., Sirianni, M., Martel, A. R., White, R. L., & Ford, H. C. 2007b, PASP, 119, 1403
- Jeltema et al. (2001) Jeltema, T. E., Canizares, C. R., Bautz, M. W., Malm, M. R., Donahue, M., & Garmire, G. P. 2001, ApJ, 562, 124
- Joy et al. (2001) Joy, M., et al. 2001, ApJ, 551, L1
- Kaiser& Squires (1993) Kaiser, N., & Squires, G. 1993, ApJ, 404, 441
- Kravtsov et al. (2006) Kravtsov, A. V., Vikhlinin, A., & Nagai, D. 2006, ApJ, 650, 128
- Krist (2003) Krist, J. 2003, 2003-06
- Marshall et al. (2002) Marshall, P. J., Hobson, M. P., Gull, S. F., & Bridle, S. L. 2002, MNRAS, 335, 1037
- Maughan et al. (2003) Maughan, B. J., Jones, L. R., Ebeling, H., Perlman, E., Rosati, P., Frye, C., & Mullis, C. R. 2003, ApJ, 587, 589
- Maughan et al. (2004) Maughan, B. J., Jones, L. R., Ebeling, H., & Scharf, C. 2004, MNRAS, 351, 1193
- Maughan et al. (2007) Maughan, B. J., Jones, C., Jones, L. R., & Van Speybroeck, L. 2007, ApJ, 659, 1125
- Navarro, Frenk, & White (1997) Navarro, J. F., Frenk, C. S., & White, S. D. M. 1997, ApJ, 490, 493
- Refregier (2003) Refregier, A. 2003, MNRAS, 338, 35
- Rhodes et al. (2007) Rhodes, J. D., et al. 2007, ApJS, 172, 203
- Riess (2004) Riss, A. & Mack, J. 2004, 2004-006
- Schneider et al. (1998) Schneider, P., van Waerbeke, L., Jain, B., & Kruse, G. 1998, MNRAS, 296, 873
- Scoville (2006) Scoville, N. 2006, Bulletin of the American Astronomical Society, 38, 1211
- Seitz & Schneider (1997) Seitz, C., & Schneider, P. 1997, A&A, 318, 687
- Seitz et al. (1998) Seitz, S., Schneider, P., & Bartelmann, M. 1998, A&A, 337, 325
- Sirianni et al. (2005) Sirianni, M., et al. 2005, PASP, 117, 1049
- Tozzi et al. (2003) Tozzi, P., Rosati, P., Ettori, S., Borgani, S., Mainieri, V., & Norman, C. 2003, ApJ, 593, 705
- Vikhlinin et al. (2002) Vikhlinin, A., VanSpeybroeck, L., Markevitch, M., Forman, W. R., & Grego, L. 2002, ApJ, 578, L107
- Vikhlinin et al. (2006) Vikhlinin, A., Kravtsov, A., Forman, W., Jones, C., Markevitch, M., Murray, S. S., & Van Speybroeck, L. 2006, ApJ, 640, 691